3838
Early Detection of Increased Marrow Adiposity with Age Using Z-Spectral MRI1School of Biomedical Engineering, Southern Medical University, Guangzhou, Guangdong, China, 2Guangdong Provincial Key Laboratory of Medical Image Processing, Southern Medical University, Guangzhou, Guangdong, China, 3The Department of Radiology and Bioengineering, College of Medicine, University of Illinois at Chicago, Chicago, IL, United States, 4Department of Bioengineering, University of Illinois at Chicago, Chicago, IL, United States
Synopsis
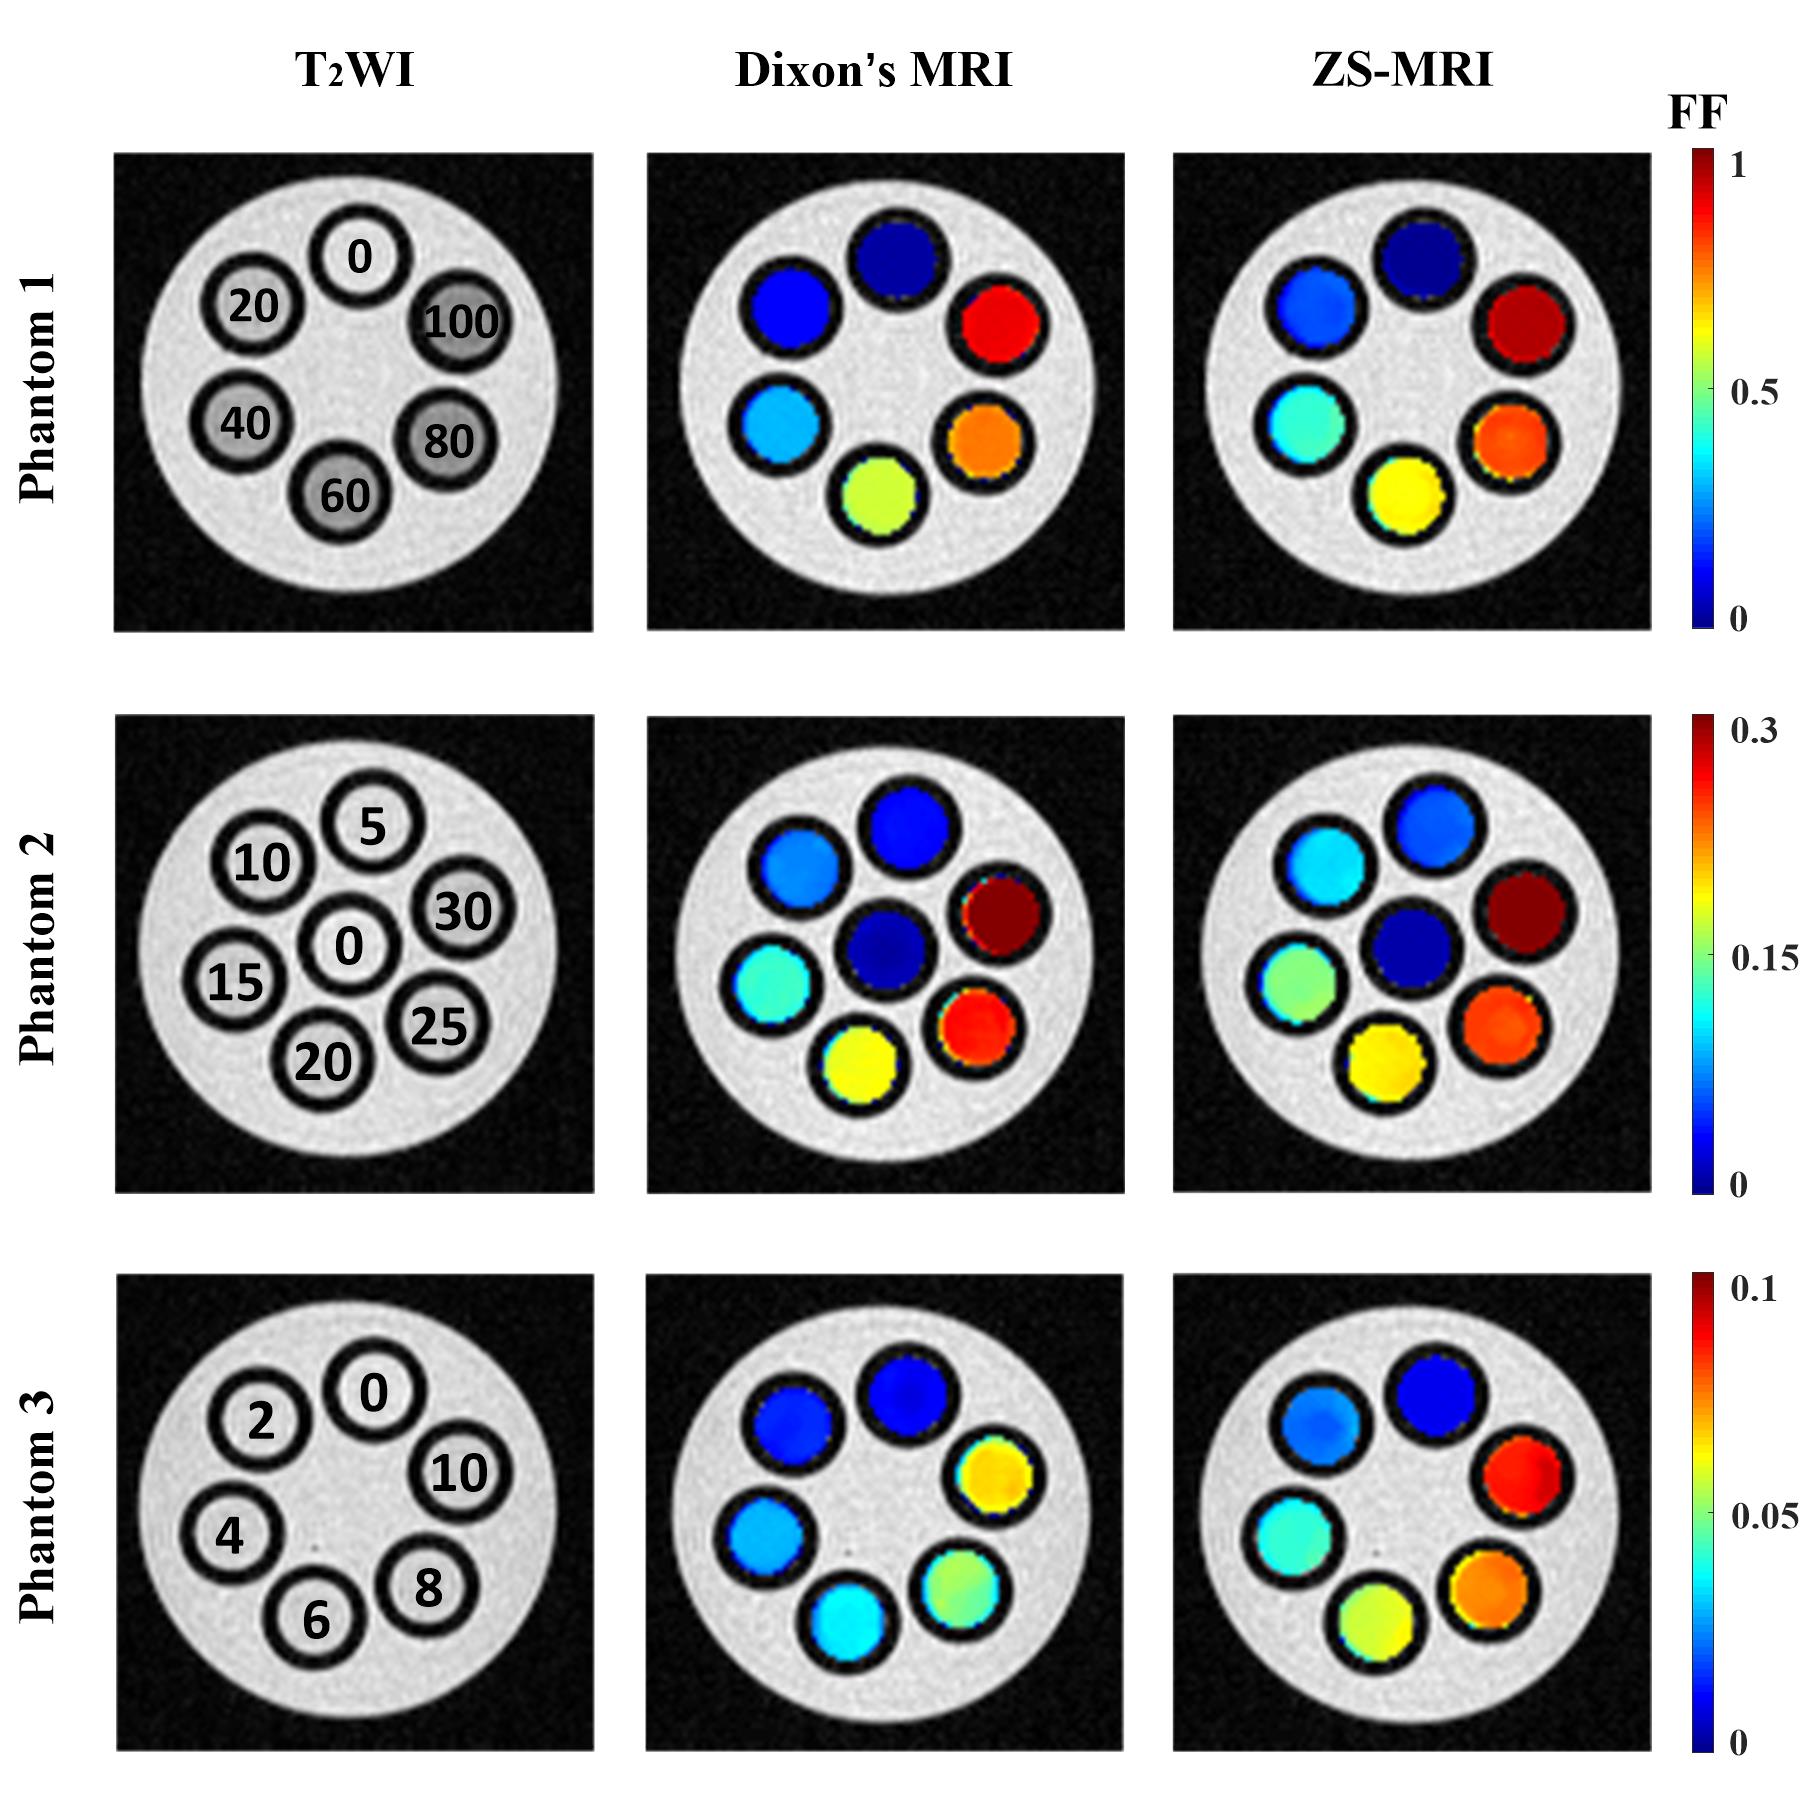
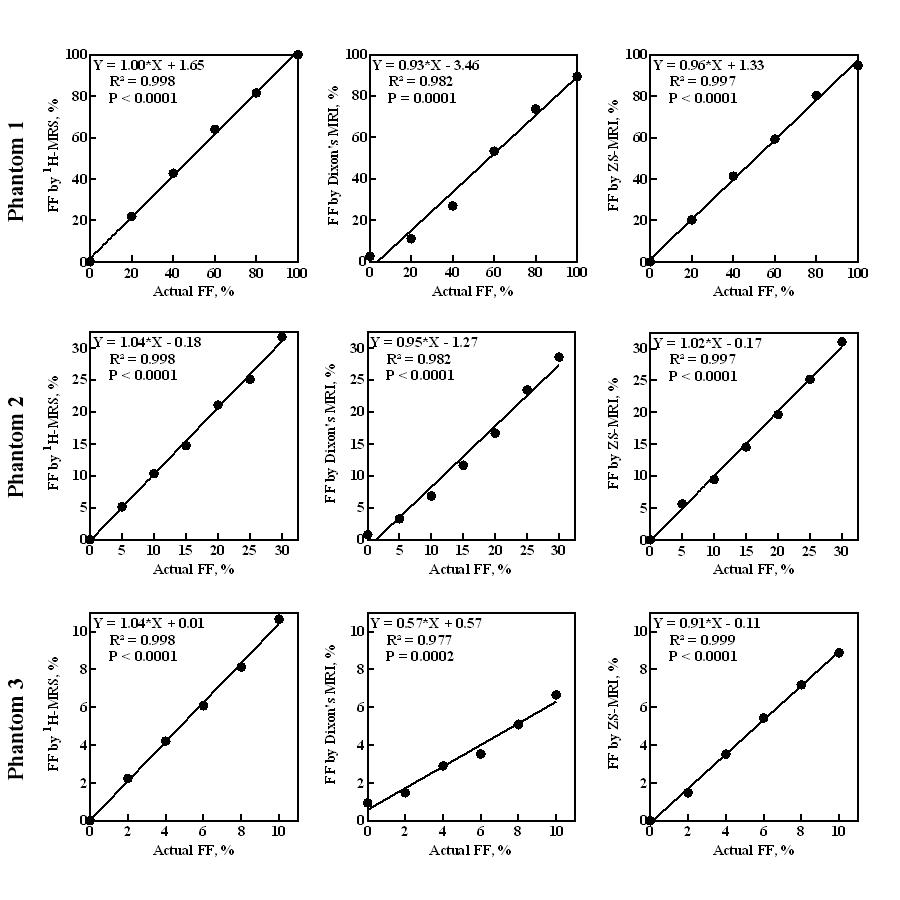
To investigate the capability of Z-spectral magnetic resonance imaging (ZS-MRI) for the quantification of marrow adipose tissue (MAT) content in rat’s lumbar spine and to monitor the MAT changes due to age. First, three sets of water-oil mixed phantoms prepared with varying fat fractions (FF) were scanned and the quantification results were compared to 1H-MRS and Dixon’s MRI methods. Then, ZS-MRI was used to longitudinally monitor the adiposity in the lumbar spine of healthy-young rats at 13, 17 and 21 weeks along with 1H-MRS and Dixon’s MRI. The changes over time in FF of MAT were confirmed by histology staining.
Introduction
Different from brown adipose tissue (BAT) and white adipose tissue (WAT), marrow adipose tissue (MAT) appears as a unique fat depot, and its presence is key to the interaction between bone and fat [1]. Changes in MAT could lead to skeletal fragility and hematologic insufficiency [2]. MAT is strongly associated with bone loss, and it has been proven that aging, anorexia nervosa, calories-restricted diet, and decreased estrogen secretion in postmenopausal women all lead to an increase in MAT, which leads to bone loss and further causes osteoporosis. 1H-Magnetic Resonance Spectroscopy (1H-MRS) and Dixon’s MRI have been used to calculate the MAT content in human, but they suffer from low resolution or artifacts arising from field heterogeneities and phase wrapping. Z-spectral magnetic resonance imaging (ZS-MRI) has been used to differentiate BAT from WAT in the initial applications [3]. However, no studies have been attempted for the quantification of MAT in bone using ZS-MRI.Methods
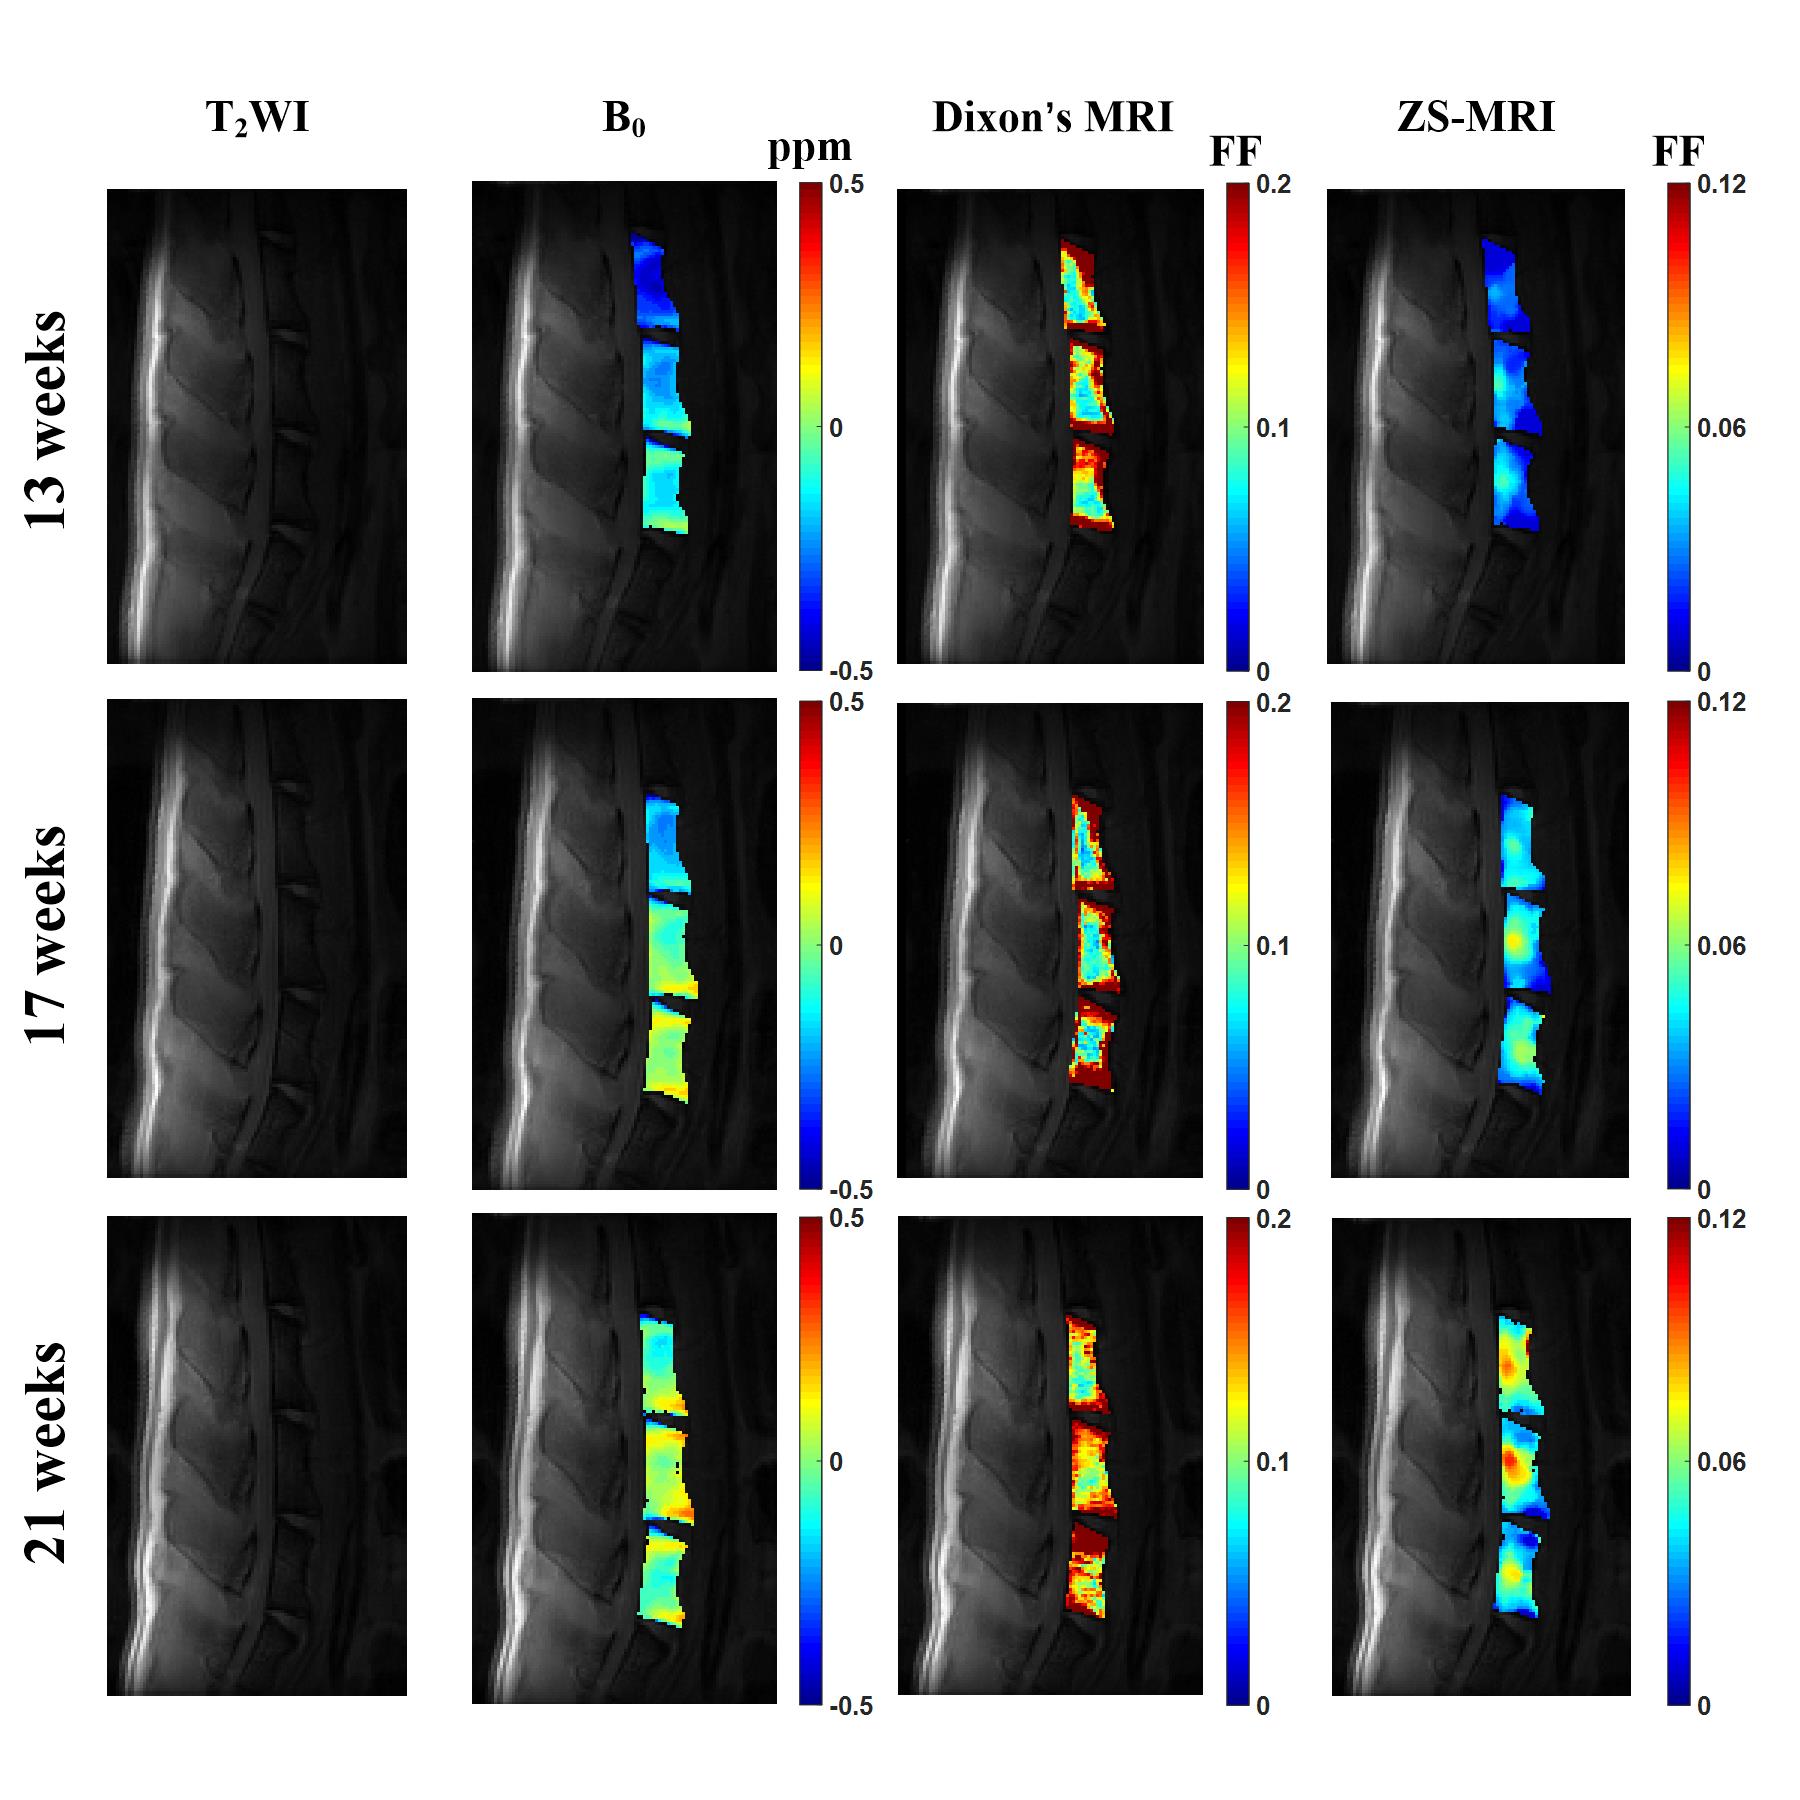
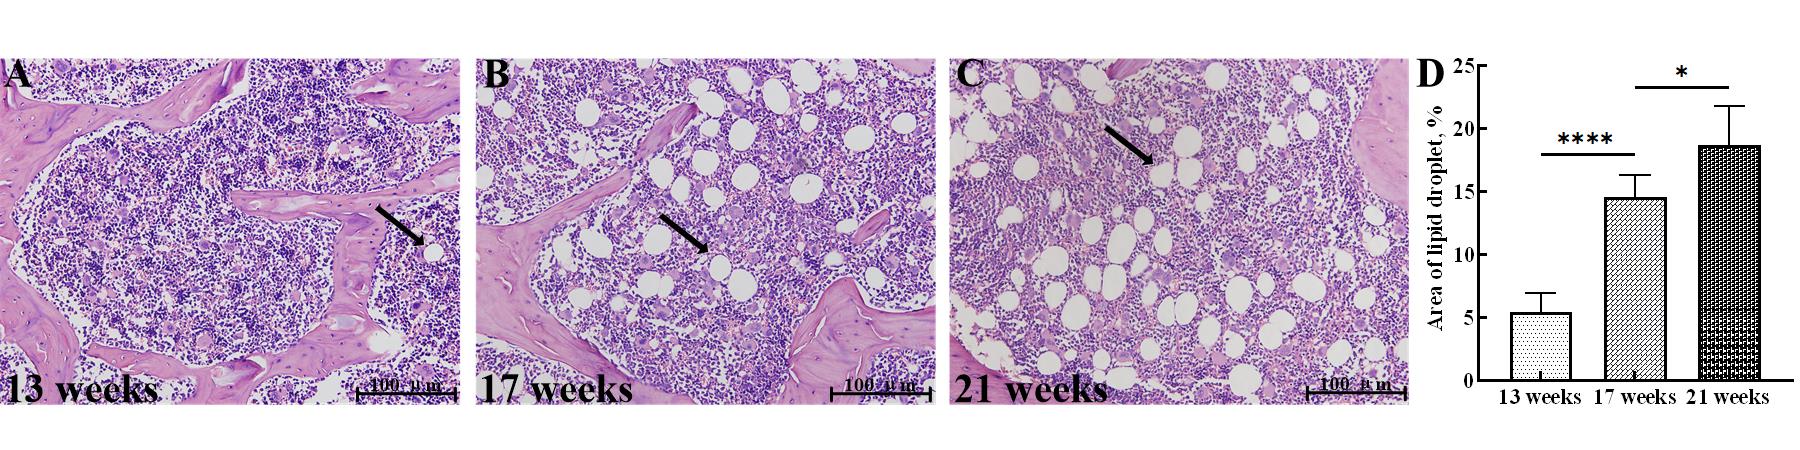
All MRI data were acquired on a 7T small-bore MRI scanner. Z-spectral data were collected by a CEST sequence with a saturation pulse of 4.0 µT, 500 ms long for phantom study and 2.0 µT, 500 ms long for in vivo rat study, at a frequency range within ±8ppm and followed by rapid imaging with refocused echoes readout. Z-spectral data were fitted to a multi-Lorentzian model to separately quantify the fat, water and the semi-solid magnetic transfer (MT) effect from tissues. The amplitudes of the fitted water and fat peaks were used to evaluate the fat fraction (FF) map. First, to verify the feasibility of ZS-MRI, three phantoms with varying fat fractions were obtained and the quantification results were compared to 1H-MRS and Dixon’s MRI methods. Then, ZS-MRI was used to longitudinally monitor the adiposity in the lumbar spine of seven healthy rats at 13, 17 and 21 weeks along with 1H-MRS and Dixon’s MRI. Hematoxylin-eosin (HE) histological staining was performed on L5 vertebra to evaluate the adiposity of MAT at different ages.Results
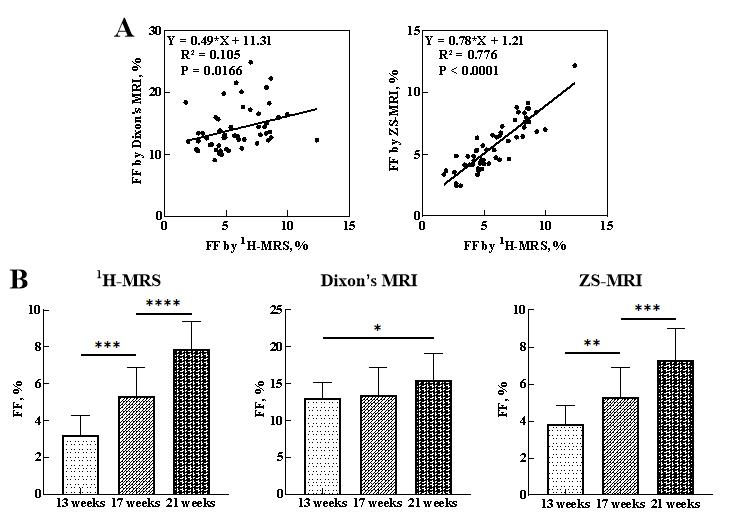
In vitro experiment, both ZS-MRI and Dixon’s MRI can distinguish and accurately quantify the fat content of phantoms, and the results are in good consistency with the actual fat fractions (Figure 1, 2). ZS-MRI's quantification of lumbar MAT content in rats was in better agreement to 1H-MRS measurements (R2 = 0.77, P < 0.001) rather than the Dixon’s results, which consistently mischaracterize the fat content in the spine (Figure 3, 4). The changes over time in FF were confirmed by histology staining (Figure 5).Conclusion
In summary, we demonstrated the feasibility of ZS-MRI in quantifying lumbar fat content in vivo, providing a new imaging method for the quantification of lumbar fat. Compared with the results from Dixon’s MRI, the results from ZS-MRI have better consistency with 1H-MRS’s in the quantitative measurement of lumbar spinal MAT in rats. ZS-MRI can directly reflect the subtle changes of early MAT content in vivo, which may serve as a valuable tool for the assessment of pathological conditions, such as anorexia nervosa and obesity in adolescents.Acknowledgements
This study was supported by National Natural Science Foundation of China (81871349 and 61671228), Science and Technology Program of Guangdong (2018B030333001 and 2017B090912006).References
1. Li Z, Hardij J, Bagchi DP, Scheller EL, MacDougald OA. Development, regulation, metabolism and function of bone marrow adipose tissues. Bone. 2018 May;110:134-40.
2. Hawkes CP, Mostoufi-Moab S. Fat-bone interaction within the bone marrow milieu: Impact on hematopoiesis and systemic energy metabolism. Bone. 2019;119:57-64.
3. Scotti A, Tain RW, Li W, et al. Mapping brown adipose tissue based on fat water fraction provided by Z-spectral imaging. J Magn Reson Imaging. 2018; 47(6):1527-1533.
Figures