3837
Characterization of the triglyceride fatty acid composition and adipocyte size in human adipose tissue using SHORTIE STEAM: in vitro validation1Department of Diagnostic and Interventional Radiology, School of Medicine, Technical University of Munich, Munich, Germany, 2Else Kröner Fresenius Center for Nutritional Medicine, Technical University of Munich, Freising, Germany, 3Department of Surgery, Klinikum rechts der Isar, School of Medicine, Technical University of Munich, Munich, Munich, Germany, 4ZIEL Institute for Food & Health; Research Group Lipid Metabolism, Technical University of Munich, Freising, Germany
Synopsis
Short-TR multi-TI multi-TE (SHORTIE) STEAM is a promising technique for the characterization of adipose tissue since it allows the non-invasive simultaneous probing of triglyceride fatty acid composition and triglyceride T1- and T2-relaxation times. The present in vitro study of human adipose tissue aims at the validation of the SHORTIE-assessed triglyceride fatty acid composition with gas chromatography–mass spectrometry and investigates potential correlations of the triglyceride relaxation properties with adipocyte cell size from histology.
Introduction / Purpose
The non-invasive characterization of adipose tissue (AT) has gained interest in the context of obesity, cachexia and the metabolic syndrome.1–3 A quantitative MR-based method able to assess characteristics of expressed patterns in AT may help to better understand underlying mechanisms and may allow to identify individuals that are at higher risk to develop certain medical disorders.Recent MR studies have been focusing on two main AT characteristics: the triglyceride fatty acid composition (FAC)4 as characterized by the number of double bounds (ndb), the number of methylene interrupted double bounds (nmidb) per triglyceride and the mean fatty acid carbon chain length (CL);5 and the probing of the mean adipocyte size using high b-value diffusion-weighted MRS.6 Also T1 relaxation properties of triglycerides have been associated with AT microstructure.7,8 However, little is known on the potential association between T1 and T2 relaxation of triglycerides with adipocyte size.
In order to simultaneously probe both the triglyceride FAC and the relaxation properties of triglycerides it is required to resolve information in the chemical shift, T1 and T2 dimension. Thus, short-TR multi-TI multi-TE (SHORTIE) STEAM MRS is an ideal candidate sequence, given its previously shown agreement in the determination of triglyceride parameters with gas chromatography–mass spectrometry (GC-MS)9 and its capability of measuring relaxation properties10.
Therefore, the purpose of the present in vitro study of human AT is to validate SHORTIE-derived triglyceride parameters with GC-MS and to investigate a potential relationship of triglyceride relaxation properties with the mean adipocyte size determined by histology.
Methods
Sample collection, preparation, GC-MS and histologyIn total 32 human AT samples fixed via 4%-formaldehyde (Carl-Roth, Karlsruhe, Germany) were collected during abdominoplasty, bariatric surgery and omentectomy in abdominal surgery. Samples were used for MR-measurements and histological adipocyte size determination (phenotypic information in Table 1 (Fig. 2)). Approximately 10mg of each sample was immediately snap-frozen and the FAC was determined based on fatty acid methyl ester GC-MS (FAME-GC-MS).11
For the histological determination of adipocyte size at least three 5 µm thick H&E-stained sections were generated. Stitched large area HDR images were recorded at 20x magnification (VHX 7000, Keyence, Neu-Isenburg, Germany) and adipocyte cross-sectional area was determined using the built-in microscope software.
MRS acquisition
A single-voxel SHORTIE STEAM MRS sequence (Fig. 1) was used with the following parameters: default voxel-size of 12x12x12mm3, TI=8/83/233/458/833/1133ms, TE=10/15/20/25/70ms, TM=16ms, TR(min)=801ms, τ=774ms, 4 phase cycles; 4 averages, number of samples=2048, spectral bandwidth=3000Hz, scan time=02:32min
All measurements were performed on a 3T scanner (Ingenia Elition X, Philips Healthcare, The Netherlands) at room temperature (21±1°C) using the 8-channel small extremity coil or the 8-channel wrist coil (depending on sample size).
MRS quantification
A joint-series time domain-based model fitting routine using the NL2SOL algorithm12 was implemented in MATLAB (R2019b). The following signal equation incorporating the SHORTIE-specific relaxation behavior was modeled:10
$$S(t)=e^{j\phi}\sum_{i}\rho_{i}e^{\left(j2\pi\omega_{i}-d_{i}-g_{i}t\right)t}\left(1-2e^{-\frac{TI}{T_{1,i}}}+e^{-\frac{\tau+Tl}{T_{1,i}}}\right)e^{-\frac{TM}{T_{1,i}}}e^{-\frac{TE}{T_{2,i}}}$$
where $$$\rho_i$$$: proton density, $$$d_i$$$ and $$$g_i$$$: the Lorentzian and Gaussian damping factors, respectively, and $$$\omega_i$$$: precession frequency of the $$$i$$$th frequency component, respectively, and $$$\phi$$$represents a common additional phase term. A relaxation- and triglyceride-constrained 10-peak-triglyceride model with in total 19 degrees of freedom as outlined in Table 2 (Fig. 2) was employed for the signal quantification.
Results
Fig. 3 shows exemplary achievable spectral resolution and the resulting signal model fitting. The characterization of the triglyceride parameters for SHORTIE correlated well with GC-MS for ndb (r=0.458,p=0.008) and nmidb (r=0.784,p<0.001) but showed only a weak trend for CL (r=0.267,p=0.139). (Fig. 4) A slightly stronger correlation for the mean adipocyte area vs. the T1 relaxation (r=0.530,p=0.002) compared to the T2 relaxation was detectable (r=0.414,p=0.018), respectively. (Fig. 5)Discussion
The correlation of MRS-assessed triglyceride parameters with GC-MS confirmed previous reports using the same technique in vitro9 or in vivo using long-TE13 and multi-TE14 MRS. The observed correlation of the T1 and T2 relaxation with the mean adipocyte size is reported for the first time using spectroscopy. Previously, Garnov et al.7 reported in a study with a small sample size (n=8) the correlation of imaging-based in vivo T1 relaxation at 1.5T with adipocyte size, but without the modeling of the complex triglyceride signal behavior. Albeit the exact mechanisms require further investigation, the reported connection between adipocyte size and relaxation properties is a novel finding and of high interest in the context of dysfunctional adipose tissue and obesity/cachexia where the origin of observed variations of relaxation properties remains unclear.7,8,15 The observed relationship between relaxation times and adipocyte size is of particular importance given the technical challenges related to performing diffusion-weighted measurements for assessing lipid droplet size in vivo (sensitivity to motion). Limitations of the study include that i) most samples are from female individuals, ii) SHORTIE measurements were quantified using a specific set of constraints and were not corrected for J-modulation effects, iii) the sampling scheme was not adjusted for optimal parameter estimation and iv) GC-MS measures all present fatty acids (not only these from triglycerides) and MRS measures only MR-visible lipids (also not only these from triglycerides).Conclusion
The current in vitro adipose tissue study revealed good agreement for SHORTIE STEAM-assessed triglyceride parameters ndb and nmidb with GC-MS and demonstrated for the first time that the fitted T1 and T2 relaxation times correlated with the mean adipocyte size from histology.Acknowledgements
The authors would like to thank Mark Zamskiy, Lisa Patzelt and Cora Held for their help with the samples scanning and Dr. Ursula Schulze-Eilfing and Dr. Charlotte Kleeberger for sample preparation. The present work was supported by the European Research Council (grant agreement No 677661, ProFatMRI and grant agreement No 875488, FatVirtualBiopsy). This work reflects only the authors view and the EU is not responsible for any use that may be made of the information it contains. The authors also acknowledge research support from Philips Healthcare.References
1. Wajchenberg BL. Subcutaneous and visceral adipose tissue: their relation to the metabolic syndrome. Endocrine reviews. 2000;21(6):697-738. doi:10.1210/edrv.21.6.0415
2. Cordes C, Baum T, Dieckmeyer M, et al. MR-Based assessment of bone marrow fat in osteoporosis, diabetes, and obesity. Frontiers in Endocrinology. 2016;7(6):74. doi:10.3389/fendo.2016.00074
3. Hu HH, Branca RT, Hernando D, et al. Magnetic resonance imaging of obesity and metabolic disorders: Summary from the 2019 ISMRM Workshop. Magnetic Resonance in Medicine. 2019;1863:1115. doi:10.1002/mrm.28103
4. Peterson P, Trinh L, Månsson S. Quantitative 1H MRI and MRS of fatty acid composition. Magnetic Resonance in Medicine. 2021;85(1):49-67. doi:https://doi.org/10.1002/mrm.28471
5. Hamilton G, Yokoo T, Bydder M, et al. In vivo characterization of the liver fat 1H MR spectrum. NMR in Biomedicine. 2011;24(7):784-790. doi:10.1002/nbm.1622
6. Weidlich D, Honecker J, Gmach O, et al. Measuring large lipid droplet sizes by probing restricted lipid diffusion effects with diffusion-weighted MRS at 3T. Magnetic Resonance in Medicine. 2019;81(6):3427-3439. doi:10.1002/mrm.27651
7. Garnov N, Linder N, Schaudinn A, et al. Comparison of T1 relaxation times in adipose tissue of severely obese patients and healthy lean subjects measured by 1.5 T MRI. NMR in Biomedicine. 2014;27(9):1123-1128. doi:10.1002/nbm.3166
8. Lehmann S, Linder N, Retschlag U, et al. MRI assessment of changes in adipose tissue parameters after bariatric surgery. PLOS ONE. 2018;13(11):e0206735. doi:10.1371/journal.pone.0206735
9. Ruschke S, Weidlich D, Honecker J, et al. Estimation of the triglyceride fatty acid composition in human adipose tissue using multi-TE and SHORTIE STEAM: in vitro validation using GC-MS. In: Proceedings International Society for Magnetic Resonance in Medicine. Vol 28. ; 2020:2558. Accessed December 2, 2020. https://index.mirasmart.com/ISMRM2020/PDFfiles/2558.html
10. Ruschke S, Weidlich D, Wu M, Hoch A, Karampinos DC. Single-voxel short-TR multi-TI multi-TE (SHORTIE) STEAM for water–fat magnetic resonance spectroscopy. In: Proceedings International Society for Magnetic Resonance in Medicine. Vol 27. ; 2019:4230. http://archive.ismrm.org/2019/4230.html
11. Ecker J, Scherer M, Schmitz G, Liebisch G. A rapid GC-MS method for quantification of positional and geometric isomers of fatty acid methyl esters. Journal of chromatography B, Analytical technologies in the biomedical and life sciences. 2012;897:98-104. doi:10.1016/j.jchromb.2012.04.015
12. Dennis JE, Gay DM, Welsch RE. Algorithm 573: NL2SOL—An Adaptive Nonlinear Least-Squares Algorithm [E4]. ACM Trans Math Softw. 1981;7(3):369-383. doi:10.1145/355958.355966
13. Lundbom J, Hakkarainen A, Fielding B, et al. Characterizing human adipose tissue lipids by long echo time 1H-MRS in vivo at 1.5 Tesla: validation by gas chromatography. NMR in Biomedicine. 2010;23(5):466-472. doi:10.1002/nbm.1483
14. Trinh L, Peterson P, Leander P, Brorson H, Månsson S. In vivo comparison of MRI-based and MRS-based quantification of adipose tissue fatty acid composition against gas chromatography. Magnetic Resonance in Medicine. 2020;84(5):2484-2494. doi:10.1002/mrm.28300
15. Picarelli A, Borghini R, Marino M, et al. Visceral and subcutaneous adipose tissue as markers of local and systemic inflammation: a comparison between celiac and obese patients using MRI. Tech Coloproctol. 2020;24(6):553-562. doi:10.1007/s10151-020-02173-1
Figures
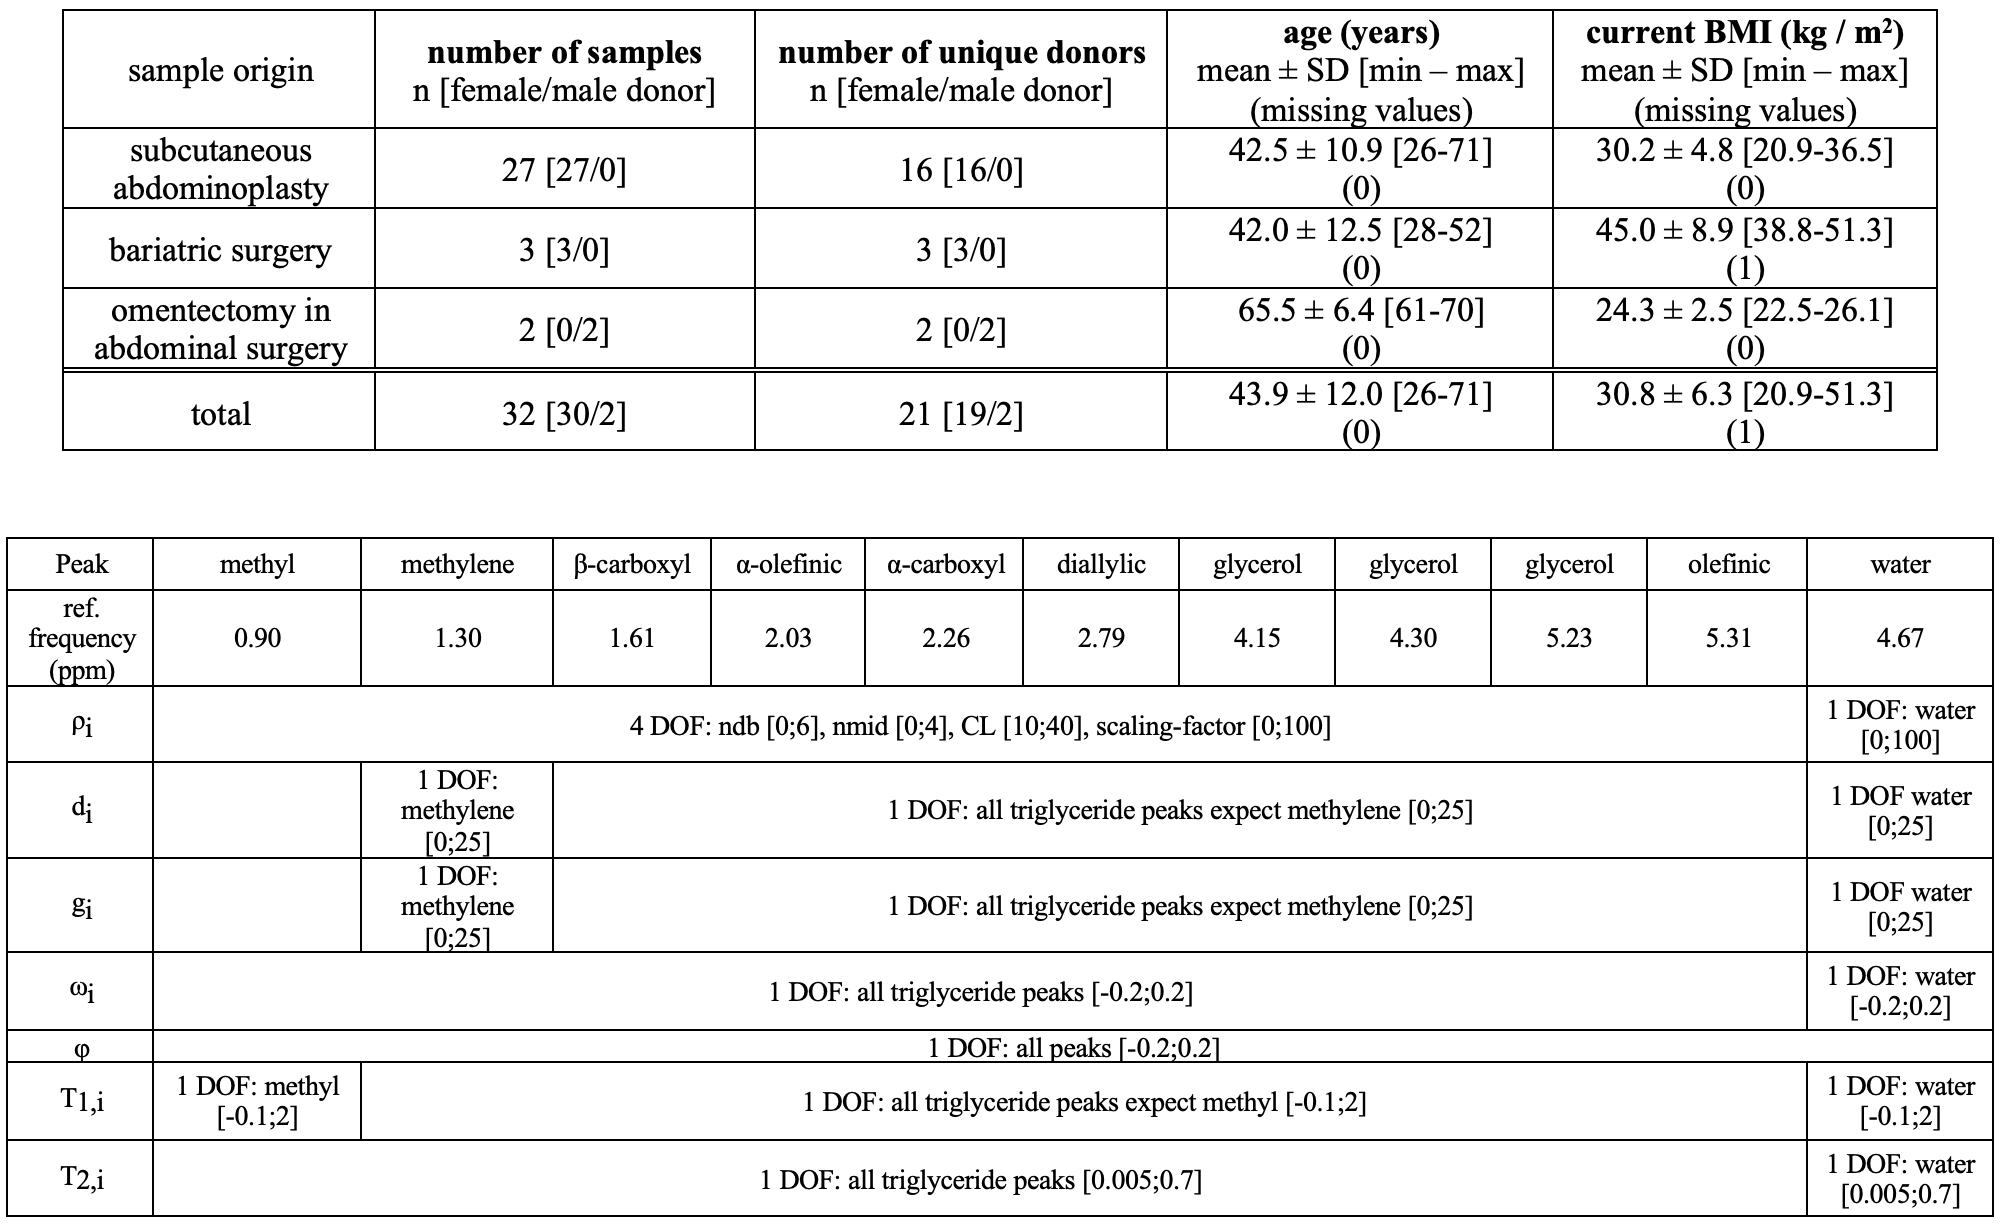
Figure 2:
Table 1 (upper Table): Phenotypic cohort characteristics. The dominance of samples from female donors is due to limited availability of male donors.
Table 2 (lower Table): Description of the fitting model: A relaxation- and triglyceride-constrained 10-peak-triglyceride model was fitted with an extra water peak resulting in a total of 19 degrees of freedom (DOF). Methyl was fitted with a separated T1 value due to the known large difference in T1 compared to the other triglyceride peaks. Upper and lower limits are given in square brackets, e.g. [lower bound; upper bound].