3836
Natural abundance deuterium MRS of the human calf and T1 measurements with a surface coil at 3 T1School of Medicine, University of Nottingham, Nottingham, United Kingdom, 2NIHR Nottingham Biomedical Research Centre/Nottingham Clinical Research Facilities, University of Nottingham, Nottingham, United Kingdom, 3Sir Peter Mansfield Imaging Centre, University of Nottingham, Nottingham, United Kingdom, 4School of Physics & Astronomy, University of Nottingham, Nottingham, United Kingdom, 5MRC-Versus Arthritis Centre for Musculoskeletal Ageing Research, University of Nottingham, Nottingham, United Kingdom, 6School of Life Sciences, University of Nottingham, Nottingham, United Kingdom
Synopsis
Deuterium spectra of the human calf were obtained at natural abundance, at 3 T field strength. Two peaks with a chemical shift separation of 3.5 ppm were observed, corresponding to water and lipids, and their relaxation times T1 and T2* were measured using a transceive surface coil. Utilising the complex data to fit spectral lines, including independent phases for each peak, and fitting the complex inversion-recovery data enabled measurements of T1 which could be frustrated by inversion-time-dependent phases caused by RF imperfections. The results indicate that such measurements in humans are possible despite the low natural abundance of 2H.
Introduction
Use of deuterium oxide D2O as a tracer allows simultaneous measurement of the turnover of multiple substrate pools in free-living humans in short and long term studies1. Deuterium magnetic resonance allows in vivo measurement of uptake and metabolization of D2O. In such studies, spectra often display two dominant peaks; water (HDO) and a peak appearing at a chemical shift of approximately 2.7 – 3.8 ppm lower2 – 6. The reported position of this second peak varies within the literature and might be dependent on the metabolic context of the research. Here, as a precursor to tracer studies we have explored the deuterium spectrum obtained from the lower leg at natural abundance, characterising the T1 and T2* relaxation times of the two spectral lines and demonstrating that measurements are feasible at 3 T magnetic field strength on a clinical scanner using a transceive, surface RF coil.Methods
Non-localised inversion-recovery measurements were performed on the calf of four human volunteers, using an in-house-built deuterium surface coil (planar, 12.5 cm approximate diameter) resonating at 19.6 MHz, interfaced to a Philips Achieva 3T imaging system. The coil produced a field of approximately 40 μT at the calf surface. Inversion was achieved by a 900 Hz bandwidth adiabatic pulse, followed by a period, τ, before a non-selective RF pulse of 90° nominal flip-angle was applied. Further experimental details are given in Figure 3.Data were analysed using code written in MATLAB (MathWorks, Natick, USA). Spectra acquired with an inhomogeneous surface coil over a large volume can possess peaks with different phases due to the averaging of various RF factors over a spatial concentration distribution which is different for the molecules producing the spectral peaks. Therefore, a global zeroth-order phase-correction cannot be applied. Instead, the complex spectra were fitted to a sum of two complex Lorentzian lineshape functions employing independent phases for each spectral peak, as well as amplitude, frequency, and R2*. The inappropriateness of a simple phase-correction and the fact that the phases are functions of inversion time (other than the usual phase-shift at the null-point) mean that the inversion-recovery curve also needs to be analysed as a complex function, as
$$M(τ)=α-β \exp \left( -\frac{τ}{T_1}\right) + (β-α) \exp\left( -\frac{T_{\mathrm R}}{T_1}\right), \quad α,β\in\mathbb{C}, \quad T_1\in\mathbb{R}, \qquad\qquad\qquad\qquad (1)$$
where $$$M(τ)$$$ is the complex magnetization (determined by the spectral amplitude and phase).
Results
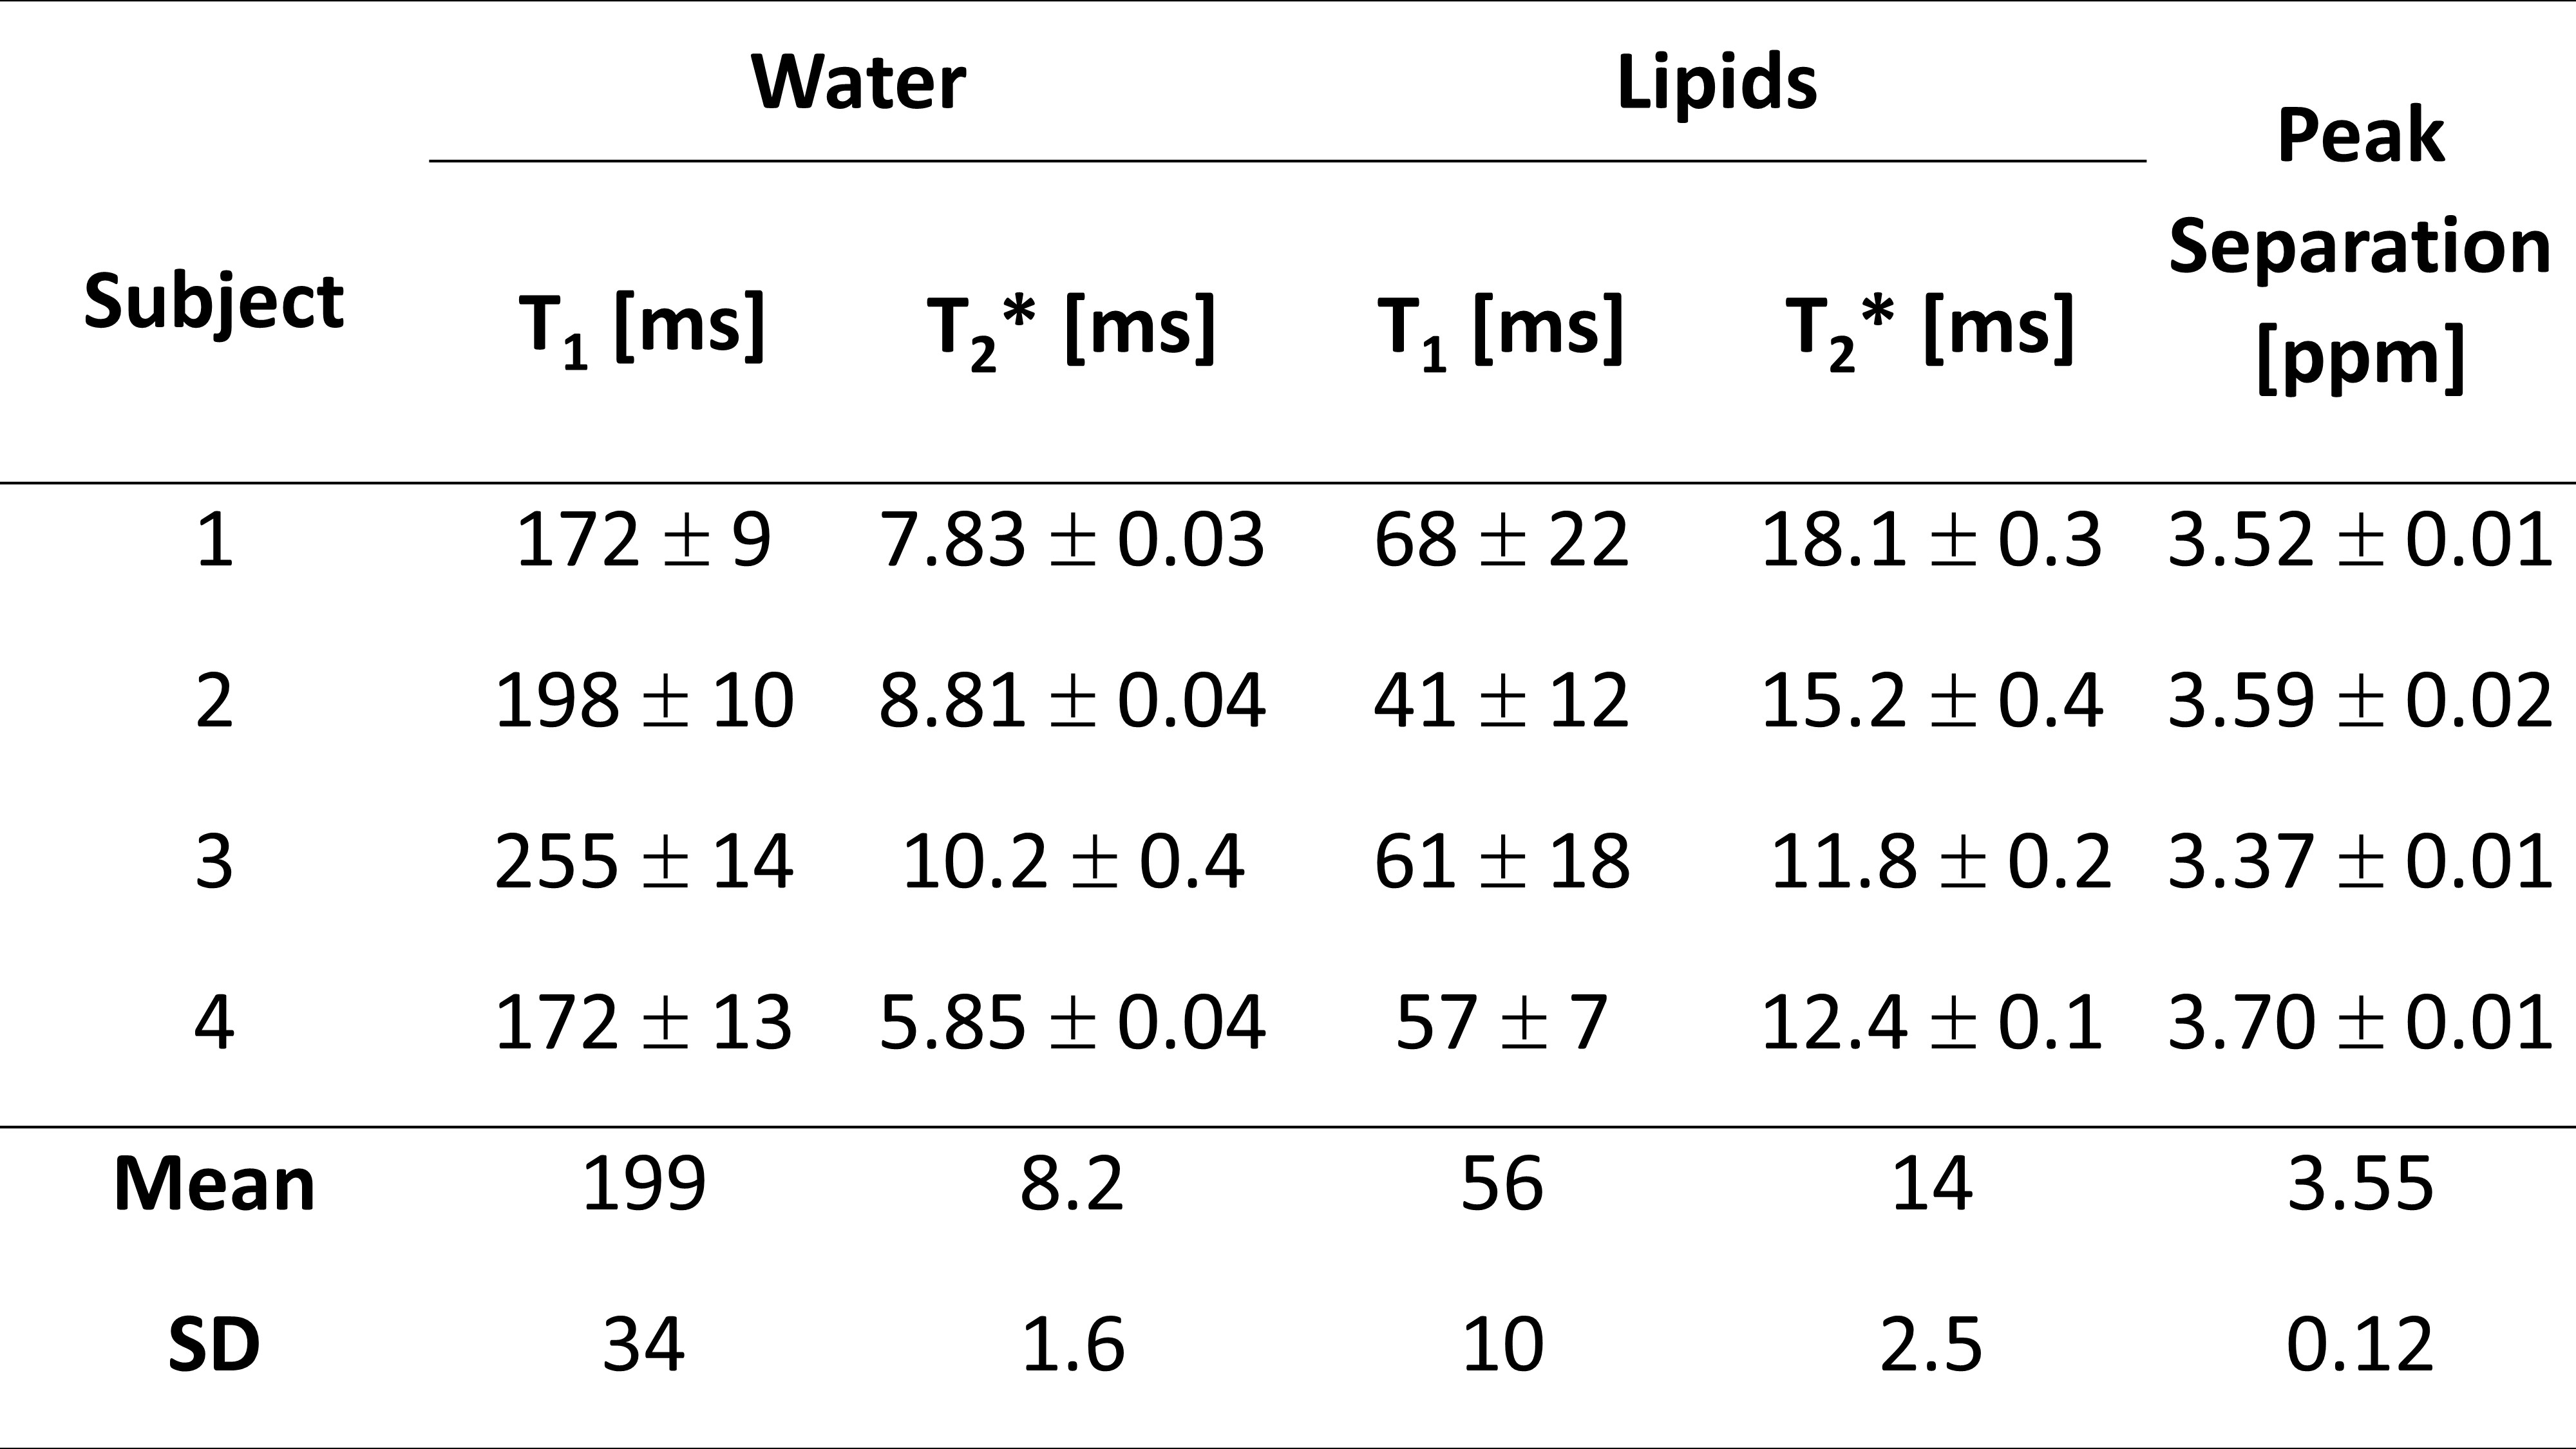
Figure 2 shows a typical spectrum of the natural abundance deuterium from the calf. Two peaks are clearly visible: a water peak (HDO) and a peak at 3.5 ppm lower. After correcting for applied line-broadening, mean T2* values were obtained for HDO of 8.2 ± 1.6 ms, and 14.0 ± 2.5 ms for lipids (n=4, see Table 1).Figure 3 shows a set of spectra acquired during an inversion-recovery experiment. All spectra were globally shifted in reference to the spectrum of longest inversion time. Figure 4 shows the complex spectral amplitudes and their fitted lines according to equation 1, for each of the two peaks (HDO and lipids). Mean T1 values were found to be 199 ± 34 ms for HDO and 56 ± 10 ms for lipids (n=4, see Table 1).
Discussion
From our measurements of the lipid signal’s 3.55 ppm chemical shift, it most likely originates predominantly from deuterium in methylene groups (-CH2-) of fatty acids and triglycerides, consistent with signals observed in proton MRS7, in agreement with most previous in vivo 2H measurements. In studies that administered D2O to normal, obese, and diabetic mice, water and a second peak—assumed to be CHD groups from adipose tissues—were observed2,3, and the position of the CHD peak was in the approximate range 3.4 ± 0.4 ppm below the water resonance. Similarly, experiments on rats produced a lipid signal at approximately 3.4 ppm below the water peak4. In contrast, during experiments on the hind limbs of mice with tumour xenografts5,6, an HDO peak was observed along with a second peak at 2.8 ppm below the water position. In this case, it was suggested5 that this peak arose from cholesterol (or esters of), which is actively synthesised in many tumour cells.Previous deuterium T1 measurements in muscle water produced values of 130 ± 7 ms (mouse, 9.2 MHz, 25°C)8 and 160 ± 2.4 ms (rat, 13.7 MHz, ex vivo)9. Our measured values are higher, possibly due to the higher field strength and in vivo temperature. A previous measurement of the “CHD group” found T1 = 34 ± 4 ms (mouse abdomen, 30.7 MHz, in vivo)2, which is smaller than the value measured here. Our longer value could be a consequence of reduced accuracy caused by incomplete inversion of the lipid magnetization because of its short relaxation time10.
Conclusions
Water (HDO) and lipids (probably triglycerides) were identified in the in vivo spectra from the human calf. Relaxation times T1 and T2* were also measured and were consistent with literature values. Despite poor signal-to-noise ratio at natural abundance and the use of a surface coil for transceive, it was shown that such measurements are possible in a reasonable time period (approximately 30 minutes), suggesting that tracer-based metabolic studies of, e.g., triglyceride synthesis and turnover are possible in humans, and in such experimental conditions.Acknowledgements
This research was funded by the NIHR Nottingham Biomedical Research Centre. The views expressed are those of the authors and not necessarily those of the NHS, the NIHR or the Department of Health and Social Care. DJC’s Ph.D. studies are funded by the Precision Imaging Beacon at the University of Nottingham.References
1. Wilkinson DJ, Brook MS, Smith K, et al. Stable isotope tracers and exercise physiology: past, present and future. J. Physiol. 2017; 595(9): 2873 – 2882.
2. Brereton IM, Irving MG, Field J, et al. Preliminary studies on the potential of in vivo deuterium NMR spectroscopy. Biochem. Biophys. Res. Commun. 1986; 137(1): 579 – 584.
3. Brereton IM, Dodrell DM, Okenfull SM, et al. The Use of in vivo 2H NMR Spectroscopy to investigate the effects of obesity and diabetes mellitus upon lipid metabolism in mice. NMR Biomed. 1989; 2(2): 55 – 60.
4. Kosenkov AV, Gulyaev MV, Lobyshev VI, et al. The reversible effect of deuteration on tissue fluid and biopolymers in normal and tumor tissues of mice. Biophysics 2018; 63(5): 820 – 824.
5. Assmann JC, Brender JR, Farthing DE, et al. In vivo deuterated water labeling allows tumor visualization via deuterium magnetic resonance spectroscopic imaging of cholesterol. bioRxiv 809327. Available from https://doi.org/10.1101/809327 (2020).
6. Assman JC, Brender JR, Farthing DE, et al. Deuterium MRI imaging of xenografted tumors following in vivo deuterated water labeling. Proc. Intl. Soc. Magn. Reson. Med. 2020; 28: 0270.
7. Ren J, Dimitrov I, Sherry AD, et al. Composition of adipose tissue and marrow fat in humans by 1H NMR at 7 Tesla. J. Lipid Res. 2008; 49: 2055 – 2062.
8. Fung BM, McGauchy TW. Study of spin-lattice and spin-spin relaxation times of 1H, 2H, and 17O in muscle water. Biophys. J. 1979; 28: 293 – 304.
9. Block RE, Parekh BC. Deuterium nuclear spin relaxation in biological tissues. Magn. Reson. Med. 1987; 5: 286 – 289.
10. Pfaff AR, McKee CE, Woelk K. Predicting the effect of relaxation during frequency-selective adiabatic pulses. J. Magn. Reson. 2017; 284: 99 – 103.
Figures