3834
Cardiac and Hepatic Metabolism Modulation using L-carnitine injection: 1H Magnetic Resonance Spectroscopy Study1University of Oxford, Oxford, United Kingdom
Synopsis
This study investigated the in vivo effects on acetylcarnitine levels in the heart and the liver after an injection of L-carnitine. Carnitine acts as a buffer of acetyl-CoA units in the mitochondria, as well as facilitating transport of fatty acids. We show that an injection of L-carnitine can alter cardiac lipid levels in the in vivo healthy human. However, even though L-carnitine injection shows high cardiac variability in acetylcarnitine levels, hepatic variability of acetylcarnitine levels were reduced. Further studies are needed to confirm the dose and time-frame of a response in acetylcarnitine levels after L-carnitine injections.
Introduction
L-carnitine is critical for transportation of fatty acids to the mitochondria, it also modulates the intracellular acetyl-CoA/CoA ratio, which is important for controlling the balance between carbohydrate and lipid oxidation[1]. Reduced levels of plasma and cardiac L-carnitine have been reported in patients with cardiovascular disease[2], diabetes[3],[4] and chronic liver disease[5]. Supplementation with L-carnitine has been shown to improve the outcomes in patients with cardiovascular disease who do not have primary carnitine deficiency[6], to reduce plasma lipid levels, cytokines and improve histological scores in patients with non-alcoholic fatty liver disease (NAFLD)[7],[8]. L-carnitine buffers acetyl-CoA within the mitochondria through the generation of acetylcarnitine. Recently, it has been shown that tissue acetylcarnitine can be non-invasively assessed in vivo in skeletal and cardiac muscle, using long echo time 1H-MRS [9]. Therefore, the aim of this study was to explore the effect of post-intravenous injection of L-carnitine on the acetylcarnitine resonance and lipid metabolism in vivo in the liver and the heart using long echo time 1H-MRS in young healthy volunteers.Method
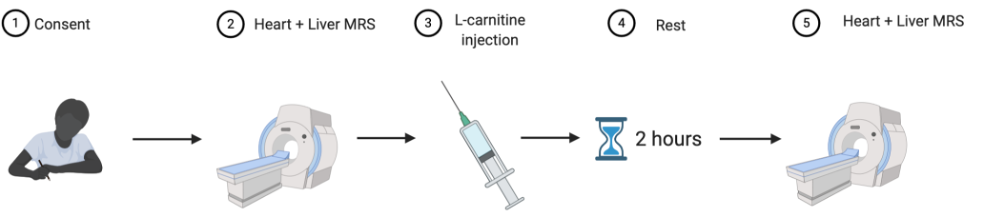
Five healthy volunteers were fasted overnight and refrained from coffee and tea in the morning. Baseline cardiac and liver 1H-MRS was acquired on a 3T system (Prisma, Siemens Healthineers) using a 30-channel phased array coil and a spine coil. Lipid quantification: Five water-suppressed and one non-water-suppressed breath held acquisitions were performed in the cardiac interventricular septum (5 measurements each, TE:10 ms, TR:4 s, voxel: 32×18×22 mm3), and three water-suppressed and one non-water-suppressed breath held acquisitions were performed in the posterior part of the right liver lobe using a single-voxel STEAM sequence (5 measurements each, TE: 10 ms, TR: 4 s, voxel: 20×20×20 mm3). Acetylcarnitine quantification: Five breath held acquisitions using a water-suppression cycled PRESS acquisition [10] (6 measurements each, TE:90 ms, TR: 4 s, voxel: 32×25×22 mm3) in the heart and a free-breathing STEAM acquisition (64 averages, TE:90 ms, TR: 4 s, voxel: 30×30×30 mm3) in the liver.Following baseline MRS, volunteers were given an intravenous injection of L-carnitine (50 mg/kg body weight) and two hours post-injection another set of cardiac and liver spectra was acquired (Figure 1).Fat fraction was calculated using the OXSA toolbox in Matlab[11]. The same software was used for fitting multiple resonances of fat (methyl (d=0.9 ppm), methylene (d=1.3 ppm), allylic (d=2.0 ppm) diacyl (d=2.8 ppm)), and acetylcarnitine. These resonances were then normalized to the unsuppressed water signal. Both hepatic and cardiac spectra were frequency-aligned (using the residual water signal), phased and averaged before fitting with the OXSA toolbox.
Results
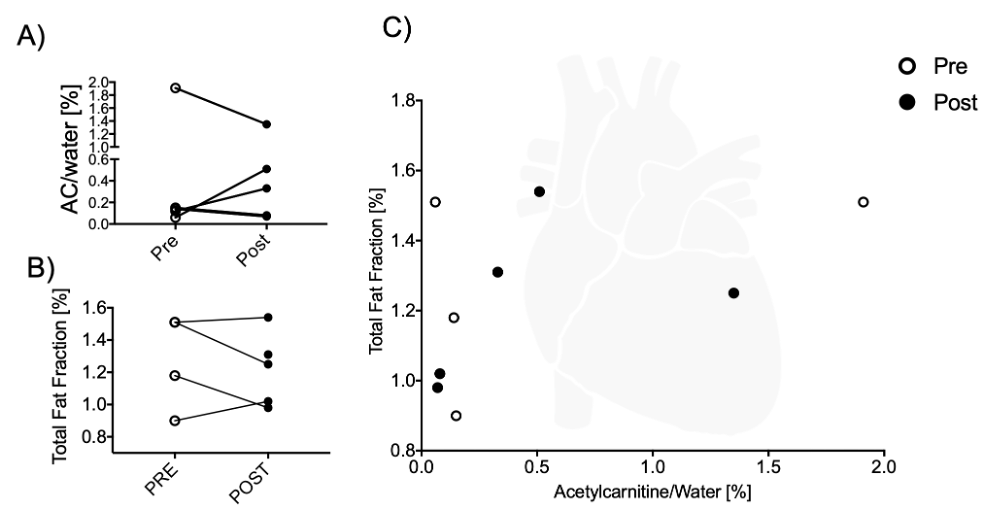
Results were obtained from five volunteers (n = 5, age = 30 ± 4 yr, BMI = 23 ± 2 kg/m2). Lipid peaks in both heart and liver had high variability across all lipid peaks. There was, however, a significant reduction in the allylic peak in the heart after injection of L-carnitine (27 %, p < 0.05, t-test) (Figure 2).After L-carnitine injection, acetylcarnitine levels in the heart were variable (Figure 3A). Total fat fraction did not change significantly (Figure 3B), even though the unsaturated allylic fat was reduced after L-carnitine injection in the heart (Figure 2AB). Total fat fraction was not correlated with acetylcarnitine levels (R2=0.22, p = 0.21) in the heart (Figure 3C).
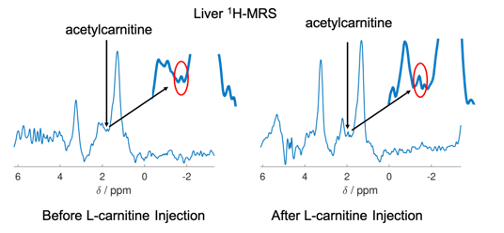
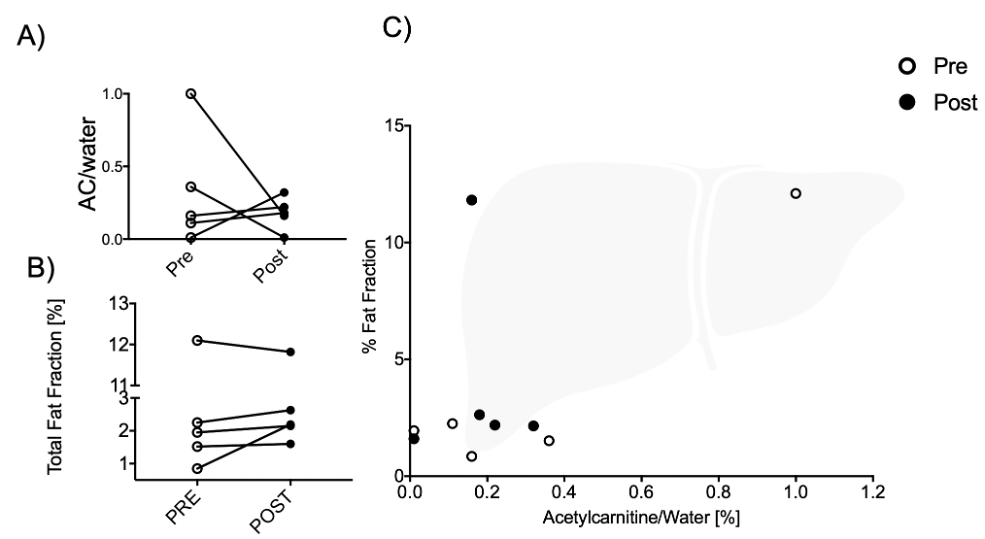
In contrast hepatic acetylcarnitine levels (example spectra illustrated on Figure 4) had reduced variability after injection of L-carnitine compared to before(F-test, p = 0.031, Figure 5A).
Total hepatic fat fraction showed no trend (Figure 5B) and had no correlation with acetylcarnitine levels (Figure 5C). Despite no significant change in total hepatic lipid content, acetylcarnitine levels in the liver correlated positively with the allylic fat peak (R2=0.59, p = 0.009) and with the methylene fat peak (R2=0.43, p = 0.04).
Discussion and Conclusion
This study shows the characterization of in vivo metabolism of fatty acids and acetylcarnitine levels from healthy human livers and hearts in response to an injection of L-carnitine. There was a significant reduction in the cardiac allylic fat peak after intravenous injection of L-carnitine and despite high variability, the individual cardiac lipid peaks were within a reported normal range (0.3-0.6 %)[12]. Even though L-carnitine had no significant effect on lipid levels in the liver, hepatic acetylcarnitine was correlated with both methylene and allylic fat peak in the liver [13], [14]. L-carnitine injection resulted in reduced variability in hepatic acetylcarnitine levels in vivo. A previous study showed that intravenous injection of L-carnitine in healthy volunteers led to a 17 % elevation of whole-body glucose utilization [15], thereby impairing fatty acid metabolism, which may explain the different response from lipid metabolism seen in our study. Further studies are needed to validate that the timing of the MRS acquisition after L-carnitine injection and to test if the dose is sufficient for biological modulation.Acknowledgements
This study was funded by DS (Oxfordshire Health Services Research reference: 2019/1333). LV would like to acknowledge the support of the Slovak Grant Agencies VEGA [2/0003/20] and APVV [#19–0032]. Furthermore, we would like to acknowledge the Novo Nordisk fellowship (DS) and mentor Mette Skalshøj Kjær for her expertise on liver metabolism.References
[1] K. A. Gumaa, P. McLean, and A. L. Greenbaum, “Calculation of the intracellular distribution of acetyl CoA and CoA, based on the use of citrate synthase as an equilibrium enzyme,” FEBS Letters, 1973, doi: 10.1016/0014-5793(73)80559-9.
[2] A. L. Shug et al., “Changes in tissue levels of carnitine and other metabolites during myocardial ischemia and anoxia,” Archives of Biochemistry and Biophysics, 1978, doi: 10.1016/0003-9861(78)90003-6.
[3] N. Tamamoğullari, Y. Siliğ, S. Içağasioğlu, and A. Atalay, “Carnitine deficiency in diabetes mellitus complications.,” Journal of diabetes and its complications, vol. 13, no. 5–6, pp. 251–3, Accessed: Feb. 11, 2019. [Online]. Available: http://www.ncbi.nlm.nih.gov/pubmed/10764998.
[4] G. la Marca, S. Malvagia, S. Toni, B. Piccini, V. di Ciommo, and G. F. Bottazzo, “Children who develop type 1 diabetes early in life show low levels of carnitine and amino acids at birth: does this finding shed light on the etiopathogenesis of the disease?,” Nutrition & Diabetes, vol. 3, no. 10, pp. e94–e94, Oct. 2013, doi: 10.1038/nutd.2013.33.
[5] M. A. Selimoģlu, S. Aydoģdu, R. v. Yaģci, and A. Huseyinov, “Plasma and liver carnitine status of children with chronic liver disease and cirrhosis,” Pediatrics International, vol. 43, no. 4, pp. 391–395, 2001, doi: 10.1046/j.1442-200X.2001.01423.x.
[6] J. H. Thomsen, A. L. Shug, V. U. Yap, A. K. Patel, T. J. Karras, and S. L. DeFelice, “Improved pacing tolerance of the ischemic human myocardium after administration of carnitine,” The American Journal of Cardiology, 1979, doi: 10.1016/S0002-9149(79)80019-3.
[7] Y. Sakai et al., “Effect of L-Carnitine in Patients With Liver Cirrhosis on Energy Metabolism Using Indirect Calorimetry: A Pilot Study,” Journal of Clinical Medicine Research, 2016, doi: 10.14740/jocmr2734w.
[8] M. Malaguarnera et al., “L-Carnitine Supplementation to Diet: A New Tool in Treatment of Nonalcoholic Steatohepatitis—A Randomized and Controlled Clinical Trial,” American Journal of Gastroenterology, vol. 105, no. 6, pp. 1338–1345, Jun. 2010, doi: 10.1038/ajg.2009.719.
[9] R. Klepochová et al., “Detection and Alterations of Acetylcarnitine in Human Skeletal Muscles by 1H MRS at 7 T,” Investigative Radiology, vol. 52, no. 7, pp. 412–418, Jul. 2017, doi: 10.1097/RLI.0000000000000355.
[10] R. Belinda , Ding Mark A , Peterzan Ferenc E, Mózes Hannah A, Lake Craig A, Lygate, Rana A, Sayeed Mario, Petrou George, Krasopoulos Oliver J, Rider Ladislav, Valkovič and Christopher T, “(ISMRM 2019) Cardiac creatine quantified by cycled water-suppressed 1H-MRS at 3T,” 2019, Accessed: Dec. 10, 2020. [Online]. Available: http://archive.ismrm.org/2019/1065.html.
[11] L. A. B. Purvis, W. T. Clarke, L. Biasiolli, L. Valkovič, M. D. Robson, and C. T. Rodgers, “OXSA: An open-source magnetic resonance spectroscopy analysis toolbox in MATLAB,” PLOS ONE, vol. 12, no. 9, p. e0185356, Sep. 2017, doi: 10.1371/journal.pone.0185356.
[12] B. Rial, M. D. Robson, S. Neubauer, and J. E. Schneider, “Rapid quantification of myocardial lipid content in humans using single breath-hold 1H MRS at 3 Tesla,” Magnetic Resonance in Medicine, vol. 66, no. 3, pp. 619–624, 2011, doi: 10.1002/mrm.23011.
[13] L. S. Szczepaniak et al., “Magnetic resonance spectroscopy to measure hepatic triglyceride content: Prevalence of hepatic steatosis in the general population,” American Journal of Physiology - Endocrinology and Metabolism, vol. 288, no. 2 51-2, pp. 462–468, Feb. 2005, doi: 10.1152/ajpendo.00064.2004.
[14] N. A. Johnson et al., “Noninvasive Assessment of Hepatic Lipid Composition: Advancing Understanding and Management of Fatty Liver Disorders,” 2008, doi: 10.1002/hep.22220.
[15] E. Ferrannini et al., “Interaction of carnitine with insulin-stimulated glucose metabolism in humans,” American Journal of Physiology - Endocrinology and Metabolism, vol. 255, no. 6, 1988, doi: 10.1152/ajpendo.1988.255.6.e946.
Figures