3833
Deflazacort & prednisone/prednisolone treatment in Duchenne muscular dystrophy: Disease trajectory differences modeled using MR biomarkers1Oregon Health & Science University, Portland, OR, United States, 2University of Florida, Gainesville, FL, United States
Synopsis
Duchenne muscular dystrophy (DMD) is a genetic disease characterized by rapidly progressing weakness and degeneration of the skeletal muscles. This study presents a modeling approach using MR biomarkers to characterize disease progression in individuals with DMD receiving deflazacort, prednisone/prednisolone, or no corticosteroid treatment. The findings from a sample of convenience compiled from the ImagingDMD study demonstrate that 1) corticosteroid treatment slows DMD disease progression, with deflazacort slowing progression to a greater extent than prednisone/prednisolone, and 2) the slow-progressing muscles in DMD are more sensitive to treatment effects, and hence, could be better candidates to assess therapeutic response in clinical trials.
Introduction
Duchenne muscular dystrophy (DMD) is a common form of muscular dystrophy caused by the absence of protein dystrophin, a key structural element in the muscle fibers1. Individuals with DMD experience a severe disease progression starting at a very young age with delayed motor development and proximal to the distal weakness of skeletal muscles2. Currently, there is no cure for DMD; consensus statement guidelines recommend the use of corticosteroids for symptomatic treatment in DMD3. These guidelines are based on considerable evidence of improved muscle strength, delayed loss of functional milestones, and increased life span3-8. The two most commonly prescribed corticosteroids in DMD are deflazacort and prednisone/prednisolone. The existing quality of evidence comparing the two drugs is low, and no previous study has compared the efficacy of one drug over the other using magnetic resonance imaging (MRI) and spectroscopy (MRS) biomarkers of muscle health and inflammation.Objectives
To investigate corticosteroid use for slowing DMD disease progression using MR biomarkers of leg muscles.Methods
MRI and MRS biomarkers were acquired in individuals with DMD who were followed yearly for up to 6 years in the ImagingDMD study. Fat fractions (FFs) in vastus lateralis (VL) and soleus (Sol) muscles were determined with 1H MRS9. MRI quantitative T2 (qT2) values were measured for 3 muscles of the upper leg [VL, biceps femoris long head (BFLH) & Gracilis (Gra)], and 4 muscles of the lower leg [Sol, Medial gastrocnemius (MG), Tibialis Anterior (TA) and Tibialis Posterior (TP)]. Longitudinal changes in biomarkers were modeled using a nonlinear mixed-effects (NLME) approach9 with subject-specific parameters and μi, the age at which the MR biomarker change reaches the half-maximum, calculated at the individual level. Higher μ values represent a slower disease progression. One-way ANOVA was used to assess the overall differences in MR measures between steroid-naïve and two steroid-positive groups (deflazacort and prednisone/prednisolone). Post-hoc analysis using Tukey’s Honestly Significant Difference (HSD) test was implemented to determine which groups were different from each other. The level of significance was set to p≤0.05.Results
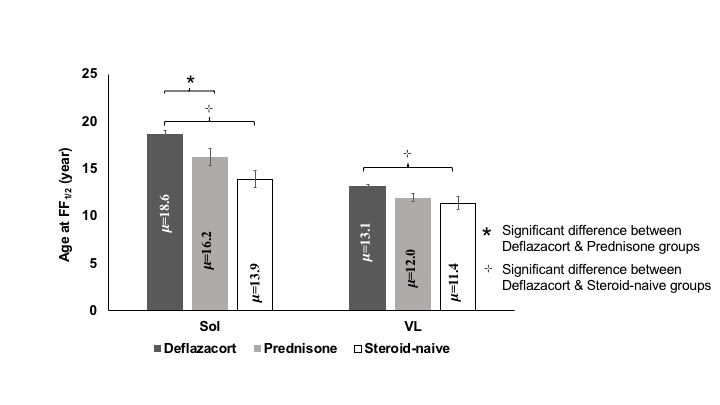
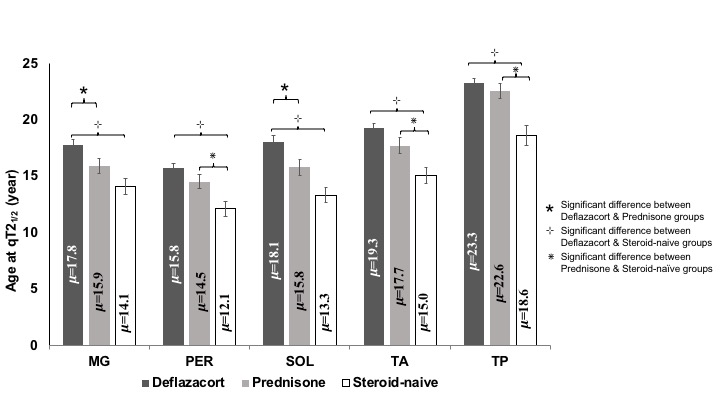
The mean age of 22 individuals in the steroid-naive group was 7.7±0.6 years (y), 41 individuals in the prednisone/prednisolone group was 9.3±0.5 y, and 104 individuals in the deflazacort group was 9.1±0.3 y. For MRS FF, group differences were observed for Sol and VL muscles [FSol (2,162) = 8.2; FVL(2,160) = 5.3]. Post hoc analysis revealed that the fat accumulation rates were lower (i.e. μ values higher) in the Sol muscle for the deflazacort group (μ=18.6±0.5 y) than both prednisone/prednisolone (μ=16.2±0.9 y) and steroid-naïve (μ=14.0±0.9 y) groups. Similarly, there was a statistically significant difference between groups for qT2 modeling results for all lower limb muscles [FTP (2,163) = 11.7; FTA (2,160) = 11.2; FSol (2,161) = 10.7; FMG (2,162) = 8.4 & FPer (2,158) = 9.6]. Post-hoc analysis revealed that the progression of qT2 values was significantly slower (i.e. μ was greater) in Sol and MG muscles in individuals in the deflazacort group compared to both prednisone/prednisolone and steroid-naïve groups (Figure 2). For Per, TA, and TP, the progression rate of qT2 was slower in the deflazacort-treated group in comparison to the steroid-naïve group but no differences existed among deflazacort and prednisone/prednisolone groups (Figure 2). Among UL muscles, qT2 was significantly different between groups for VL and Gra muscles [FVL (2,155) = 3.6; FGra (2,159) = 11.1]. Post-hoc analysis revealed that there were no significant differences in the progression of qT2 between deflazacort and prednisone/prednisolone groups for any UL muscle, but disease progression was slower in individuals on deflazacort in both VL (μ=12.1±0.3 y) and Gra (μ=17.5±0.4 y) muscles compared to those in the steroid-naïve group (VL μ=10.5±0.6 y; Gra μ=13.5±0.7 y).Discussion
This study demonstrates the value of MR biomarkers to summarize disease progression in response to therapeutic interventions in individuals with DMD. Specifically, the principal new findings from this study favor deflazacort drug over prednisone /prednisolone in terms of delayed fat accumulation as measured by MRS biomarkers by an average of 2.4 y for the Sol muscle. Modeling for qT2 biomarkers also pointed in the same direction, with the positive effect on qT2 observed only in the slow-progressing muscles of the lower leg. The higher sensitivity of the lower leg muscles to differentiate a treatment response re-emphasizes the fact that the muscles at an early stage of involvement are more responsive to therapy and hence, maybe the better targets for clinical trials exploring the efficacy of disease-modifying agents. The main limitation of the study is that we did not control the participants' corticosteroid treatment regimen or rigorously monitor compliance to the steroid regimen during the study duration, so results should be confirmed with a follow-up study.Conclusions
The NLME modeling of MR measures provides an efficient summary of disease progression in distinct muscles, with slower progressing muscles showing greater sensitivity for detection of treatment effects. In the sample of convenience reported here, deflazacort slows disease progression to a greater extent than prednisone/prednisolone.Acknowledgements
The ImagingDMD study is supported by grant funding from the National Institute of Arthritis and Musculoskeletal and Skin Diseases and the National Institute of Neurological Disorders and Stroke of the NIH. The authors thank the participants and their families for their dedication and involvement in the study, and they are appreciative of the MR technologists and research staff who assisted in data collection and analysis.References
- Hoffman, E. P., Brown, R. H., Jr. & Kunkel, L. M. Dystrophin: the protein product of the Duchenne muscular dystrophy locus. Cell 51, 919-928, doi:10.1016/0092-8674(87)90579-4 (1987).
- Blake, D. J., Weir, A., Newey, S. E. & Davies, K. E. Function and genetics of dystrophin and dystrophin-related proteins in muscle. Physiological reviews 82, 291-329, doi:10.1152/physrev.00028.2001 (2002).
- Bushby, K. et al. Diagnosis and management of Duchenne muscular dystrophy, part 1: diagnosis, and pharmacological and psychosocial management. The Lancet. Neurology 9, 77-93, doi:10.1016/s1474-4422(09)70271-6 (2010).
- McDonald, C. M. et al. Long-term effects of glucocorticoids on function, quality of life, and survival in patients with Duchenne muscular dystrophy: a prospective cohort study. Lancet (London, England) 391, 451-461, doi:10.1016/s0140-6736(17)32160-8 (2018).
- Connolly, A. M., Schierbecker, J., Renna, R. & Florence, J. High dose weekly oral prednisone improves strength in boys with Duchenne muscular dystrophy. Neuromuscular disorders : NMD 12, 917-925 (2002).
- Houde, S. et al. Deflazacort use in Duchenne muscular dystrophy: an 8-year follow-up. Pediatric neurology 38, 200-206, doi:10.1016/j.pediatrneurol.2007.11.001 (2008).
- Griggs, R. C. et al. Efficacy and safety of deflazacort vs prednisone and placebo for Duchenne muscular dystrophy. Neurology 87, 2123-2131, doi:10.1212/wnl.0000000000003217 (2016).
- Fenichel, G. M. et al. Long-term benefit from prednisone therapy in Duchenne muscular dystrophy. Neurology 41, 1874-1877, doi:10.1212/wnl.41.12.1874 (1991).
- Rooney, W. D. et al. Modeling disease trajectory in Duchenne muscular dystrophy. Neurology 94, e1622-e1633, doi:10.1212/wnl.0000000000009244 (2020).
Figures