3830
Abdominal MR imaging on a prototype low-field 0.55T scanner in comparison to a conventional 1.5T scanner1Radiology, Center for Advanced Imaging Innovation and Research, NYU Grossman School of Medicine, New York, NY, United States, 2Siemens Medical Solutions USA Inc, Malvern, PA, United States, 3Siemens Healthcare GmbH, Erlangen, Germany
Synopsis
MRI is a powerful imaging modality for abdominal examination. However, high costs and accessibility limit its utilization. Recent advances in acquisition and reconstruction techniques coupled with considerations of value have reignited interest in low-field (≤ 1T) MRI systems. In this study, we developed an abdominal imaging protocol on a prototype 0.55T scanner operating with higher or regular (45 mT/m; 200 T/m/sec) and lower (25 mT/m; 40 T/m/sec) gradients in order to investigate the level of tolerable cost reduction. Our study shows that diagnostic non-contrast abdominal imaging with T2W, DW, and T1W contrast can be performed within 10 minutes or less.
Introduction
Conventional clinical MRI scanners operate with field strengths ranging from 1.5T to 3T. MRI of the abdomen at these field strengths is usually performed as a problem-solving tool rather than first-line investigational modality due to high cost and limited accessibility. Current attention to the MR value proposition, coupled with recent advances in image acquisition and reconstruction techniques have reignited interest in imaging at a lower-field strength (≤1T)1,2. Such lower-field scanners not only decrease cost of the magnet but also decrease siting costs. Therefore, the purpose of our investigation was to develop a protocol for abdominal imaging on a prototype 0.55T scanner operating with two different gradient strengths in order to investigate level of achievable cost reduction, and to benchmark the image quality against a conventional 1.5T exam.Methods
Subjects: In this prospective IRB approved HIPAA compliant study, 10 healthy volunteers (4F, 6 M; mean age 33.1 years, range 26-42 years) were recruited to undergo three separate MRI examinations for research purposes.MR scanners: A commercial MRI system (1.5T MAGNETOM Aera; Siemens Healthcare) was modified to operate at 0.55T field strength. The scanner provides two different gradient-performance levels (higher or regular: maximum gradient amplitude 45 mT/m, maximum slew rate 200 T/m/sec; lower or adjusted: maximum gradient amplitude 25 mT/m, maximum slew rate 40 T/m/sec). A 6-channel body array and 18-channel spine array were tuned to 0.55T field strength and used for imaging. Each subject underwent three MR examinations of the abdomen with imaging performed on (1) the prototype 0.55T scanner utilizing higher gradients (LF-Regular), (2) the prototype 0.55T with lower gradients (LF-Adjusted), and (3) a conventional 1.5T scanner with regular gradients (MAGNETOM Sola; Siemens Healthcare).
Sequence details: Fat-saturated T2-weighted imaging (T2WI) was performed using a fat-suppressed free-breathing turbo spin-echo sequence with BLADE trajectory. A BLADE coverage factor of 121% was used to improve SNR and reduce artifacts. The lower specific absorption rate (SAR) at 0.55T permitted the use of 180° refocusing pulses.
Axial DWI was performed using a 3-scan trace echo-planar imaging (EPI) sequence. Data were acquired at three b-values (50, 500, 800 s/mm2), and an ADC map was reconstructed. Since the minimum TE in an EPI sequence is controlled by the number of readouts per shot, parallel imaging (acceleration factor = 2) and partial Fourier sampling were used to maintain clinically acceptable echo times. To overcome lower SNR at 0.55T, more averages were acquired for each b-value.
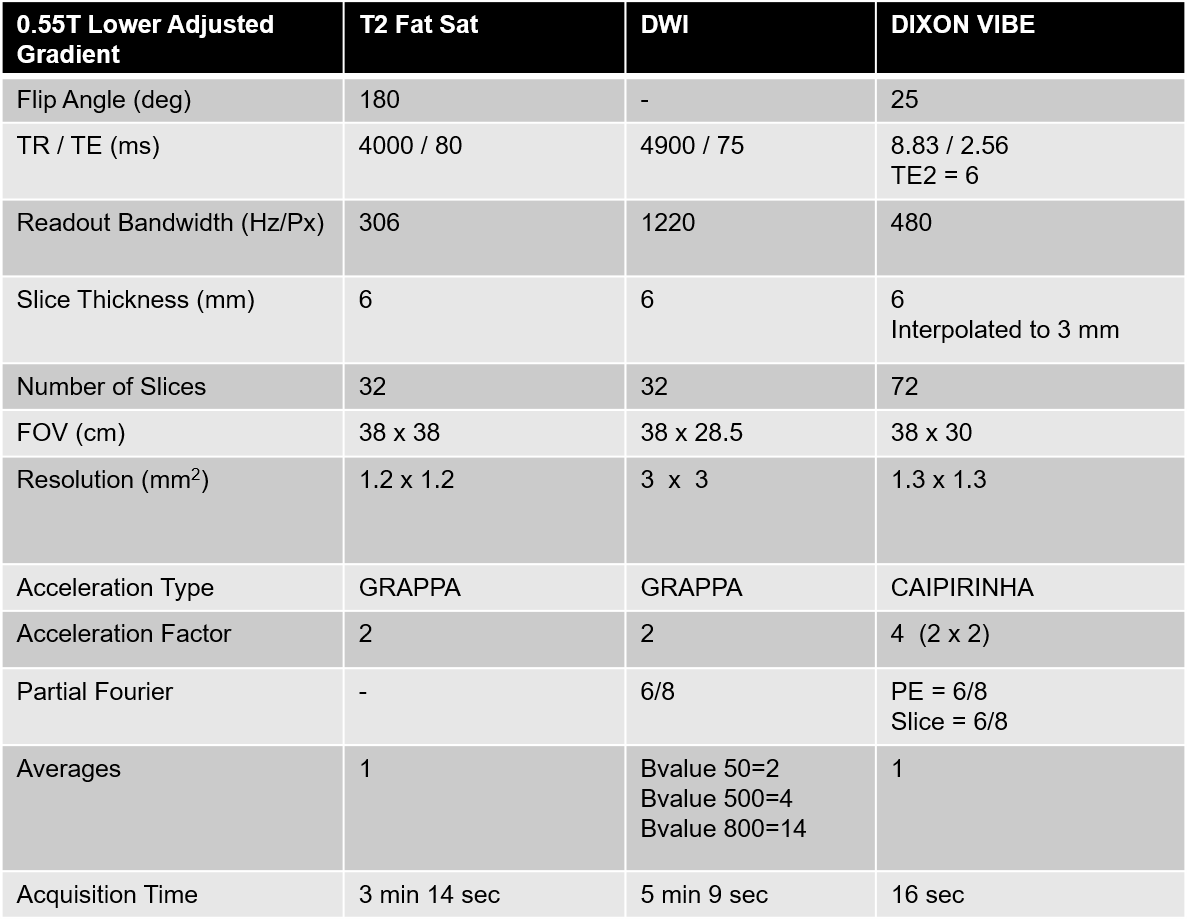
Axial Dixon T1-weighted (T1WI) images were acquired in a breath-hold by optimizing conventional 3D T1-weighted DIXON GRE acquisition that uses multi-echo readouts at two TEs. To reduce the overall measurement time, data were acquired at two arbitrary TEs of 2.5 ms & 6 ms. Flexible echotime DIXON algorithm was used to reconstruct the fat and water T1W images. The longer TR of 9 ms required the use of parallel imaging with 4-fold acceleration to keep the scan time within a 16 sec breath-hold. Figure 1 provides a summary of sequence parameters and acquisition time for LF-Adjusted.
Image analysis: Two board-certified fellowship-trained radiologists and one abdominal-imaging fellow independently evaluated the image quality in a blinded fashion. The readers evaluated parameters of image quality on a 5-point Likert scale, with a score of 1 being non-diagnostic and a score of 5 being excellent image quality. An exact paired-sample Wilcoxon signed rank test was used to compare the image quality.
Results
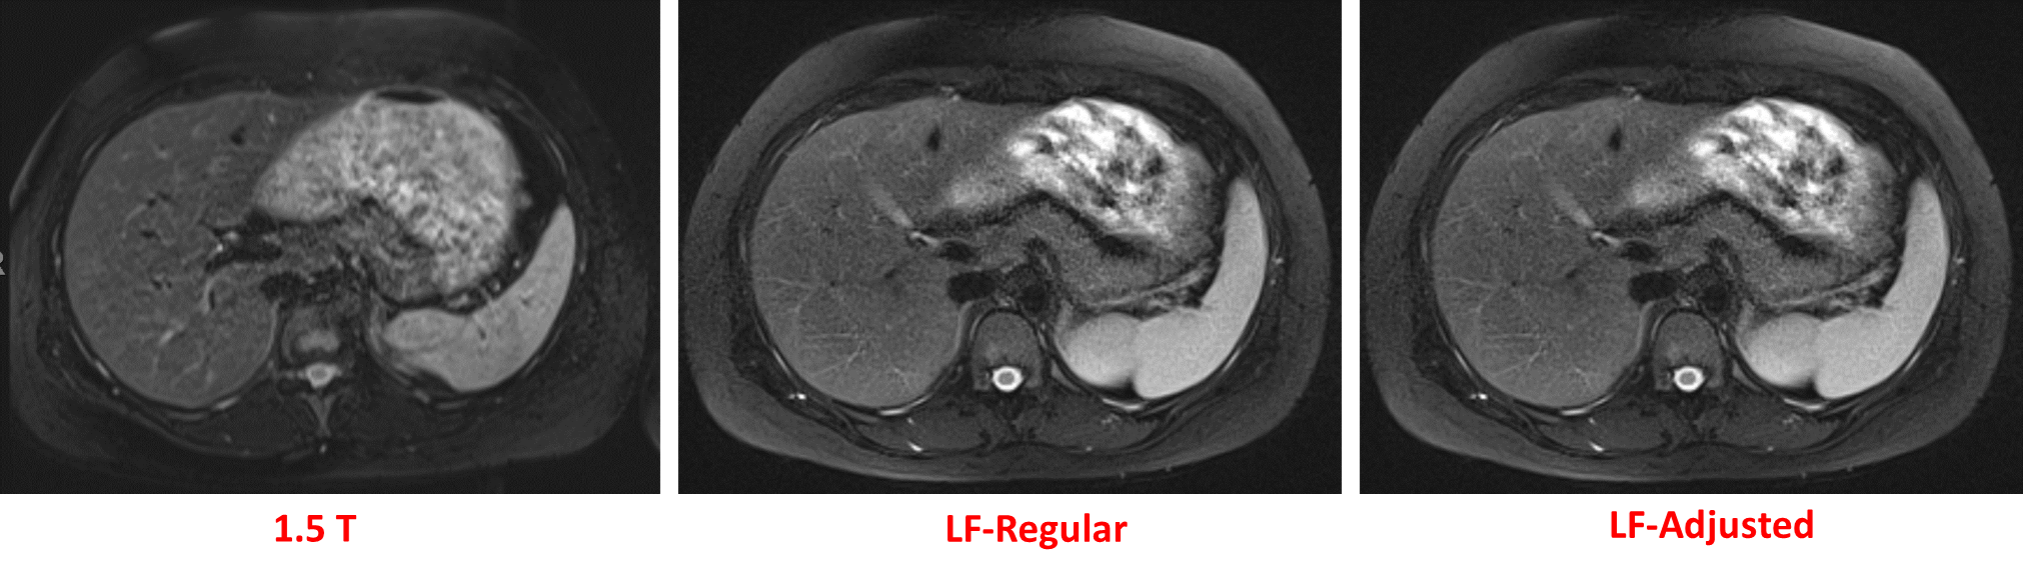
See Figure 2 for overall image quality scores by the three readers.T2WI: The mean difference in overall image-quality score was not significantly different between LF-Regular and LF-Adjusted (95%CI= -0.44 to 0.44; p= 0.98) or between 1.5T and LF-Regular (95%CI= -0.06 to 1.06; p= 0.09). However, the mean difference in image quality score between 1.5T and LF-Adjusted was significant (95%CI= 0.16 to 0.84; p=0.016).
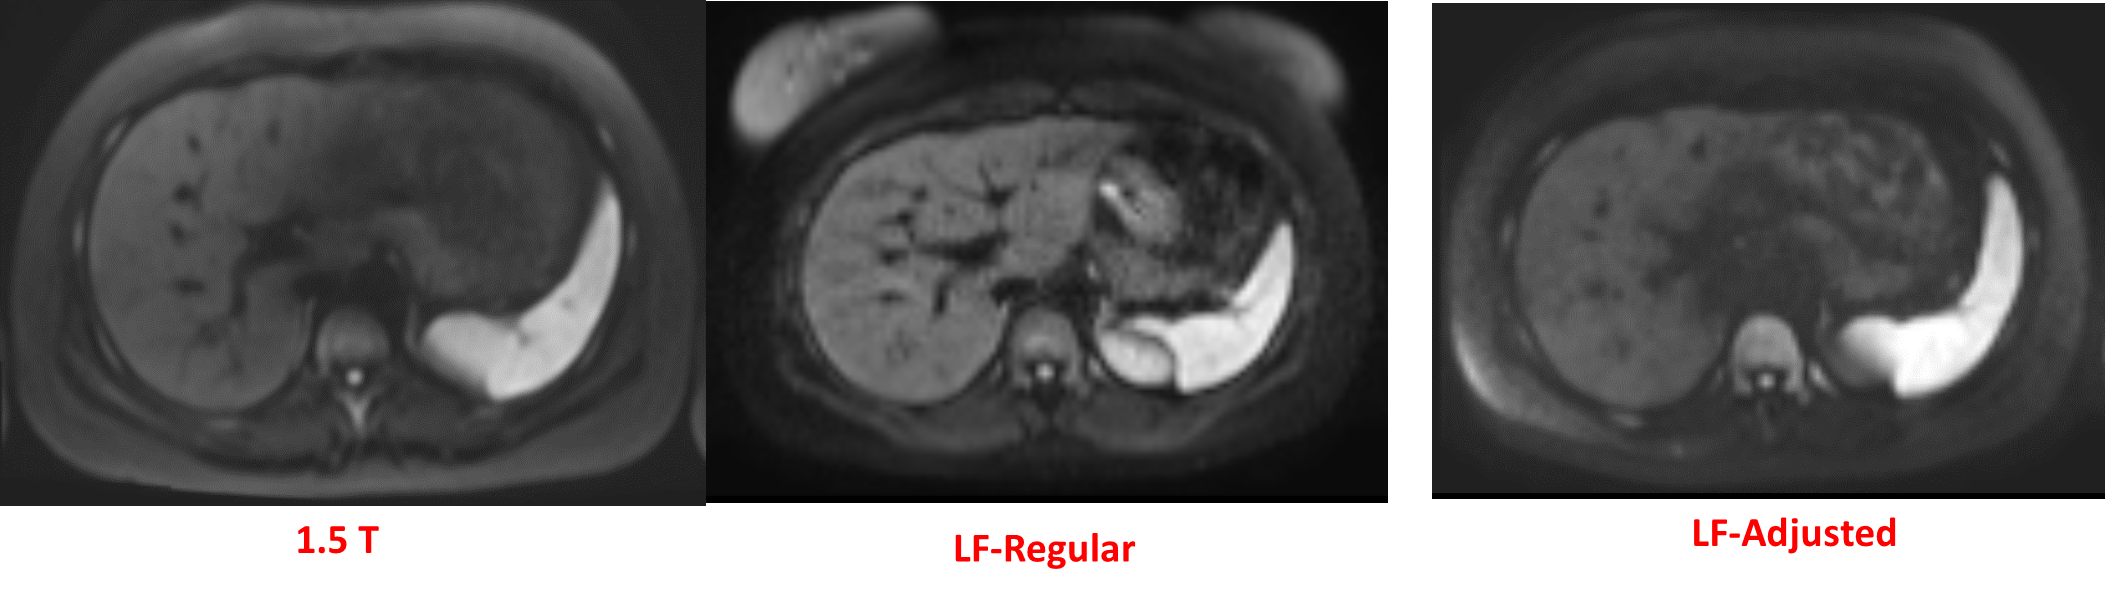
DWI: The mean difference in overall image quality score was not significantly different between LF-Regular and LF-Adjusted (95%CI= -0.43 to 0.36; p= 0.92) or between 1.5T and LF-Regular (95%CI= -0.06 to 1.0; p= 0.125). However, the mean difference in image quality score between 1.5T and LF-Adjusted was significant (95%CI= 0.08 to 0.79; p=0.01).
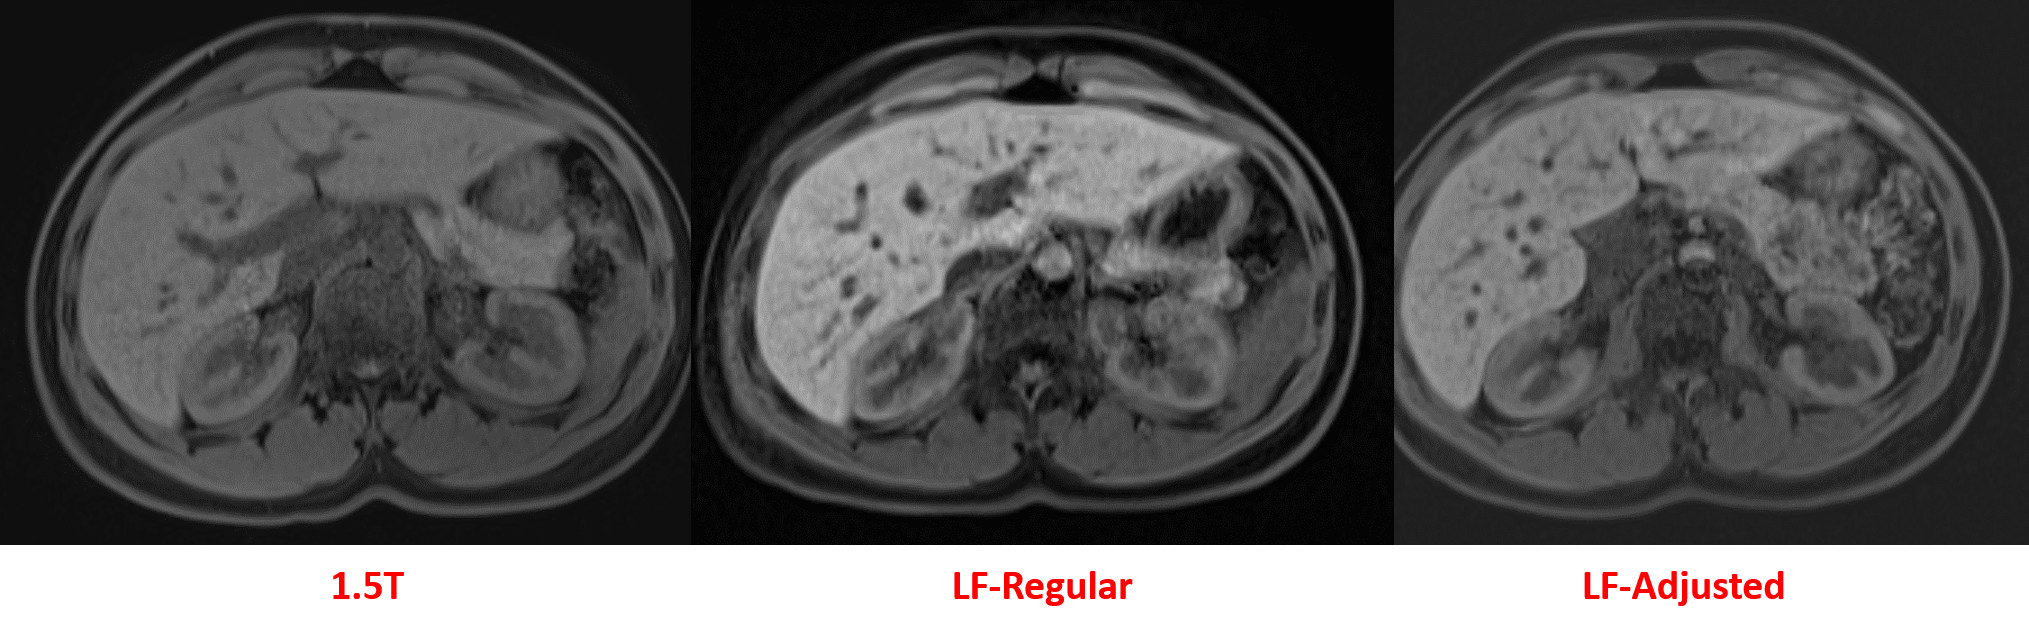
T1WI: The mean difference in overall image quality score was not significantly different between LF-Regular and LF-Adjusted for T1 in- and out-of-phase imaging (95%CI= -0.36 to 0.27; p= 0.91) or T1 fat-sat (or water only) images (95%CI= -0.24 to 0.18; p= 1.0). The mean overall image quality score was significantly higher for 1.5T. However, it is important to note that in all of the cases, the overall image quality scores for LF-Regular and LF-Adjusted were no more than one unit lower than the corresponding rating on the 1.5T exam.
Figures 3, 4, and 5 are illustrative images comparing image quality at 1.5T, LF-Regular, and LF-Adjusted.
Discussion & Conclusion
Diagnostic abdominal T2WI, DWI, and T1WI can be performed on a prototype 0.55T scanner with higher and lower gradient strengths, and within an acquisition time of 10 minutes or less for non-contrast abdominal exams. Next steps would include exploiting novel acquisition and reconstruction schemes to further improve image quality and decrease acquisition time. Such advances will permit broader implementation of low-cost MRI scanners to improve the accessibility of MRI.Acknowledgements
This work was in part supported by P41 EB0171813.
The authors would like to acknowledge the assistance of Siemens Healthcare in the modification of the MRI system for operation at 0.55T under an existing research agreement between our institution and Siemens Healthcare.
References
1. Campbell-Washburn A et al. Opportunities in Interventional and Diagnostic Imaging by Using High-Performance Low-Field-Strength MRI. Radiology. 2019 Nov;293(2):384-393.
2. Sarracanie M et al. Low-Field MRI: How Low Can We Go? A Fresh View on an Old Debate. Front. Phys., 12 June 2020.
3. Sheth KN et al. Assessment of Brain Injury Using Portable, Low-Field Magnetic Resonance Imaging at the Bedside of Critically Ill Patients. JAMA Neurol. 2020 Sep 8;e203263.
Figures