3825
Repeatability of DWI and DCE-MRI of Prostate in an Active Surveillance Population1Radiology and Biomedical Imaging, University of California San Francisco, San Francisco, CA, United States, 2Urology, University of California San Francisco, San Francisco, CA, United States
Synopsis
This study attempted to fill the dearth of literature establishing the repeatability of DWI and DCE-MRI using a population of non-progressing men on active surveillance for prostate cancer. MRIs from men (n=26) with two DCE-MRI scans in one year were examined and mean ROI values on different imaging maps were analyzed for percent repeatability coefficient (%RC). %RC was lowest for ADC, DCE MRI peak enhancement, T2-weighted images and pharmacokinetically modeled ve and Ktrans.
Introduction
Diffusion-weighted imaging (DWI) and Dynamic Contrast-Enhanced MRI (DCE-MRI) are valuable for identifying and characterizing cancer. Both these modalities are commonly used. However, there is a dearth of academic literature establishing their repeatability, particularly for DCE-MRI, in part due to limitations in administering repeat doses of contrast agents (CA). Establishing the repeatability of these imaging methods is necessary to determine their viability in tracking disease progression. This study aimed to establish the repeatability of DWI and DCE-MRI of the prostate in an active surveillance (AS) population.Methods
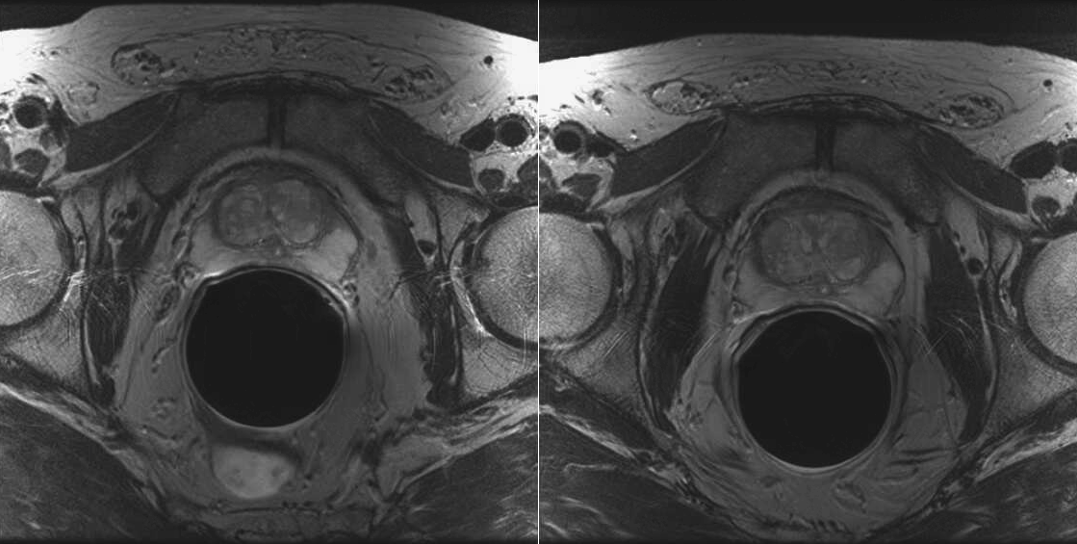
This retrospective study examined 26 men on AS for prostate cancer who have had at least two prostate multiparametric MRI (mpMRI) examinations with minimal signs of disease progression (mean length of time between scans was 303 days). MRI images were acquired on a 3T scanner (GE Healthcare) with a CA (Gd-DTPA or Gd-BT-DO3A) within 365 days (Figure 1).Disease progression, and thus, study exclusion, was defined as one or more of the following occurring from two years before the first scan through two years after the second scan: PSA doubling, biopsy Gleason score upgrade, number of cancerous cores by biopsy doubling; or if treatment of any kind occurred before or in between scans.
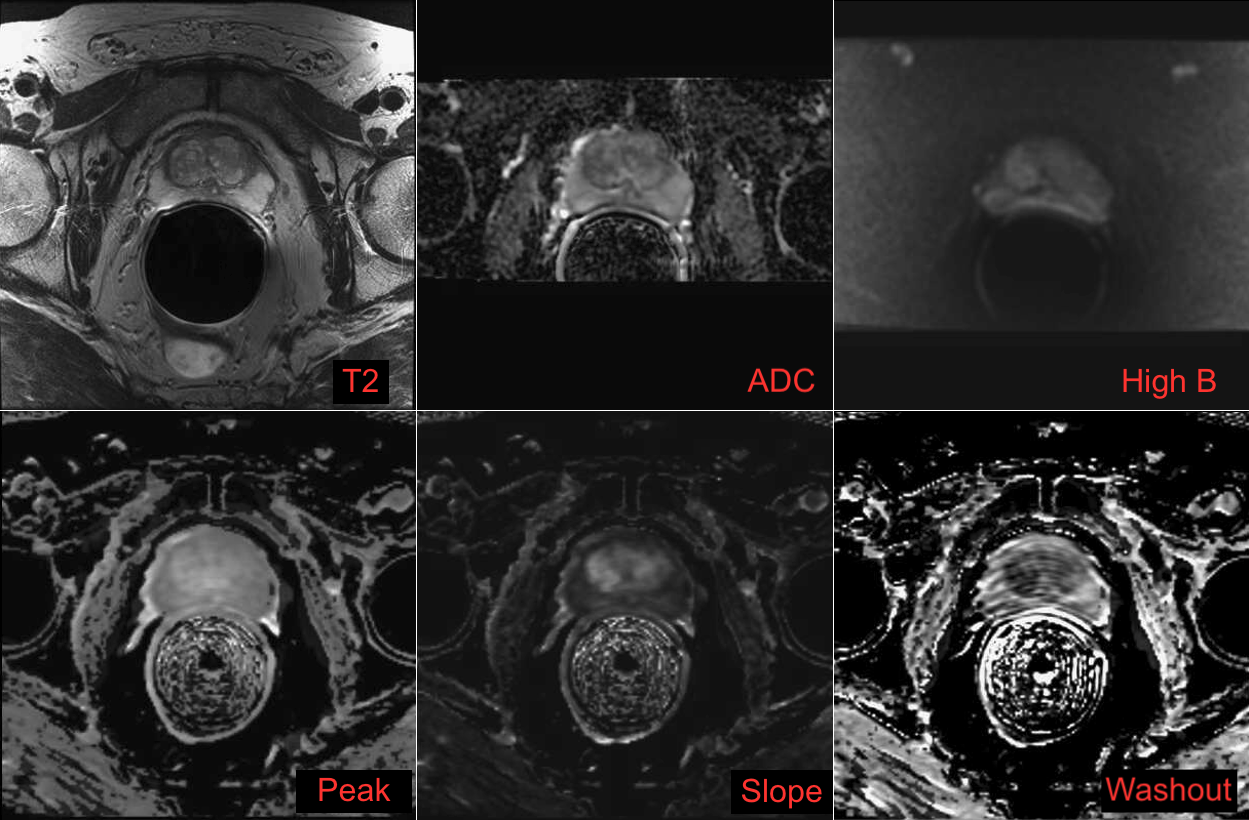
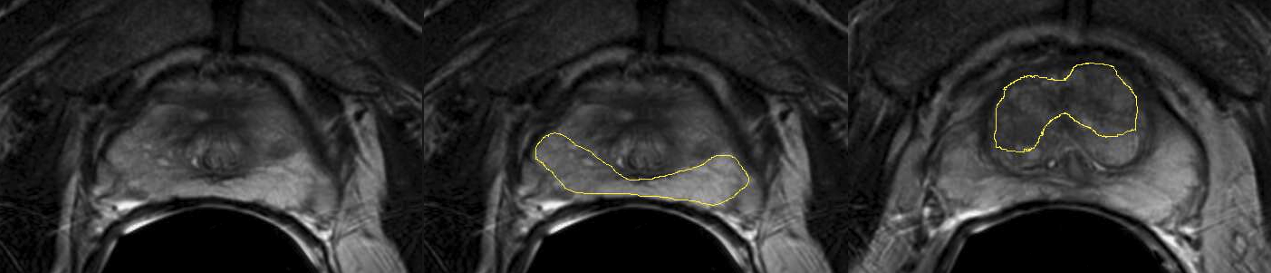
ROIs were drawn with consensus from two authors (JW and SN) using the original radiologist report as a guide. The DWI and DCE-MRI maps were aligned to the T2 images, and ROIs were drawn in all images of normal peripheral zone (nPZ), normal transition zone (nTZ), cancerous peripheral zone (cPZ) if applicable, and cancerous transition zone (cTZ) if applicable. ROI mean values were recorded on T2, ADC, and High b (b~1400 s/mm2) DWI, peak enhancement, slope, washout (Figure 2 and Figure 3).
The Luminal Water (LW) model1 and the Tofts-Kermode (TK) model of pharmacokinetic (PK) analysis were both performed using an arterial input function scaled by the case’s muscle peak enhancement. Outliers in the data were identified when their values were greater than 3 SD from the mean for that tissue and measurement. According to Quantitative Imaging Biomarkers Alliance (QIBA) recommendations for repeatability measurement2, a “percent repeatability coefficient” (%RC) was calculated. Lower %RC indicates better repeatability and statistically measurable variation. %RC is a percentage measurement made by multiplying the within-subject variation by 2.77.
Results
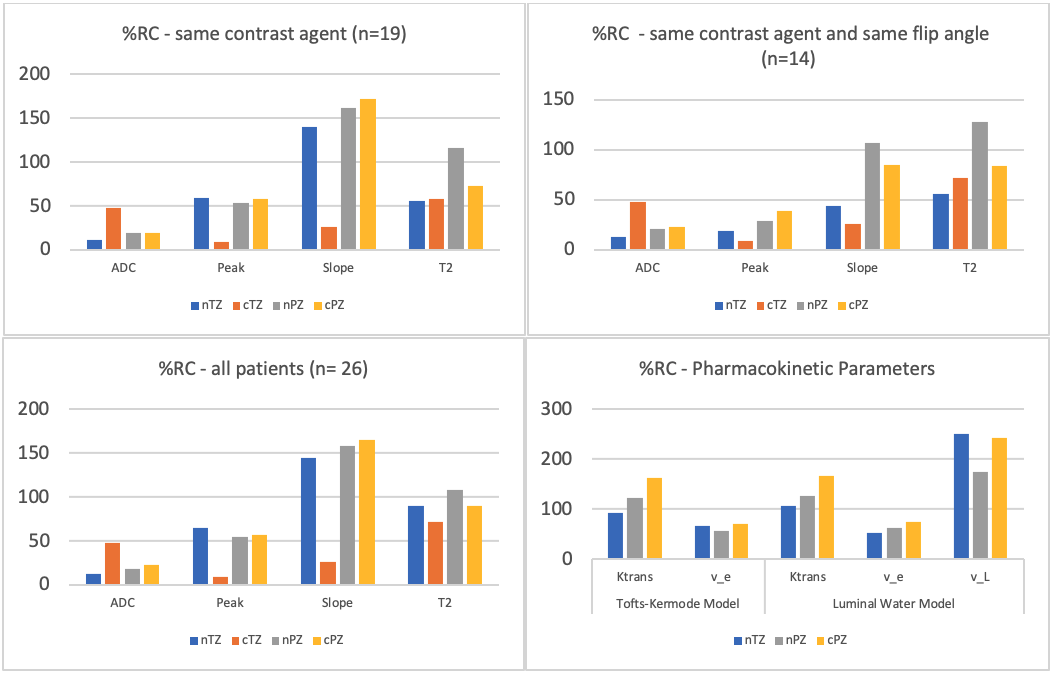
For DCE-MRI and DWI-map analysis, 19 patients received the same CA for both scans and 14 patients had the same CA and same DCE sequence flip angle (FA). The %RC for the ADC and peak images were generally < 50%, however, nPZ seemed to have more variation between scan 1 and scan 2. Additionally, %RC values were lower when controlling for CA and FA. PK analysis showed the %RC for ve and Ktrans values as generally < 100%. For PK analysis, cTZ was excluded from analysis due to a lack of data points. Washout values were reported as the raw difference between scans since the nature of these values is not suitable for %RC analysis. %RC for different tissue types and scans are given in Figure 4. The raw washout differences for nTZ, cTZ, nPZ, and cPZ were 11.3%, 7.88%, 11.3%, and –3.43% baseline/min, respectively.Discussion
Even with the potential for biological variation over the ~10 months between scans, this study demonstrated relatively low %RC for ADC, peak, and slope, indicating that DCE-MRI and DWI can potentially track progression of prostate cancer despite biological changes. Peak enhancement and its related PK measure, ve, provided the smallest %RC for the DCE-MRI measures. The relatively high %RC of nPZ and cPZ is potentially suspicious and may indicate that allegedly stable cancer became more cancerous and healthy tissue increased in biological variation. The challenges of this study were associated with variable image acquisition differences from scan 1 to scan 2 (e.g. unspecified scaling factors, differences in CA). As the %RC was generally lower in the subset of cases with the same contrast agent and DCE MRI scan parameters, repeatability of all the cases would likely improve markedly if there was more consistency in original data processing, scan parameter selection, and contrast agent administration. Limitations of this study are predominantly related to the necessary, and potentially flawed, adaptations and normalizations performed to accommodate changing CA and FA in between scans. Additionally, there is the possibility of biological change or cancer progression that is undetected in imaging or other clinical methods despite our efforts to rule out progression.Conclusion
This study represents an important milestone for determining the true clinical efficacy of DCE-MRI and DWI for tracking disease progression. The next logical step for future work is to analyze the %RC of individuals with confirmed progressing prostate cancer. This would allow us to determine if the repeatability of progressing individuals is sufficiently different from stable individuals to use DCE-MRI and DWI as a viable method for tracking progression of cancer.Acknowledgements
Funding from: California Tobacco-Related Disease Research Grant: 28IR-0060.References
1. Noworolski et al., Proc. Intl. Soc. Mag. Reson. Med. 19 (2011), A Novel Luminal Water Model for DCE MRI of Prostatic Tissues
2. Shukla-Dave, et al, (2019). Quantitative imaging biomarkers alliance (QIBA) recommendations for improved precision of DWI and DCE-MRI derived biomarkers in multicenter oncology trials. Journal of Magnetic Resonance Imaging, 49(7), e101–e121. https://doi.org/10.1002/jmri.26518
Figures