3823
Advanced image processing outside the academia: The integration of ExploreASL into the workflow of an outpatient imaging center1Dent Neurologic Institute, Buffalo, NY, United States, 2Neurosurgery, University at Buffalo, Buffalo, NY, United States, 3Philips Healthcare, Gainesville, FL, United States, 4Helmholtz-Zentrum Dresden-Rossendorf, Dresden, Germany, 5Dent Neurologic Institute, Amherst, NY, United States, 6Philips Research Europe, Aachen, Germany, 7Dept of Radiology and Nuclear Medicine, Amsterdam University Medical Center, Amsterdam, Netherlands, 8Institute of Neurology, University College London, London, United Kingdom, 9Ghent Institute for Functional and Metabolic Imaging, Ghent, Belgium
Synopsis
While neurological imaging is mostly done in non-academic centers, the lack of academic resources, special image processing skillset and the fast paced workflow prevent radiologists in these data-rich environments from engaging in high quality clinical research that utilizes quantitative imaging. Clinical adoption of Arterial Spin Labeling could benefit from providing easy-to-use, PACS connected image processing solutions that do not require neuroscience background and provide truly quantified Cerebral Blood Flow values in any outpatient center or public hospital. Our goal is to create such a solution and bridge the gap between academic research and real world practice.
Background/Unmet need
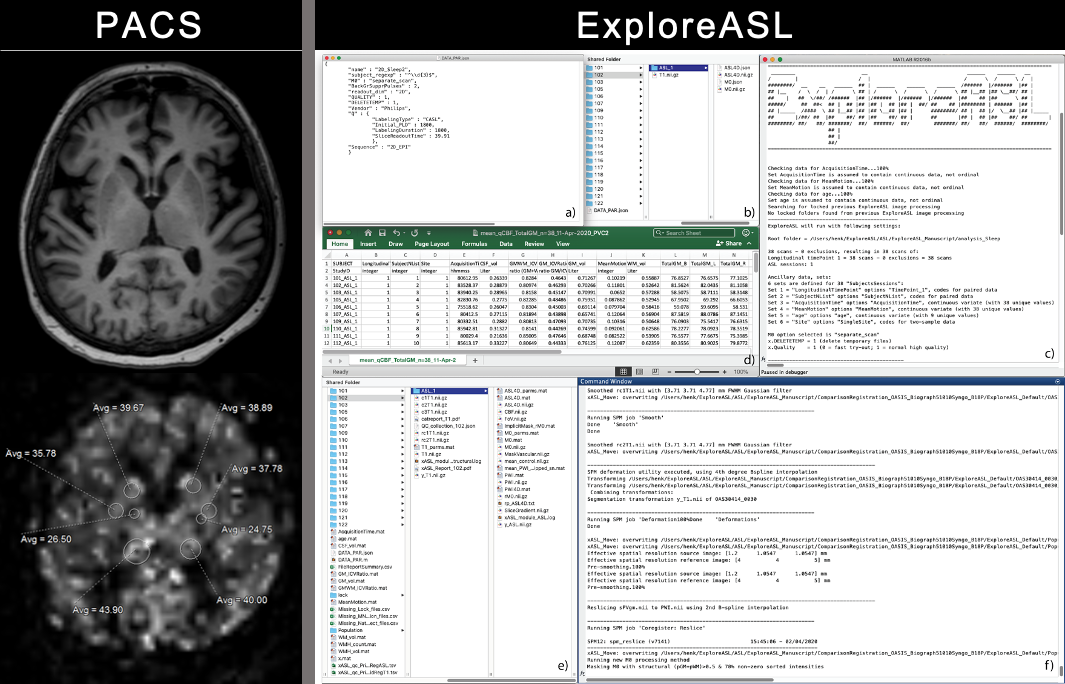
For adoption of novel quantitative MRI techniques outside of specialized academical centers, it is key to provide a standardized image processing workflow with the least manual intervention possible. Arterial spin labeling (ASL) MRI is such a technique that gained popularity in clinical research, but is restricted to academic centers as it requires dedicated research personnel and image processing expertise (Figure 1). However, the majority of neuroimaging studies is done in outpatient centers and for widespread clinical adoption of ASL it is key to create applications that provide these nonacademic environments with cerebral blood flow (CBF) analysis with minimized manual intervention, with integration into routine workflow. We incorporated the academic Matlab-based pipeline ExploreASL as a plugin into the imaging research platform IntelliSpace Discovery (ISD). We investigated the workflow of Region-of-Interest (ROI) analysis using clinical PACS, academic center and ISD. We also compared the mean CBF of several Volumes-Of-Interest (VOIs) by two methods: 1) data analyzed in specialized academic centers; 2) data analyzed with ExploreASL plugin on the ISD.Subjects and Methods
ExploreASL is a research pipeline for image processing and quantification of ASL images [1], written in Matlab (MathWorks, MA, USA) and based on SPM12. ISD is a clinical imaging research platform for image processing and visualization, allowing secure data transfer (HTTP-REST protocol) between ISD and external computational resources. It is a versatile modular system that hosts and runs image processing pipelines as individual plugins, within a customizable Python wrapper. The ExploreASL-ISD plugin converts MRI data to BIDS format, runs compiled ExploreASL code and transfers the output images back into the PACS database [2]. For the current study 9 patients (age 74 ±5.9years, 55% female) diagnosed with Mild Cognitive Impairment (MCI) were included and scanned on a Philips 3T Ingenia (Philips Healthcare, Netherlands). T1w-MPRAGE, T2w-FLAIR and pCASL (PLD=1800ms) images were sent to ISD from either PACS or directly from the scanner. On the ISD web interface, the plugin was triggered for each subject, which takes the pCASL, T2w-FLAIR and T1w images to process and generate quantified CBF map and quality report. The ISD interface also allows creation of VOIs based on brain tissue classification and segmentation (gray/white matter and brain-regions). Using these VOIs, brain regions CBF mean values were calculated. We selected four regions: Left Globus Pallidus (LGP), Left Putamen (LPUT), Left Thalamus (LTH) and Right Putamen (RPUT) for CBF comparison. Images were also processed separately with ExploreASL on a laptop and mean CBF values were extracted applying the VOIs generated in ISD.Results
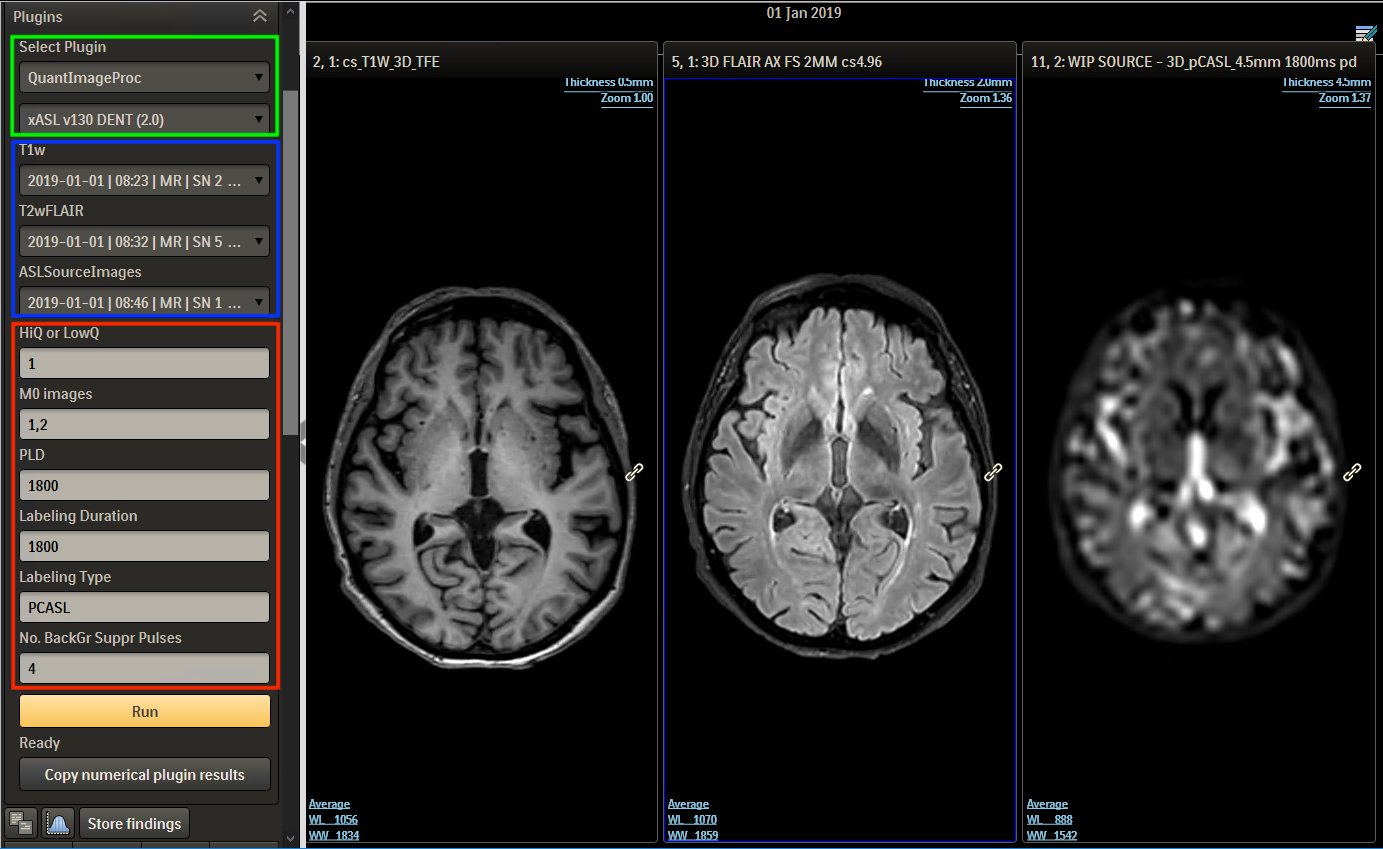
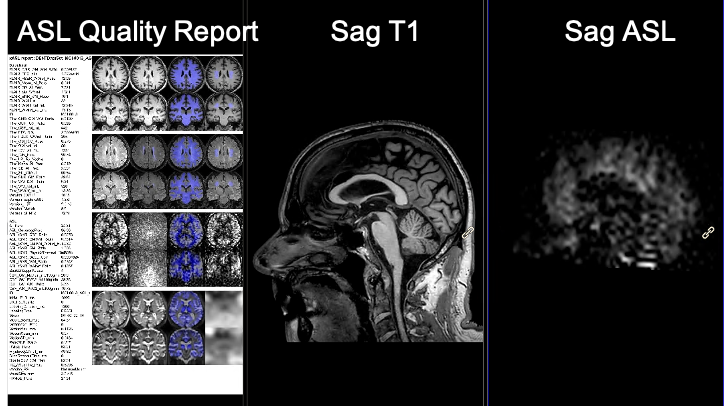
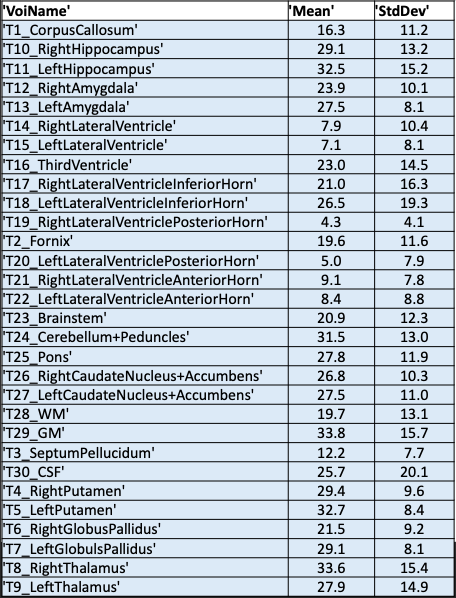
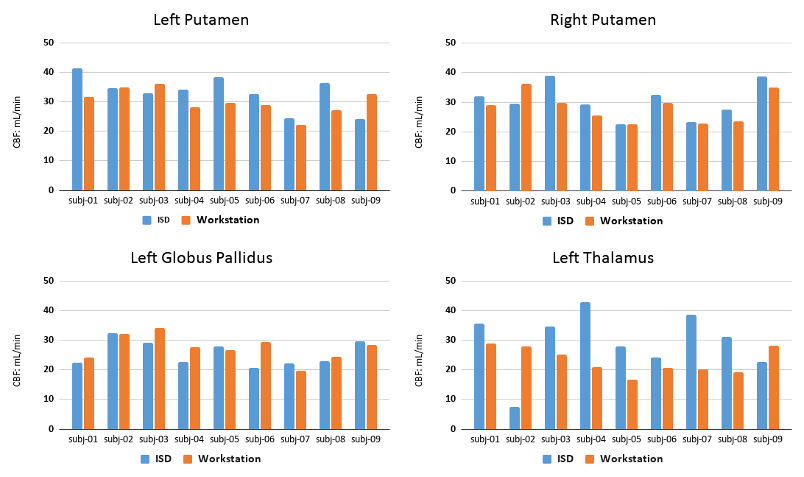
In the ISD the initiation of the task and review of results is done in a web interface by the radiologist (Figure 2), this involves a simple web login. The plugin prompts the user to select input images (pCASL, T1w, T2w) and parameters. The ASL acquisition parameters are set manually to match locally used versions of ASL protocol. After initiation the pipeline runs without user interaction and a quantified CBF map is populated back to the ISD patient database, ready for review, along with a report (Figure 3). The automated image processing includes co-registration of ASL images with 3D T1 images, allowing for utilization of brain atlas based or ROI based CBF value extraction. The ROI values were exported in a spreadsheet using a separate plugin for either individual patient or as a group to perform comparison analysis. An example output from a single patient is shown in Figure 4, which shows the value from 27 sub-region of the brain along with gray-, white-matter and ventricles. Figure 5 shows the comparison of the four selected VOIs across the 9 subjects. The average CBF values in the four selected VOIs for the 9 subjects for ISD and the standalone workstation, respectively: a) LGP: 25.6±4.2 and 27.41±1.52 b) LPUT: 33.3±2.45 and 30.12±2.13 c) LTH: 29.5±3.26 and 23.1±1.73 d) RPUT: 30.5±1.32 and 28.27±2.2. Though no significant difference was found, there were some larger differences in the left thalamus.Discussion
The dedicated plugin creates an easy-to-use workflow by automating image processing and ASL quantification, without requiring a neuroscience background or knowledge of MATLAB. The output provides excellent visualization and enables further analysis. The plugin in this pilot study generated comparable CBF results as the academic implementation of ExploreASL. This approach creates the opportunity for nonacademic centers to conduct ASL-focused advanced work, such as clinical research and clinical validation.Acknowledgements
NP is supported by the Dent Family Foundation.
HM is supported by the Dutch Heart Foundation (2020T049), and by the Eurostars-2 joint programme with co-funding from the European Union Horizon 2020 research and innovation programme, provided by the Netherlands Enterprise Agency (RvO).
References
1: Mutsaerts et al ExploreASL: An image processing pipeline for multi-center ASL perfusion MRI studies, NeuroImage, Volume 219, 117031, ISSN 1053-8119, https://doi.org/10.1016/j.neuroimage.2020.117031
2: Ganji et al, ISMRM 2020. Digital poster 1808
Figures