3818
Validating Open-Source MR Sequences for Reproducible Research1Biomedical Engineering, Columbia University, New York, NY, United States, 2Columbia Magnetic Resonance Research Center, Columbia University, New York, NY, United States
Synopsis
A framework for testing, validating, and sharing open-source MR sequences was developed to improve their accessibility, repeatability, and safety. Accessibility is improved by requiring documentation of sequence usage and data processing steps, repeatability by requiring test experiments and examples to replicate, and safety by requiring simulation or records of SAR and PNS levels. Forms and guidelines are provided to help developers and users package, share, and apply novel sequences efficiently. The framework was demonstrated for two common sequences, Inversion Recovery Spin Echo (IRSE) and Turbo Spin Echo (SE), and they were packaged and shared in an open-source repository.
Introduction
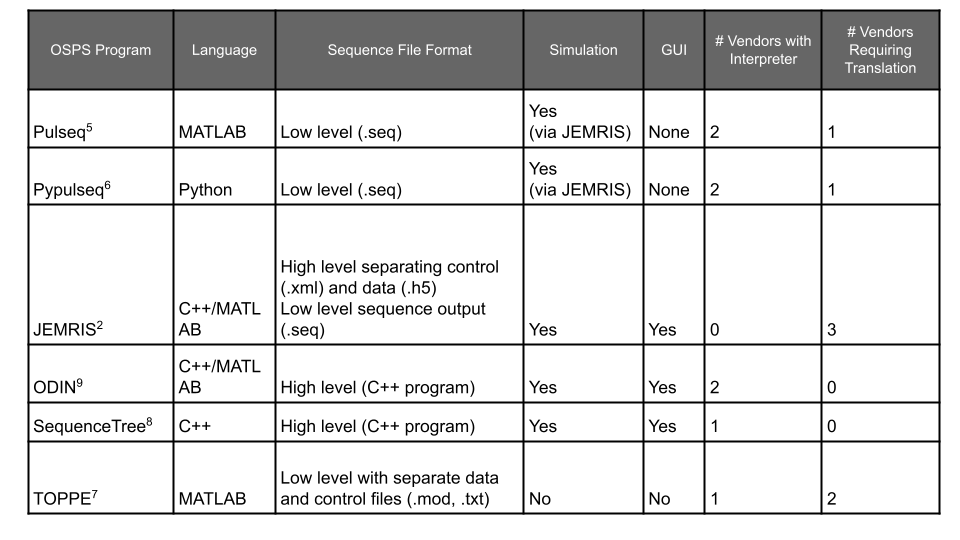
Multi-site MR studies can be convoluted due to sensitivity to sequence parameters1 and the need to align them across vendors. A related challenge lies in reproducing vendor-specific sequences, where translation between vendors adds to development time. Open-source sequence platforms help solve reproducibility problems by providing a transparent way to design, store, and execute sequences on multiple platforms2-9 (Table 1). To the best of our knowledge, however, there are agreed-upon standards for the image quality and usability of an open-source MR sequence. In this work, we propose a framework for testing, documenting, and sharing open-source pulse sequences with the goal of increasing accessibility, safety and efficiency in sequence development.Methods
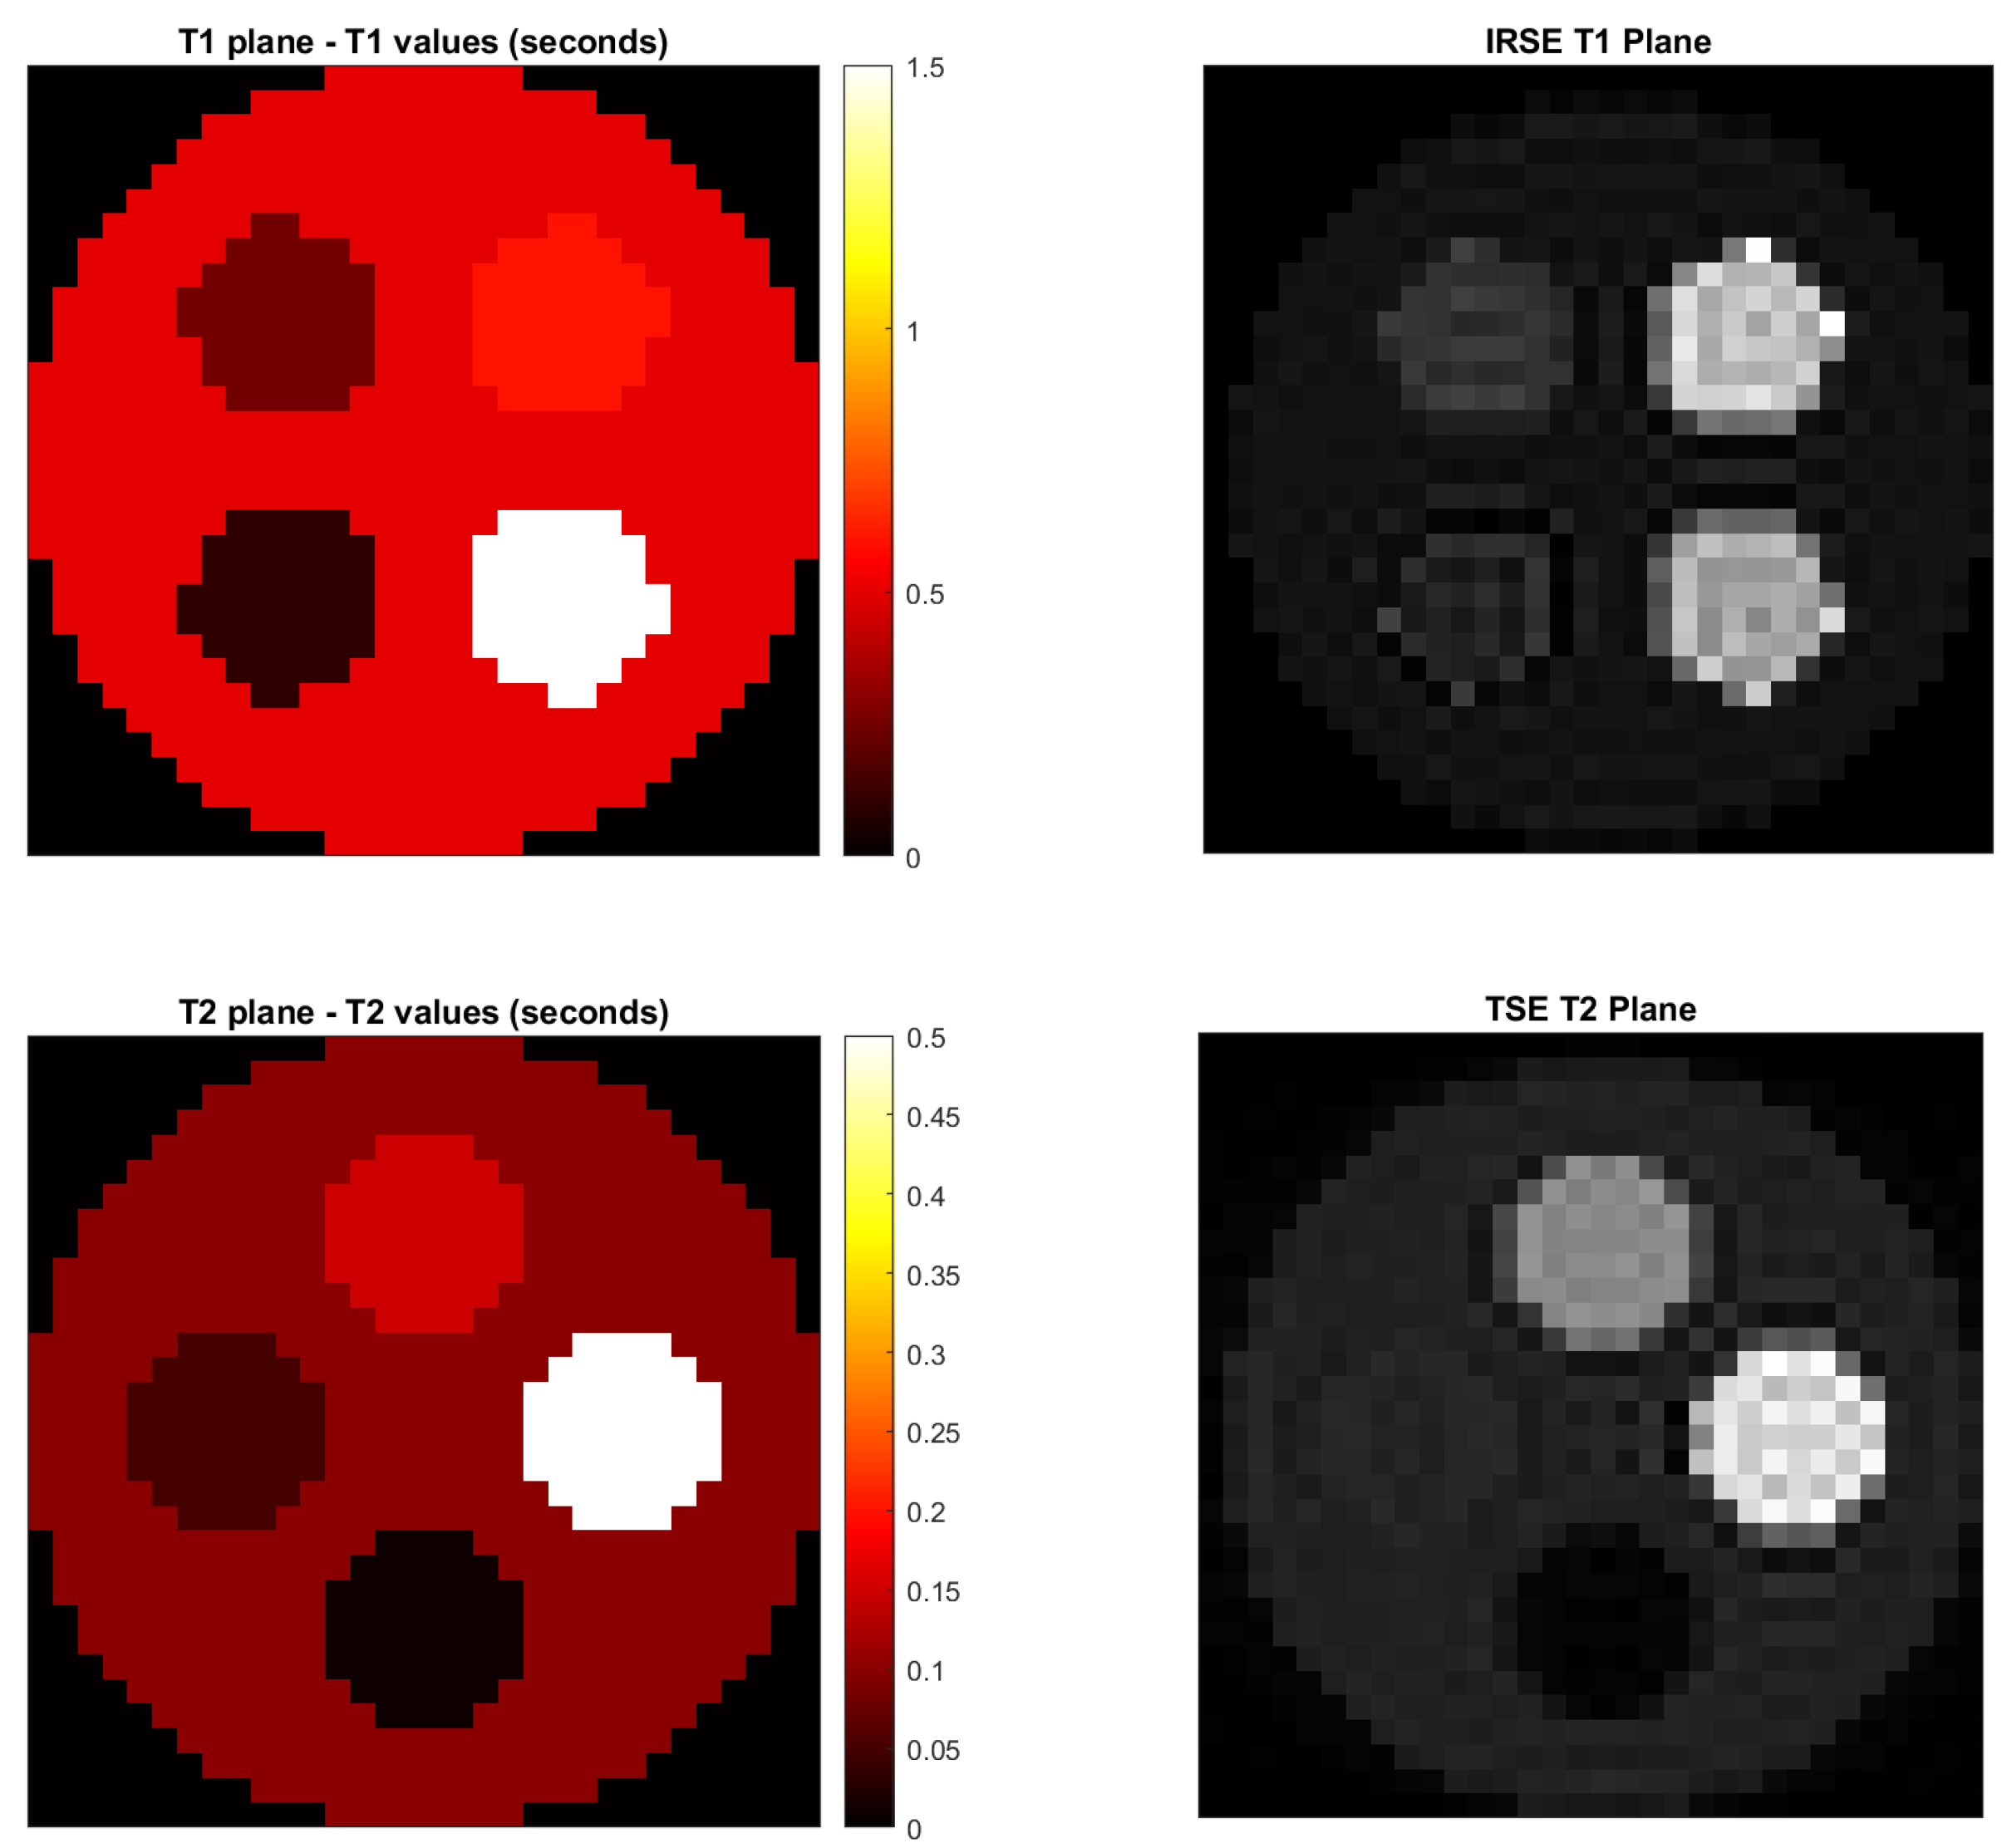
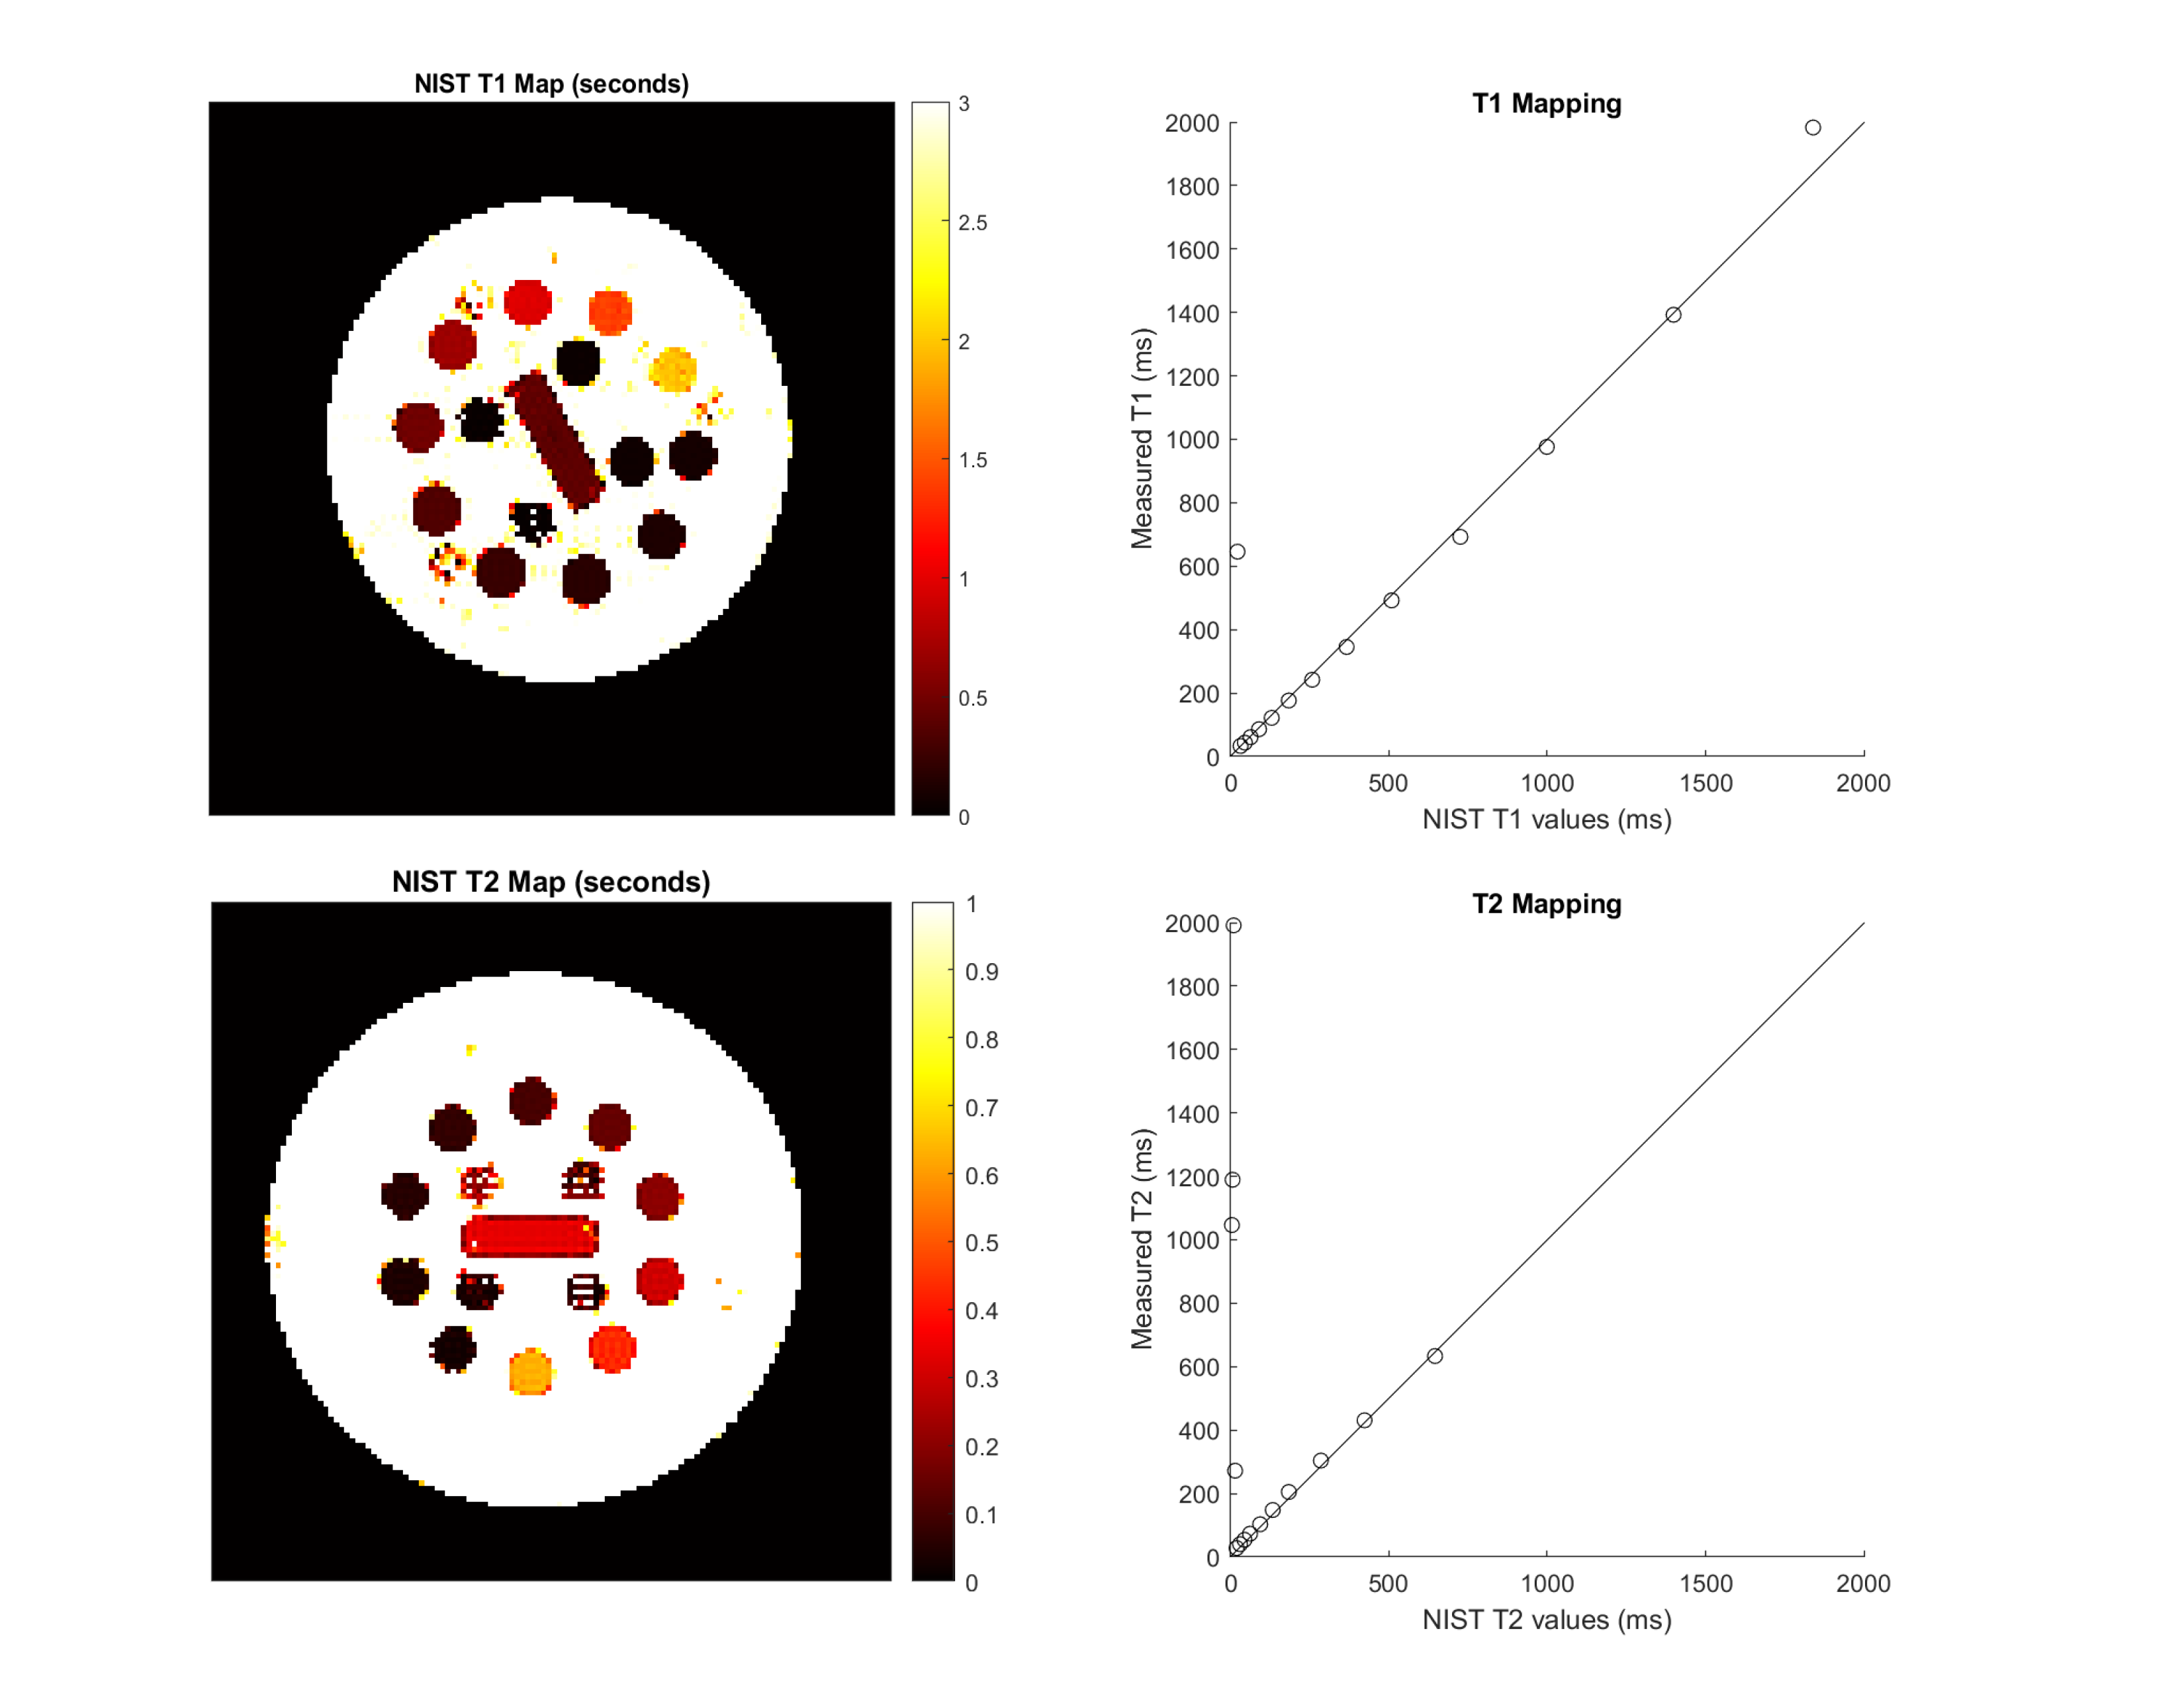
The framework consists of documentation and data requirements for sequence construction, simulation, acquisition, reconstruction, and analysis, which were listed in PDF forms. As demonstration, Inversion Recovery Spin Echo (IRSE) and Turbo Spin Echo (TSE) sequences were implemented in Pypulseq6.Simulation at matrix size N = 32 was performed using JEMRIS2 following translation of the sequence file using py2jemris10. Images were acquired on a Siemens 3T PrismaFit for qualitative (N = 256) and quantitative (N = 128) experiments. Standard ACR slices were acquired in the qualitative experiment. In the quantitative experiments, T1 mapping IRSE was repeated with ten inversion times (TI = 50, 75, 100, 125, 150, 250, 1000, 1500, 2000, 3000 ms); T2 mapping TSE was performed in a single experiment where multiple echoes at TE = (7n) ms where n = 1, 2, …, 23, were acquired in the same TR. T1 and T2 planes of the NIST phantom11 were mapped by least-squares curve fitting and sphere-wise relaxation times were compared to standard values. For T2 mapping, the first four TEs were discarded to achieve the best overall accuracy, as the initial signal did not follow a unimodal decay curve.
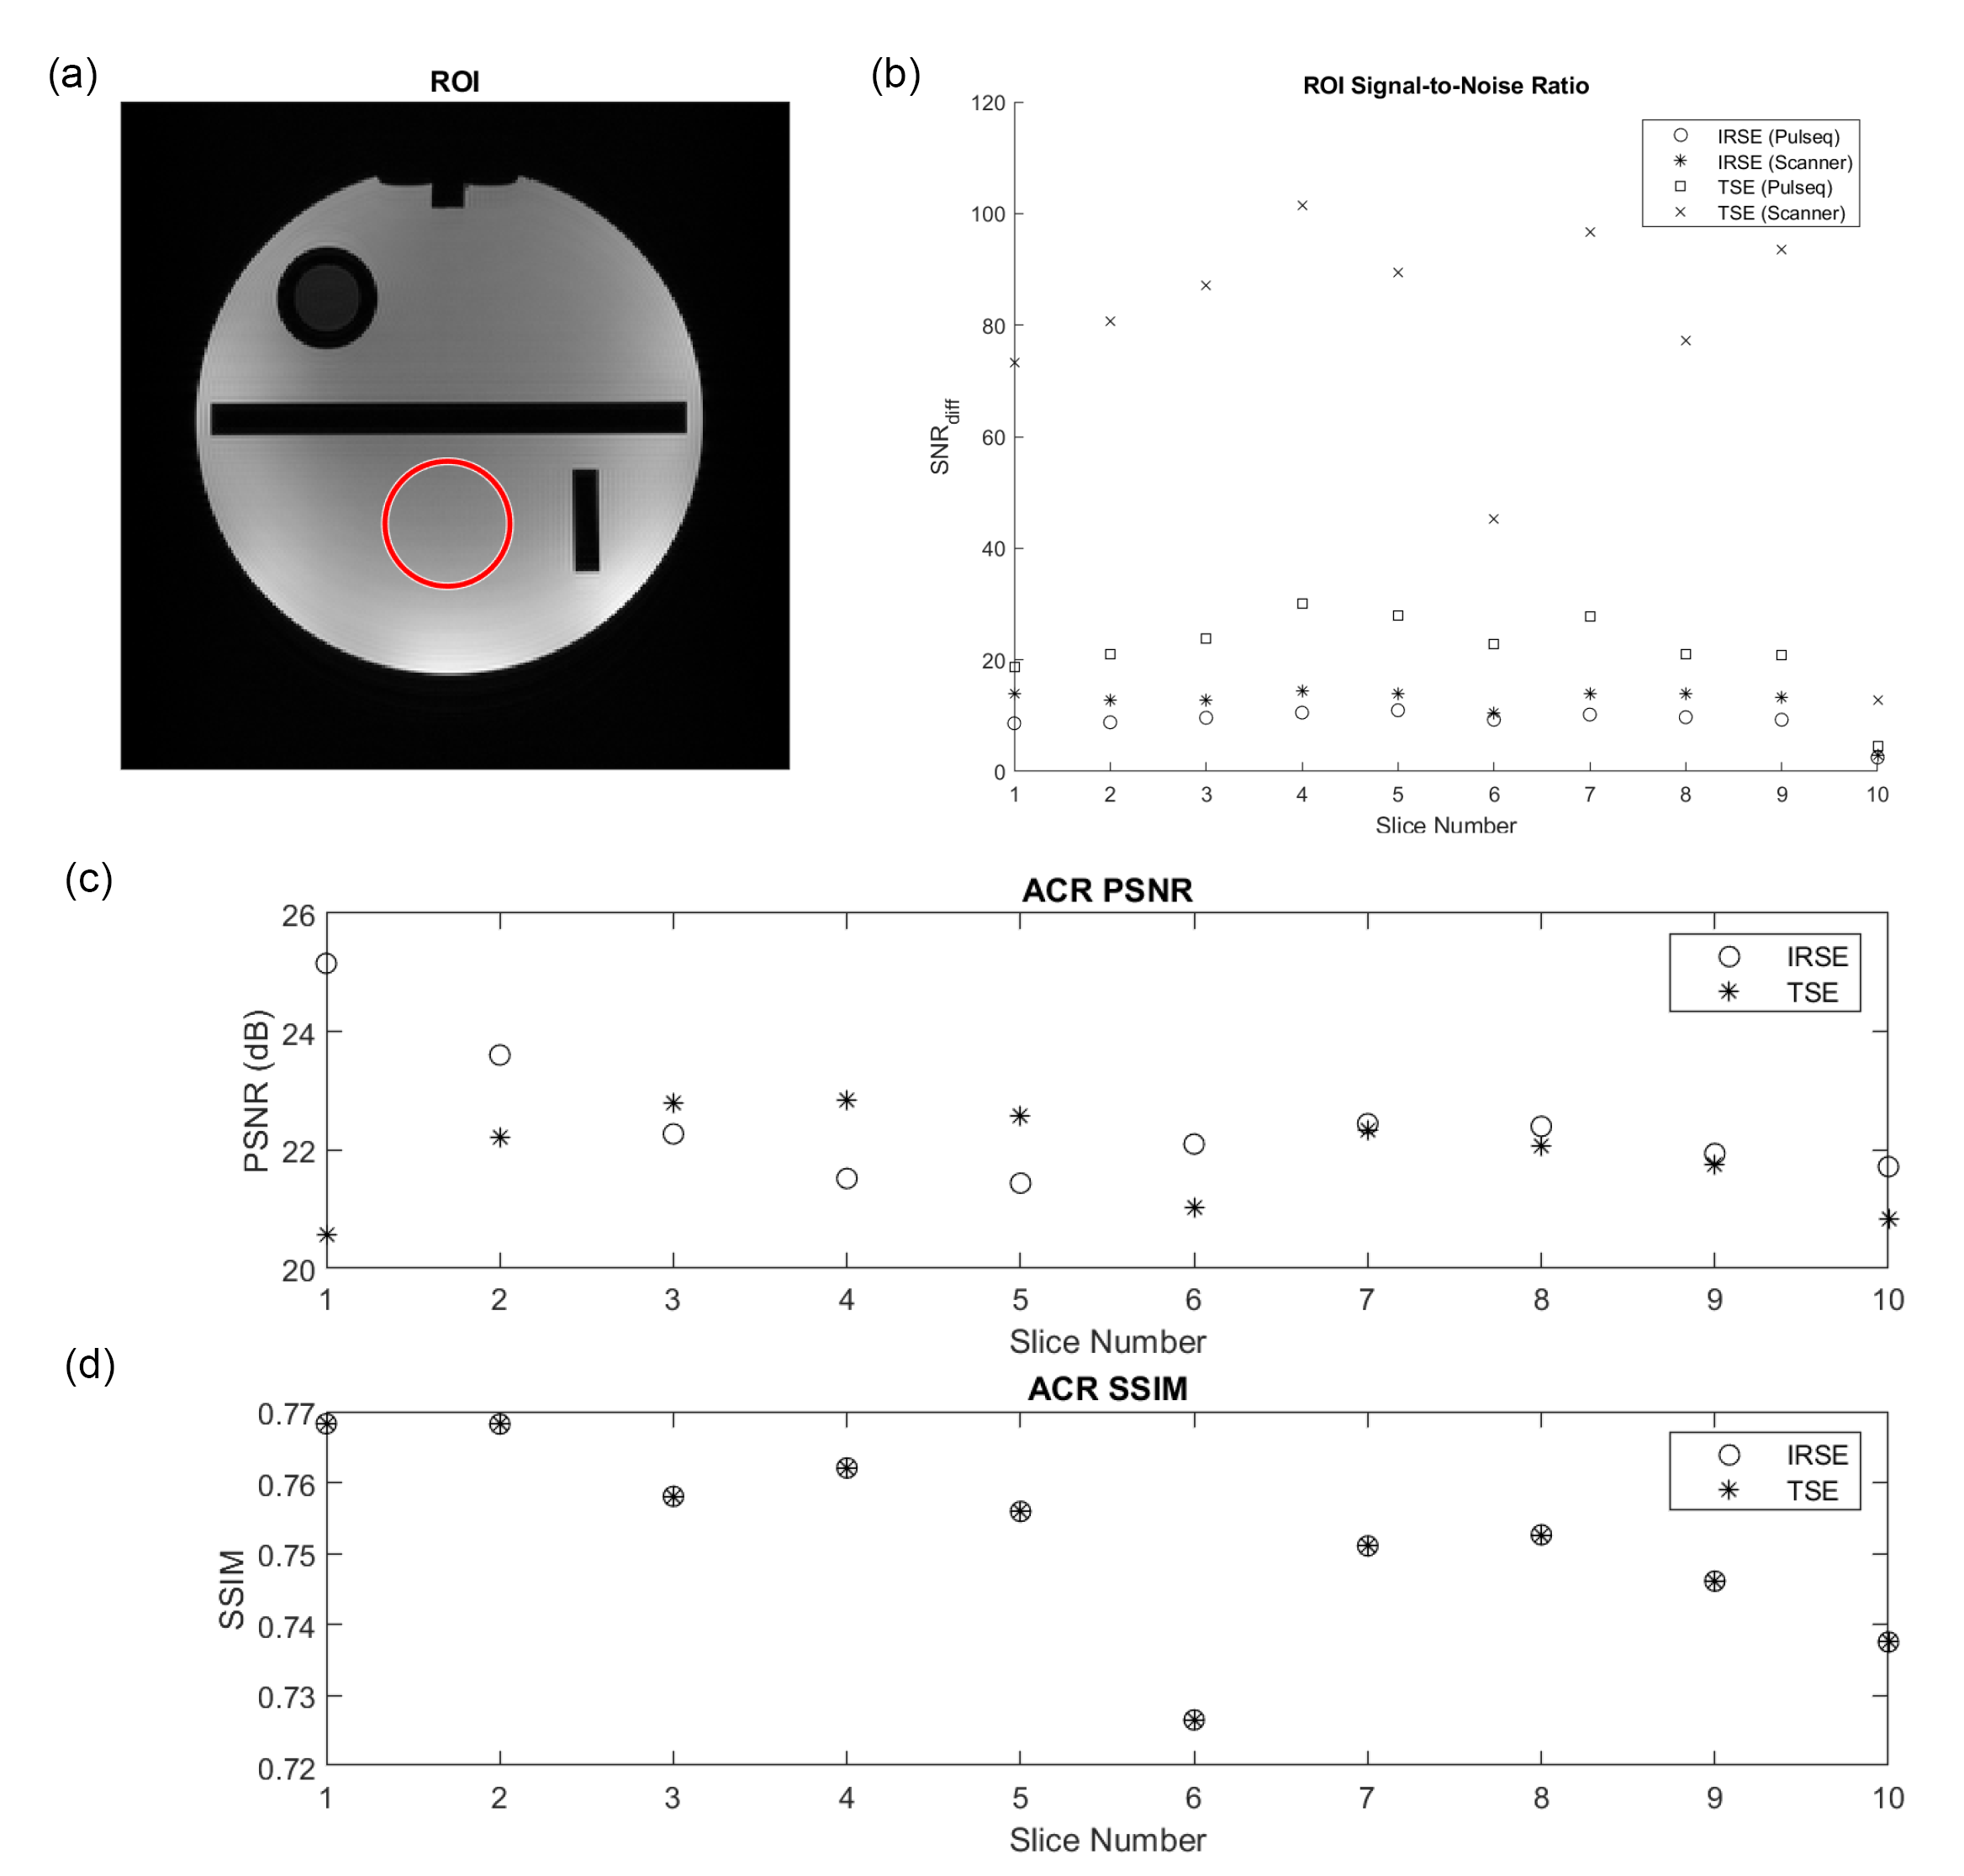
Image quality was assessed using double-acquisition SNR12, as well as PSNR and SSIM compared to vendor-provided sequences with matching parameters. Mapping accuracy was measured by Pearson’s correlation coefficient with regard to NIST values 11. Sequence safety was characterized by pre-scan SAR4seq13 calculations followed by SAR and PNS levels displayed on the console during scanning.
Results
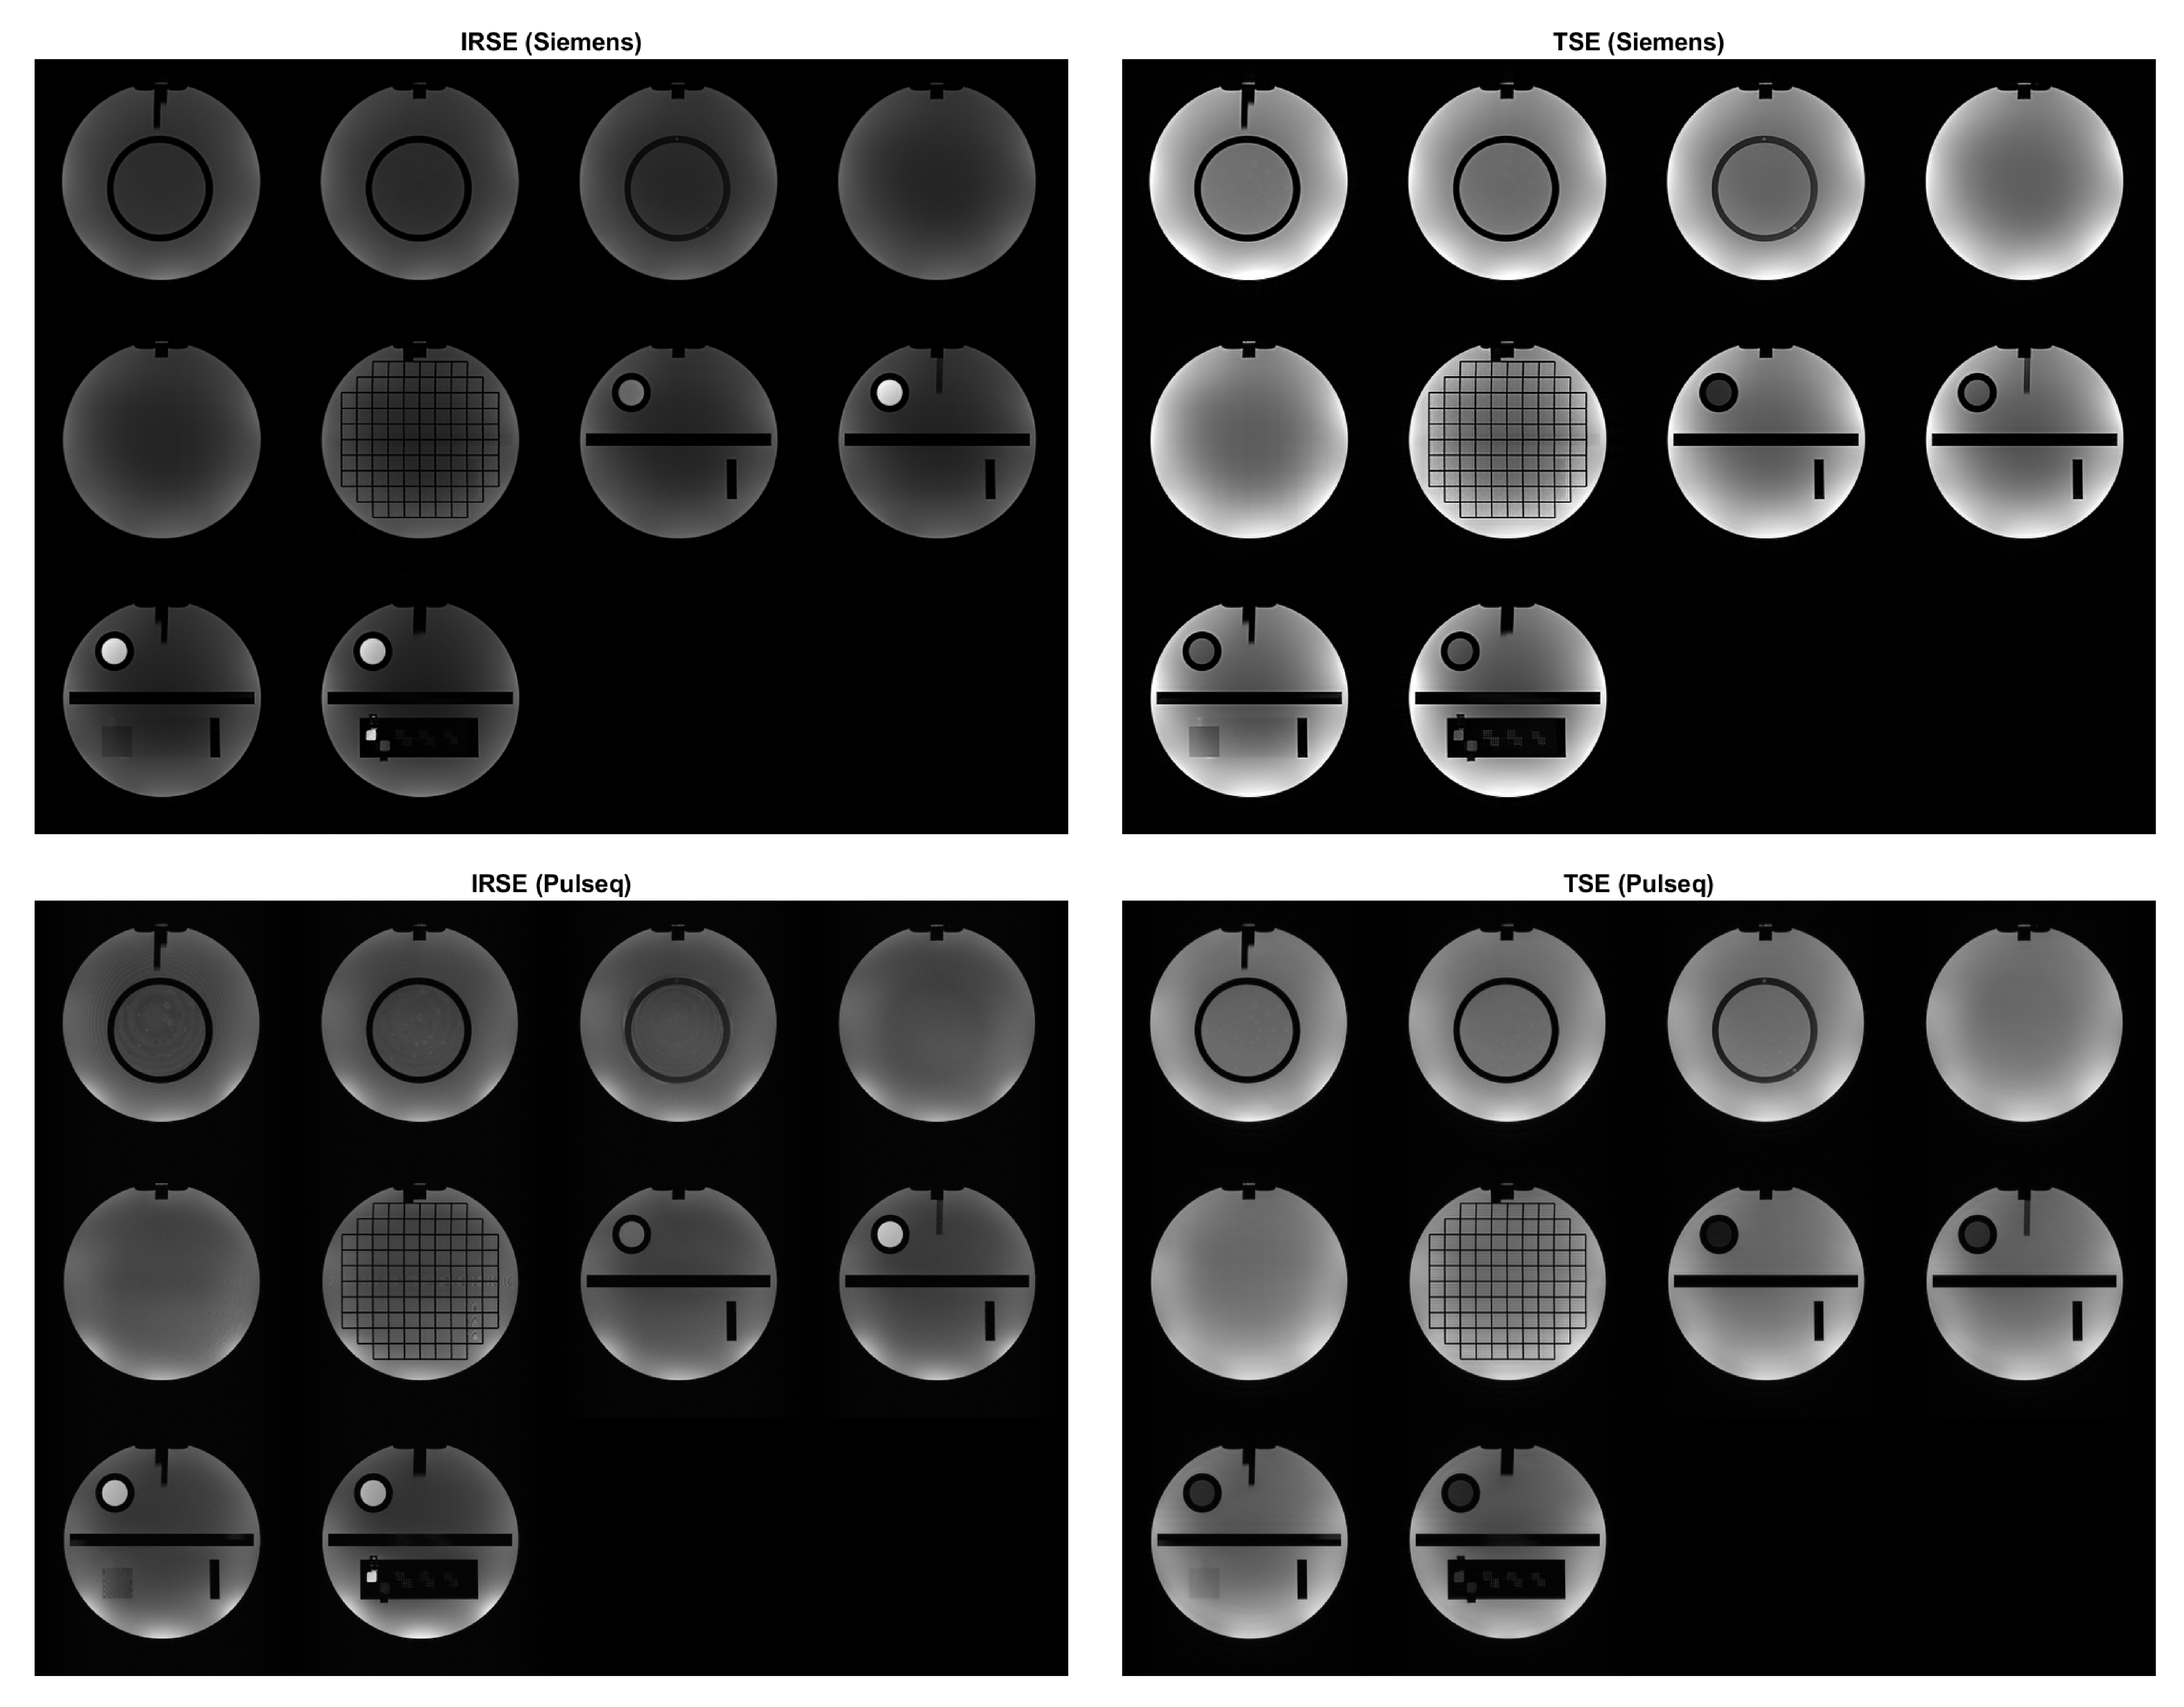
Simulations show expected geometry and contrast (Figure 1). For qualitative acquisition, TSE data shows comparable contrast between vendor and Pulseq, while the IRSE inversion time had to be shifted from 125 ms to 100 ms to achieve comparable contrast with the vendor sequence (Figure 2), as there appeared to be a systematic displacement in effective TI.T1 and T2 mapping show high accuracy for longer relaxation times while performing worse for shorter ones (Figure 3). We attribute this to the TI and TE ranges: the shortest TI, 50 ms, was too long to capture the shortest T1 = 23 ms on the T1 plane. Similarly, the lowest TE = 28 ms was insufficient for mapping the four lowest-T2 spheres (5.3 to 15.4 ms).
Image quality metrics are shown in Figure 4. Region-of-Interest (ROI) SNR were highest for vendor TSE and lowest for Pulseq IRSE. An average PSNR of 22.46 dB and SSIM of 0.75 resulted for IRSE; average PSNR was 21.90 dB and SSIM was 0.87 for TSE. The PSNR pattern across slices differed between IRSE and TSE, likely due to TI displacement in IRSE. SSIM values fluctuated similarly across slices. We attribute the variation across slices to differences in sequence implementation and channel combination.
All Pulseq sequences passed safety checks for a 70 kg, 175 cm subject. For qualitative IRSE, whole body SAR = 0.14 W/kg, average RF power = 11.2 W, and PNS level is 31.61%; for qualitative TSE, whole body SAR = 0.20 W/kg, average RF power = 15.5 W, and PNS threshold percentage is 12.15%. T1 mapping resulted in negligible whole body SAR, an average RF power of 0.5 W, and 70.83% PNS; T2 mapping gave a SAR of 0.04 W/kg, average power of 4.9 W, and 60.57% PNS.
Packaged example sequences were shared in a public Github repository14, including Google Colab notebooks for custom sequence generation. PDF forms for developers and users were included for applying the framework to general open-source sequences .
Discussion
This framework is a first step towards a shared standard for the open-source MR community that goes beyond platform demonstration scripts. By providing requirements for data and documentation, the framework was designed to ensure repeatability, safety, and transparent sharing for MR pulse sequences. Several limitations exist: first, the broad description of file types requires developers to define specific standards for a different platform; second, there is no hard limit on image quality measures, so users must judge for themselves when selecting sequences. Future work includes applying the framework to in-house sequences, providing code to standardize image quality measures, and distributing the framework for widespread acceptance.Conclusion
We presented a framework for validating pulse sequences with an emphasis on standardizing documentation and sharing of sequence quality and usage. Two basic MR sequences were put through simulation and phantom test experiments, documented, and shared in a public Github repository after packaging according to the requirements of the framework.Acknowledgements
This work was supported by the Seed Grant Program for MR Studies and the Technical Development Grant Program for MR Studies of the Zuckerman Mind Brain Behavior Institute at Columbia University and Columbia MR Research Center site, and was also performed at Zuckerman Mind Brain Behavior Institute MRI Platform, a shared resource and Columbia MR Research Center site.
References
- Mutsaerts HJMM, van Osch MJP, Zelaya FO, et al. Multi-vendor reliability of arterial spin labeling perfusion MRI using a near-identical sequence: Implications for multi-center studies. Neuroimage. 2015;113:143-152. doi:10.1016/j.neuroimage.2015.03.0432.
- Stöcker T, Vahedipour K, Pflugfelder D, Shah NJ. High-performance computing MRI simulations. Magn Reson Med. 2010;64(1):186-193. doi:10.1002/mrm.224063.
- Liu F, Velikina J V., Block WF, Kijowski R, Samsonov AA. Fast Realistic MRI Simulations Based on Generalized Multi-Pool Exchange Tissue Model. IEEE Trans Med Imaging. 2017;36(2):527-537. doi:10.1109/TMI.2016.26209614.
- Benoit-Cattin H, Collewet G, Belaroussi B, Saint-Jalmes H, Odet C. The SIMRI project: A versatile and interactive MRI simulator. J Magn Reson. 2005;173(1):97-115. doi:10.1016/j.jmr.2004.09.0275.
- Layton KJ, Kroboth S, Jia F, et al. Pulseq: A rapid and hardware-independent pulse sequence prototyping framework. Magn Reson Med. 2017;77(4):1544-1552. doi:10.1002/mrm.262356.
- Ravi KS, Potdar S, Poojar P, et al. Pulseq-Graphical Programming Interface: Open source visual environment for prototyping pulse sequences and integrated magnetic resonance imaging algorithm development. Magn Reson Imaging. 2018;52(February):9-15. doi:10.1016/j.mri.2018.03.0087.
- Nielsen JF, Noll DC. TOPPE: A framework for rapid prototyping of MR pulse sequences. Magn Reson Med. 2018;79(6):3128-3134. doi:10.1002/mrm.269908.
- Magland JF, Li C, Langham MC, Wehrli FW. Pulse sequence programming in a dynamic visual environment: SequenceTree. Magn Reson Med. 2016;75(1):257-265. doi:10.1002/mrm.256409.
- Jochimsen TH, Von Mengershausen M. ODIN - Object-oriented Development Interface for NMR. J Magn Reson. 2004;170(1):67-78. doi:10.1016/j.jmr.2004.05.02110.
- imr-framework/py2jemris: Python library for interfacing with JEMRIS. Accessed October 8, 2020. https://github.com/imr-framework/py2jemris11.
- Keenan K, Boos M, Jackson EF, Kown S-J, Jennings D, Russek S. NIST/ISMRM MRI System Phantom T1 Measurements on Multiple MRI System. Proc 21th Sci Meet Int Soc Magn Reson Med. 2013;21.12.
- Dietrich O, Raya JG, Reeder SB, Reiser MF, Schoenberg SO. Measurement of signal-to-noise ratios in MR images: Influence of multichannel coils, parallel imaging, and reconstruction filters. J Magn Reson Imaging. 2007;26(2):375-385. doi:10.1002/jmri.2096913.
- Geethanath S, Kabil J, Vaughan JT. Radio frequency safety assessment for open source pulse sequence programming. eMagRes. 2020;9(1):39-48. doi:10.1002/9780470034590.emrstm163314.
- tonggehua/mr-sequence-validation. Accessed December 11, 2020. https://github.com/tonggehua/mr-sequence-validation
Figures