3812
Deep Learning based spine labeling with three-plane 2D localizers without vertebrae segmentation1GE Healthcare, Bangalore, India, 2GE Global Research, Niskayuna, NY, United States, 3General Electric Company, Bangalore, India
Synopsis
In this work , we describe a deep learning-based methodology to generate vertebrae labels directly from the standard 2D tri-planar localizer images without the need any additional scanning or explicitly segmenting the vertebrae. This is accomplished by using deep-learning setup a to identify vertebrae labels directly on the localizer images. The method is demonstrated on lumbar spine localizer data to identify Thoracic-12 (T12), Lumbar-4 (L4) , and Sacral-1 (S1) vertebrae locations. In a test cohort of 50 lumbar MR spine exams, we report labeling accuracy of 92%, 98% and 96% for T12, L4 and S1 vertebrae respectively on localizer images.
Introduction
Spine labeling is an important task in planning and reporting of MR spine exams in routine clinical practice. During planning stage, MR technologist needs to label the vertebrae on localizer images, so that a scan order can be completed. Typically, MR spine labeling on localizer images is done manually.Automated methods exist, but they rely either on the higher resolution 2D images or specialized 3D scouts with isotropic resolution [1] for labeling. This disrupts the clinical workflow since additional scans must be done for this purpose. The standard image processing approach is to generate the vertebrae segmentation masks and then do labeling with initial seed [2] or additionally predict the vertebrae labels using machine learning [3].
In this work , we describe a deep learning (DL)-based methodology to generate vertebrae labels directly from the standard 2D tri-planar localizer images without the need for any additional scanning or explicitly segmenting the vertebrae. This is accomplished by using deep-learning based setup a to identify vertebrae points directly on the localizer images. The method is demonstrated on lumbar spine localizer images to identify Thoracic-12 (T12), Lumbar-4 (L4) , and Sacral-1 (S1) vertebrae labels.
Methods
Subjects: Spine MRI data for the study came from a single site. A total of 122 Spine exams from clinical subjects were included in the study. All the studies were approved by appropriate IRB.MRI Scanner and Acquisition: Regular 2D, three-plane single shot fast spin echo (SSFSE) localizer data was acquired on 1.5T MRI scanner (GE OptimaMR350), with Spine Array coil. While the data was acquired for all the three spine stations (cervical, thoracic and lumbar), we included only the data from lumbar station in this study. Acquisition parameters : TE/TR = 37.7/876 ms, Acquisition matrix = 288x192, recon matrix = 512x512, slice-thickness = 5 mm, slices variable across subjects.
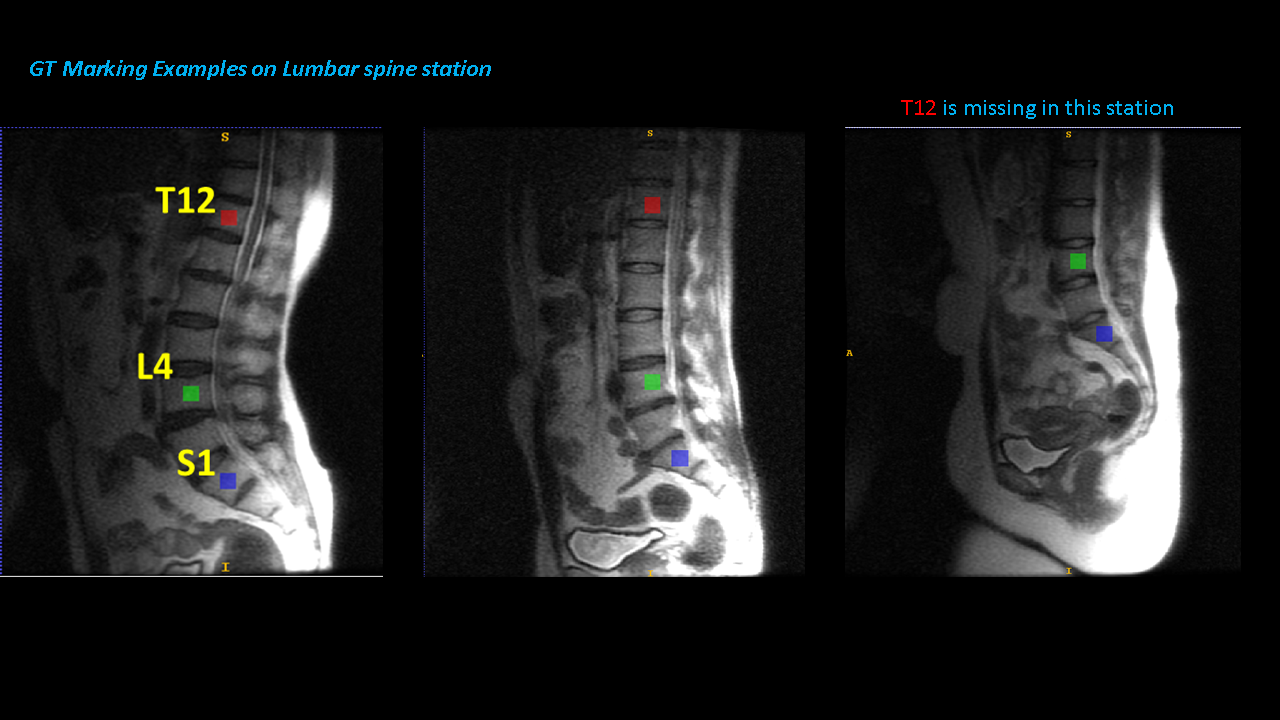
Ground-truth (GT) generation: A trained radiologist marked the locations of T12, L4 , and S1 vertebrae locations on the sagittal localizer images using the ITK-Snap tool [4]. The size of the brush was fixed to square 18 units for each label [Figure 1]. The radiologist had access to higher resolution whole spine sagittal T2 image for reference purposes. L4 and S1 vertebrae were marked in every case, while T12 vertebrae was not necessarily available in each case.
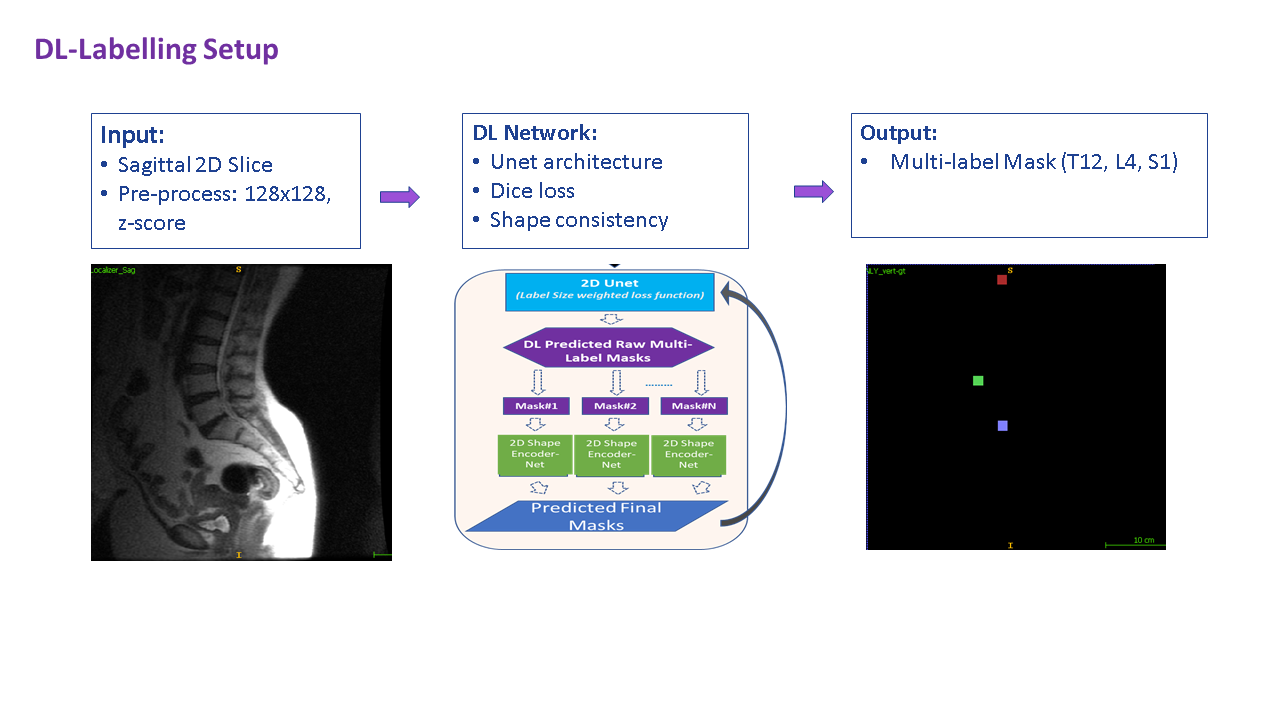
DL Architecture: Deep learning CNN based 2D UNet architecture [5] with size-weighted dice loss was adapted for multi-label segmentation of vertebrae location marking (See Figure 2). Shape consistency was implemented to ensure square shape for segmented labels. All experiments done using Keras package (v2.2.4) with TensorFlow backend (v1.15.0).
Deep-Learning Data: 72 cases were chosen for DL model training and 50 cases for testing the algorithm. The training datasets were further augmented using rotations, translations and image resampling, generating 3155 slices for training, with 10% of training cases used for validation and model selection. Finally, the image and associated label data were resampled to a grid size of 128x128 and input image z-score normalized for training purposes. During model inferencing, the pre-processing steps were replicated, model inferred and predicted multi-label data resampled to native image for computing assessment metrics.
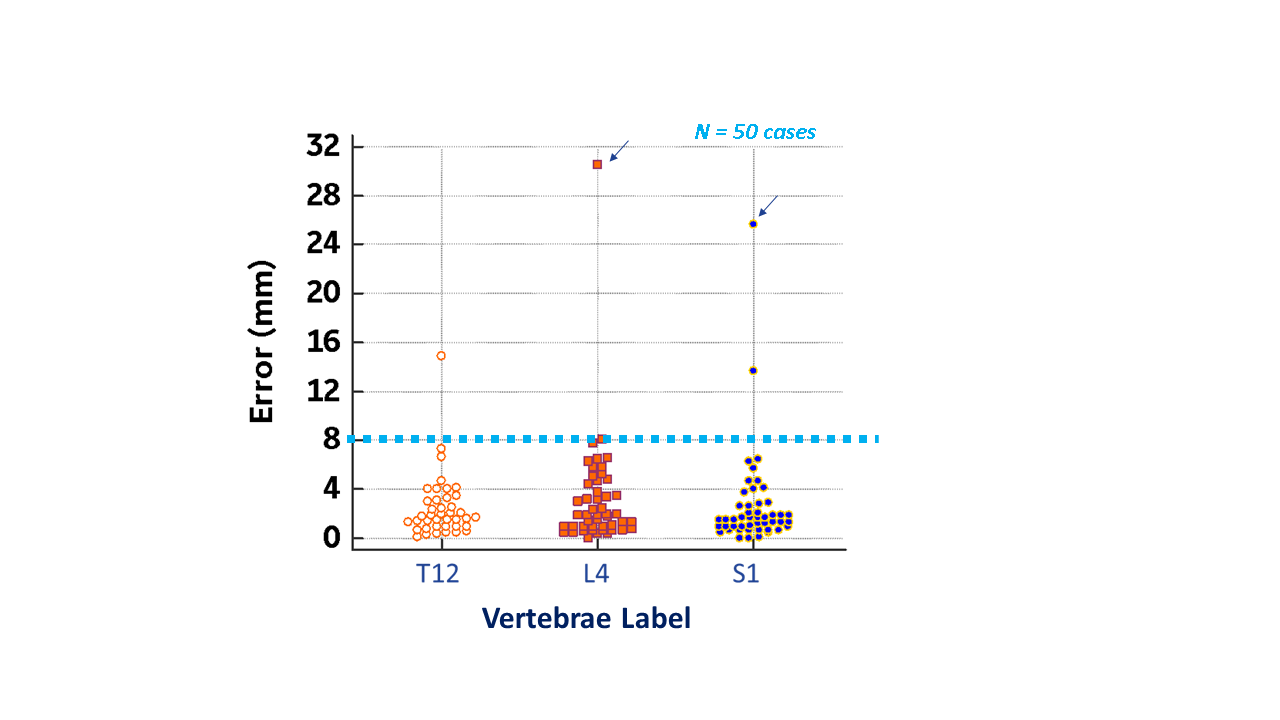
Accuracy Assessment: Localization error was computed as Euclidean distance error between the centroids of the ground-truth and DL -predicted vertebrae labels. Since vertebrae is ~ 16-18 mm in length and breadth, centroid distance error < 8 mm was considered acceptable for labeling purposes.
Results and Discussion
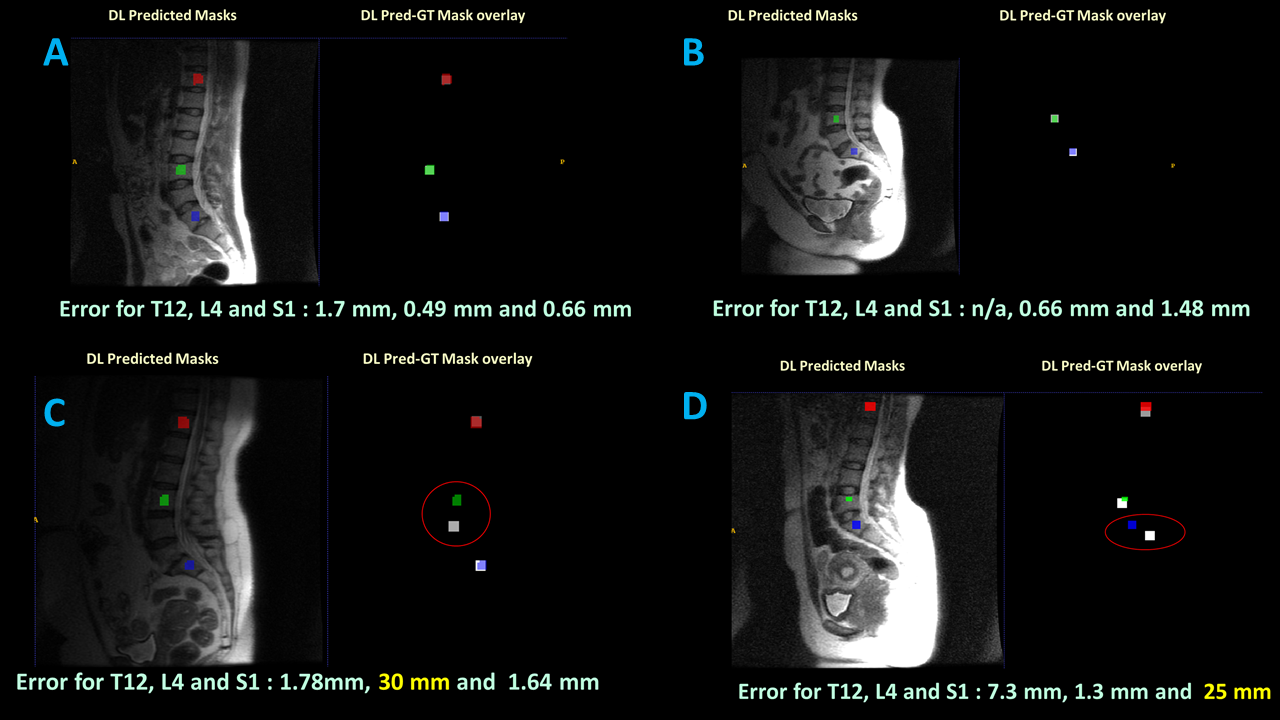
Figure 3 shows the scatterplot for localization errors in T12, L4 and S1 locations in 50 test cases, with the acceptability cutoff line indicated at 8mm. The network predicted T12 with mean localization error = 2.4 mm ± 2.6 mm, L4 location with a mean error = 3.2mm ±4.5mm, S1 with mean error = 2.7 mm ± 4.1 mm and are within the acceptable limit of 8 mm. Figure 4 shows the sample results in cases with good performance and those with outliers. For T12 vertebrae location, the algorithm matched with GT for absence of vertebrae location in 6/9 cases. In two cases, DL predicted a label when GT indicated it missing (false-positive) while vice-versa (false-negative) in one case. The outliers in the data are not consistent across labels in a particular dataset. For e.g. for case with L4 error = 30 mm, the error for S1 was 1.64 mm. Similarly, for case with S1 error = 23 mm, the error for L4 was only 1.3 mm.Using a cutoff of 8 mm and accounting for false-positive and false-negative predictions, overall success rate for label accuracy was: T12 = 92%, L4 = 98% and S1 = 96%.
The results indicate that by using a denser set of labels, the error will potentially be reduced further since closer vertebrae labels will act as anchor points for neighboring labels. The results also suggest that label error in one vertebra can be compensated with other vertebrae labels markings as well.
Conclusion
We have demonstrated DL based methodology for labeling vertebrae on regular tri-planar localizers. The method has acceptable performance on clinical data, reduced manual labeling effort and thereby potentially adapted for spine exam planning workflow by technologist. Next, we plan to extend the work to whole spine localizers using dense labeling.Acknowledgements
No acknowledgement found.References
1. “Robust MR Spine Detection Using Hierarchical Learning and Local Articulated Model”, Yiqiang Zhan et.al., MICCAI 2012, Part I, LNCS 7510, pp. 141–148, 2012.
2. “A Deep Learning Based Solution for Vertebrae Segmentation of Whole Spine MR Images: A step closer to Automated Whole Spine Labeling”, Kavitha Manickam et.al., Proceedings of the Joint Annual Meeting of ISMRM-ESMRMB, Paris, 2018, p. 3143
3. “Automatic Localization and Labelling of Spine Vertebrae in MR Images Using Deep Learning.” naei, Pardiss. 2020. Electronic Theses and Dissertations (ETDs) 2008+. T, University of British Columbia. doi:http://dx.doi.org/10.14288/1.0390680.
4. Paul A. Yushkevich, Joseph Piven, Heather Cody Hazlett, Rachel Gimpel Smith, Sean Ho, James C. Gee, and Guido Gerig. User-guided 3D active contour segmentation of anatomical structures: Significantly improved efficiency and reliability. Neuroimage 2006 Jul 1;31(3):1116-28.
5. “U-Net: Convolutional Networks for Biomedical Image Segmentation”, Olaf Ronneberger, Philipp Fischer, Thomas Brox, Medical Image Computing and Computer-Assisted Intervention (MICCAI), Springer, LNCS, Vol.9351: 234--241, 2015
Figures