3810
Simulating the Effects of Diffusion on Hyperpolarized [1-13C]-Pyruvate Signal Evolution
Reshmi J. S. Patel1, Collin J. Harlan1, and James A. Bankson1,2
1Department of Imaging Physics, The University of Texas MD Anderson Cancer Center, Houston, TX, United States, 2The University of Texas MD Anderson Cancer Center UT Health Graduate School of Biomedical Sciences, Houston, TX, United States
1Department of Imaging Physics, The University of Texas MD Anderson Cancer Center, Houston, TX, United States, 2The University of Texas MD Anderson Cancer Center UT Health Graduate School of Biomedical Sciences, Houston, TX, United States
Synopsis
Hyperpolarized [1-13C]-pyruvate MRI is an emerging imaging method that offers unprecedented spatiotemporal resolution for monitoring tumor metabolism in vivo. To establish a robust imaging biomarker, we must characterize phenomena that may modulate the apparent conversion rate of pyruvate into lactate (kpl). We sought to investigate the potential effect of diffusion on pyruvate-to-lactate conversion. HP signal evolution, as calculated by finite-difference time domain simulation of a 2D tissue model, was fit to a two-compartment pharmacokinetic model. Results indicate for low intracellular kpl, diffusion has a minimal impact, but pyruvate diffusion can reduce the apparent rate of conversion at high intracellular kpl.
Introduction
Hyperpolarized [1-13C]-Pyruvate Magnetic Resonance Imaging (HP MRI) is an emerging metabolic imaging method to visualize tumor metabolism with unprecedented sensitivity and spatiotemporal resolution.1,2 This method relies on measuring the signal evolution of HP pyruvate and its conversion to lactate within tumor cells. To establish a robust imaging biomarker for tumor metabolism, we must understand and characterize those phenomena that may modulate the apparent conversion rate of HP pyruvate into lactate (kpl). Models that fail to account for movement of metabolites through physiological compartments may underestimate kpl.3 In this study, we present a new pharmacokinetic (PK) model exploring diffusion of HP pyruvate as a potential rate-limiting physiological barrier.Methods
Using in silico experiments, our goal was to simulate signal evolution in the presence of diffusion and evaluate its effect on quantitative estimation of kpl. First, we simulated diffusion of pyruvate from a vessel in a 2D tissue model, and its subsequent conversion to lactate at a known rate within cells (Figure 1). Second, we fit those curves to a 2-compartment spatially invariant pharmacokinetic model to determine the macroscopic apparent conversion rate in tissue.3 This process allowed for direct comparison between the models to clearly visualize the impact of diffusion.To accurately simulate signal evolution including diffusion, we utilized the following literature values: diffusion constant in water ~1 μm2/ms in water,4 diffusion constant in cytosol ~0.1 μm2/ms,5 an average tumor capillary diameter ~6.7 μm,6 an average tumor cell diameter ~20 μm.7 The field size was equivalent to average distance between tumor capillaries, 50 or 100 μm,8 pyruvate was initialized in the vessel or uniform across the field, and the intracellular kpl ‘input’ spanned from 0.002 to 2.000 s-1.
Diffusion was modeled according to Fick’s Second Law. The finite-difference time domain simulation implements a 2-dimensional model described by:
$$ \frac{\partial C}{\partial t}=\frac{\partial}{\partial x} \Bigg( D(x) \cdot \frac{\partial}{\partial x} C(x,t) \Bigg)+\frac{\partial}{\partial y} \Bigg( D(y) \cdot \frac{\partial}{\partial y} C(y,t) \Bigg) $$
Here, D is the diffusion rate constant and C is the concentration of labeled pyruvate and lactate. This equation was applied to a 2D tissue model containing a central vessel surrounded by cells that fill ~50 percent of the extravascular region. Additional coupled equations accounted for signal relaxation, and permitted chemical conversion was within cells at a known and controlled rate. By tracking HP pyruvate and lactate magnetization per grid entry with a spatial resolution of 0.1 μm and temporal resolution of 0.005 ms, we obtain signal evolution curves that include diffusion effects (Figure 2).
The pharmacokinetic model that was used to analyze these curves includes two chemical compartments and two physical compartments: extravascular/extracellular (ev), and intracellular (ic). In this analysis, magnetization initialized in the center vessel was assumed to be part of the ev space. The volume fractions for ev and ic compartments are vee and vc, respectively, and kec describes the transport rate across the cellular membrane. The relationship between the pyruvate and lactate concentrations in each compartment is1:
$$ \begin{equation*} \begin{pmatrix} Pyr_{ev}(t) \\ Lac_{ev}(t) \\ Pyr_{ic}(t) \\ Lac_{ic}(t) \end{pmatrix} = e^{At} \begin{pmatrix} Pyr_{ev}(t=0) \\ Lac_{ev}(t=0) \\ Pyr_{ic}(t=0) \\ Lac_{ic}(t=0) \end{pmatrix} \end{equation*} $$
with RPyr and RLac corresponding to T1 relaxation losses and the matrix A defined as:
$$ \begin{equation*} A = \begin{pmatrix} -(\frac{k_{ec}}{v_e}+R_{Pyr}) & 0 & \frac{k_{ec}}{v_{ee}} & 0 \\ 0 & -(\frac{k_{ec}}{v_{ee}}+R_{Lac}) & 0 & \frac{k_{ec}}{v_{ee}} \\ \frac{k_{ec}}{v_c} & 0 & -(\frac{k_{ec}}{v_{ee}}+k_{pl}+R_{Pyr}) & 0 \\ 0 & \frac{k_{ec}}{v_c} & k_{pl} & -(\frac{k_{ec}}{v_c}+R_{Lac}) \end{pmatrix} \end{equation*} $$
The output of the diffusion simulation was fit to this model by minimizing the mean-square residual over 100 runs.1 All simulations were conducted in MATLAB.
Results
The diffusion simulation (Figure 2) showed that variation of the field size and the initial location of pyruvate had a negligible impact on the resulting fit and kpl value. The sole determining factor was the kpl input into the diffusive model. The simulated signal was fit reasonably well by the spatially invariant PK model, as seen in plots with representative kpl values (Figure 3). Macroscopic conversion rates agreed well with intracellular conversion rates for kpl values below approximately 0.45 s-1. Diffusion effects led to a 10% reduction in macroscopic kpl for intracellular kpl > 0.45 s-1, and diffusion led to an increasing under-estimation of the apparent rate constant above that value (Figure 4).Discussion
This preliminary analysis of the effects of diffusion on HP MRI signal evolution suggests that diffusion may reduce macroscopic kpl, the apparent rate constant for conversion of HP pyruvate into lactate in tissue, when intracellular conversion rates are high. As the diffusion model kpl increased, the non-diffusive PK model increasingly underestimated the rate of conversion. This effect is less apparent at low intracellular conversion rates, when conversion is slow compared to diffusion. Thus, this data suggests that above the kpl = 0.45 s-1, diffusion may lead to an underestimation of tumor metabolism and the apparent rate at which HP pyruvate is converted into lactate within tumor cells.This study modeled 2-dimensional diffusion of HP pyruvate; further work is needed to resolve this limitation by adding a third spatial dimension to the simulation. Additional future directions include designing experimental methods to both validate the in silico results and determine quantitatively the effect of diffusion on the precise intracellular value of kpl.
Acknowledgements
This work was supported in part by the National Cancer Institute of the National Institutes of Health (R01CA211150) and the Cancer Prevention Research Institute of Texas (RP170067). The content is solely the responsibility of the authors and does not necessarily represent the official views of these agencies.References
- Ardenkjaer-Larsen JH, Fridlund B, Gram A, Hansson G, Hansson L, Lerche MH, Servin R, Thaning M, Golman K. Increase in signal-to-noise ratio of > 10,000 times in liquid-state NMR. Proc Natl Acad Sci USA 100(18):10158-63, 2003.
- Golman K, in 't Zandt R, Thaning M. Real-time metabolic imaging. Proc Natl Acad Sci U S A 103(30):11270-5, 2006.
- Bankson JA, Walker CM, Ramirez MS, et al. Kinetic Modeling and Constrained Reconstruction of Hyperpolarized [1-13C]-Pyruvate Offers Improved Metabolic Imaging of Tumors. Cancer Res. 2015;75(22):4708-4717. doi:10.1158/0008-5472.CAN-15-0171
- Sehy JV, Ackerman JJ, Neil JJ. Apparent diffusion of water, ions, and small molecules in the Xenopus oocyte is consistent with Brownian displacement. Magn Reson Med. 2002;48(1):42-51. doi:10.1002/mrm.10181
- Carlson BE, Vigoreaux JO, Maughan DW. Diffusion coefficients of endogenous cytosolic proteins from rabbit skinned muscle fibers. Biophys J. 2014;106(4):780-792. doi:10.1016/j.bpj.2013.12.044
- Vogel AW. Intratumoral vascular changes with increased size of a mammary adenocarcinoma: new method and results. J Natl Cancer Inst. 1965;34:571-578.
- Hosokawa M, Kenmotsu H, Koh Y, et al. Size-based isolation of circulating tumor cells in lung cancer patients using a microcavity array system. PLoS One. 2013;8(6):e67466. Published 2013 Jun 28. doi:10.1371/journal.pone.0067466
- Rieger H, Welter M. Integrative models of vascular remodeling during tumor growth. WIREs Syst Biol Med. 2015;7:113-129. doi: 10.1002/wsbm.1295
Figures
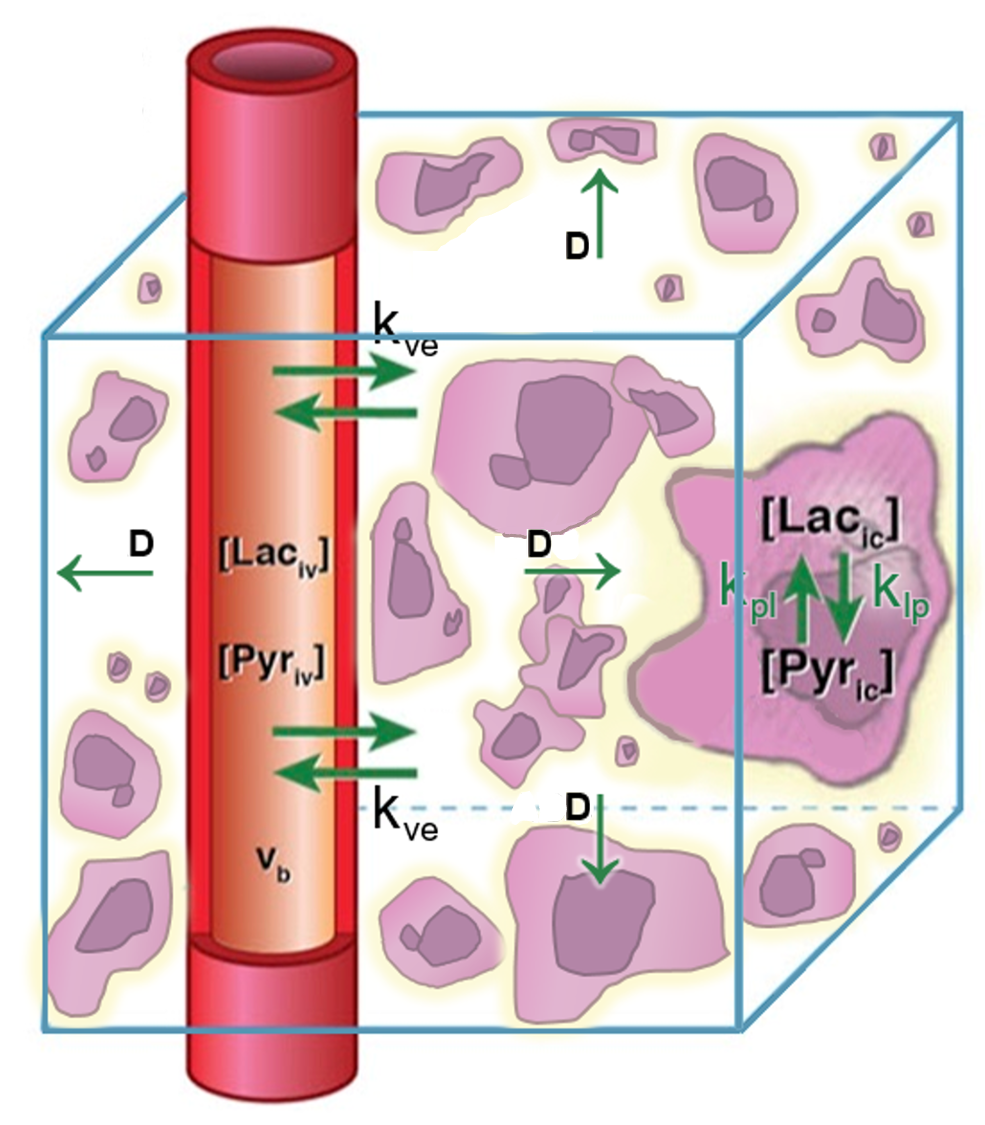
Figure 1. A candidate model for in vivo pyruvate-to-lactate signal evolution incorporating pyruvate diffusion was simulated. An HP pyruvate bolus is injected into a central vessel followed by perfusion out of the vessel, diffusion through extravascular/extracellular space with diffusion constant D, perfusion into cells, and chemical conversion with rate constant kpl.
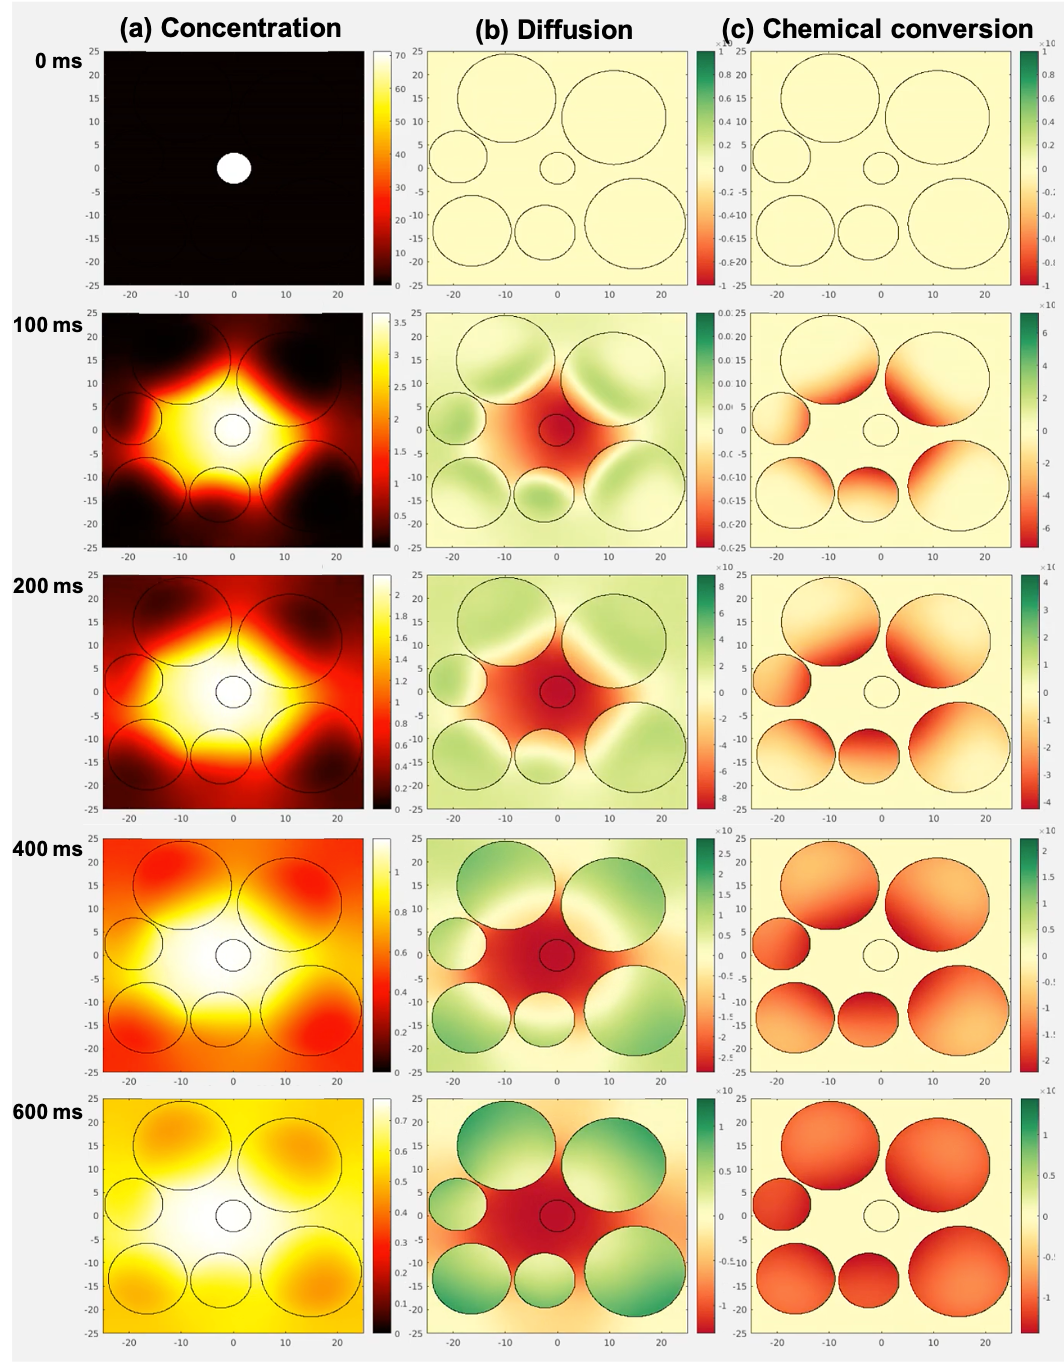
Figure 2. A map of the diffusive simulation (intracellular kpl=2.0 s-1, FOV=50 μm) is shown at representative timepoints. Pyruvate starts in the vessel and diffuses outward. (a) A yellow ring spreads radially outward indicating higher pyruvate concentration as pyruvate moves from the vessel to the surrounding extracellular/extravascular (ev) and intracellular space. (b) Red indicates decreasing pyruvate in the vessel and green indicates increasing pyruvate in the cells. (c) Chemical conversion occurs only within the cells, which turn red as pyruvate converts to lactate.
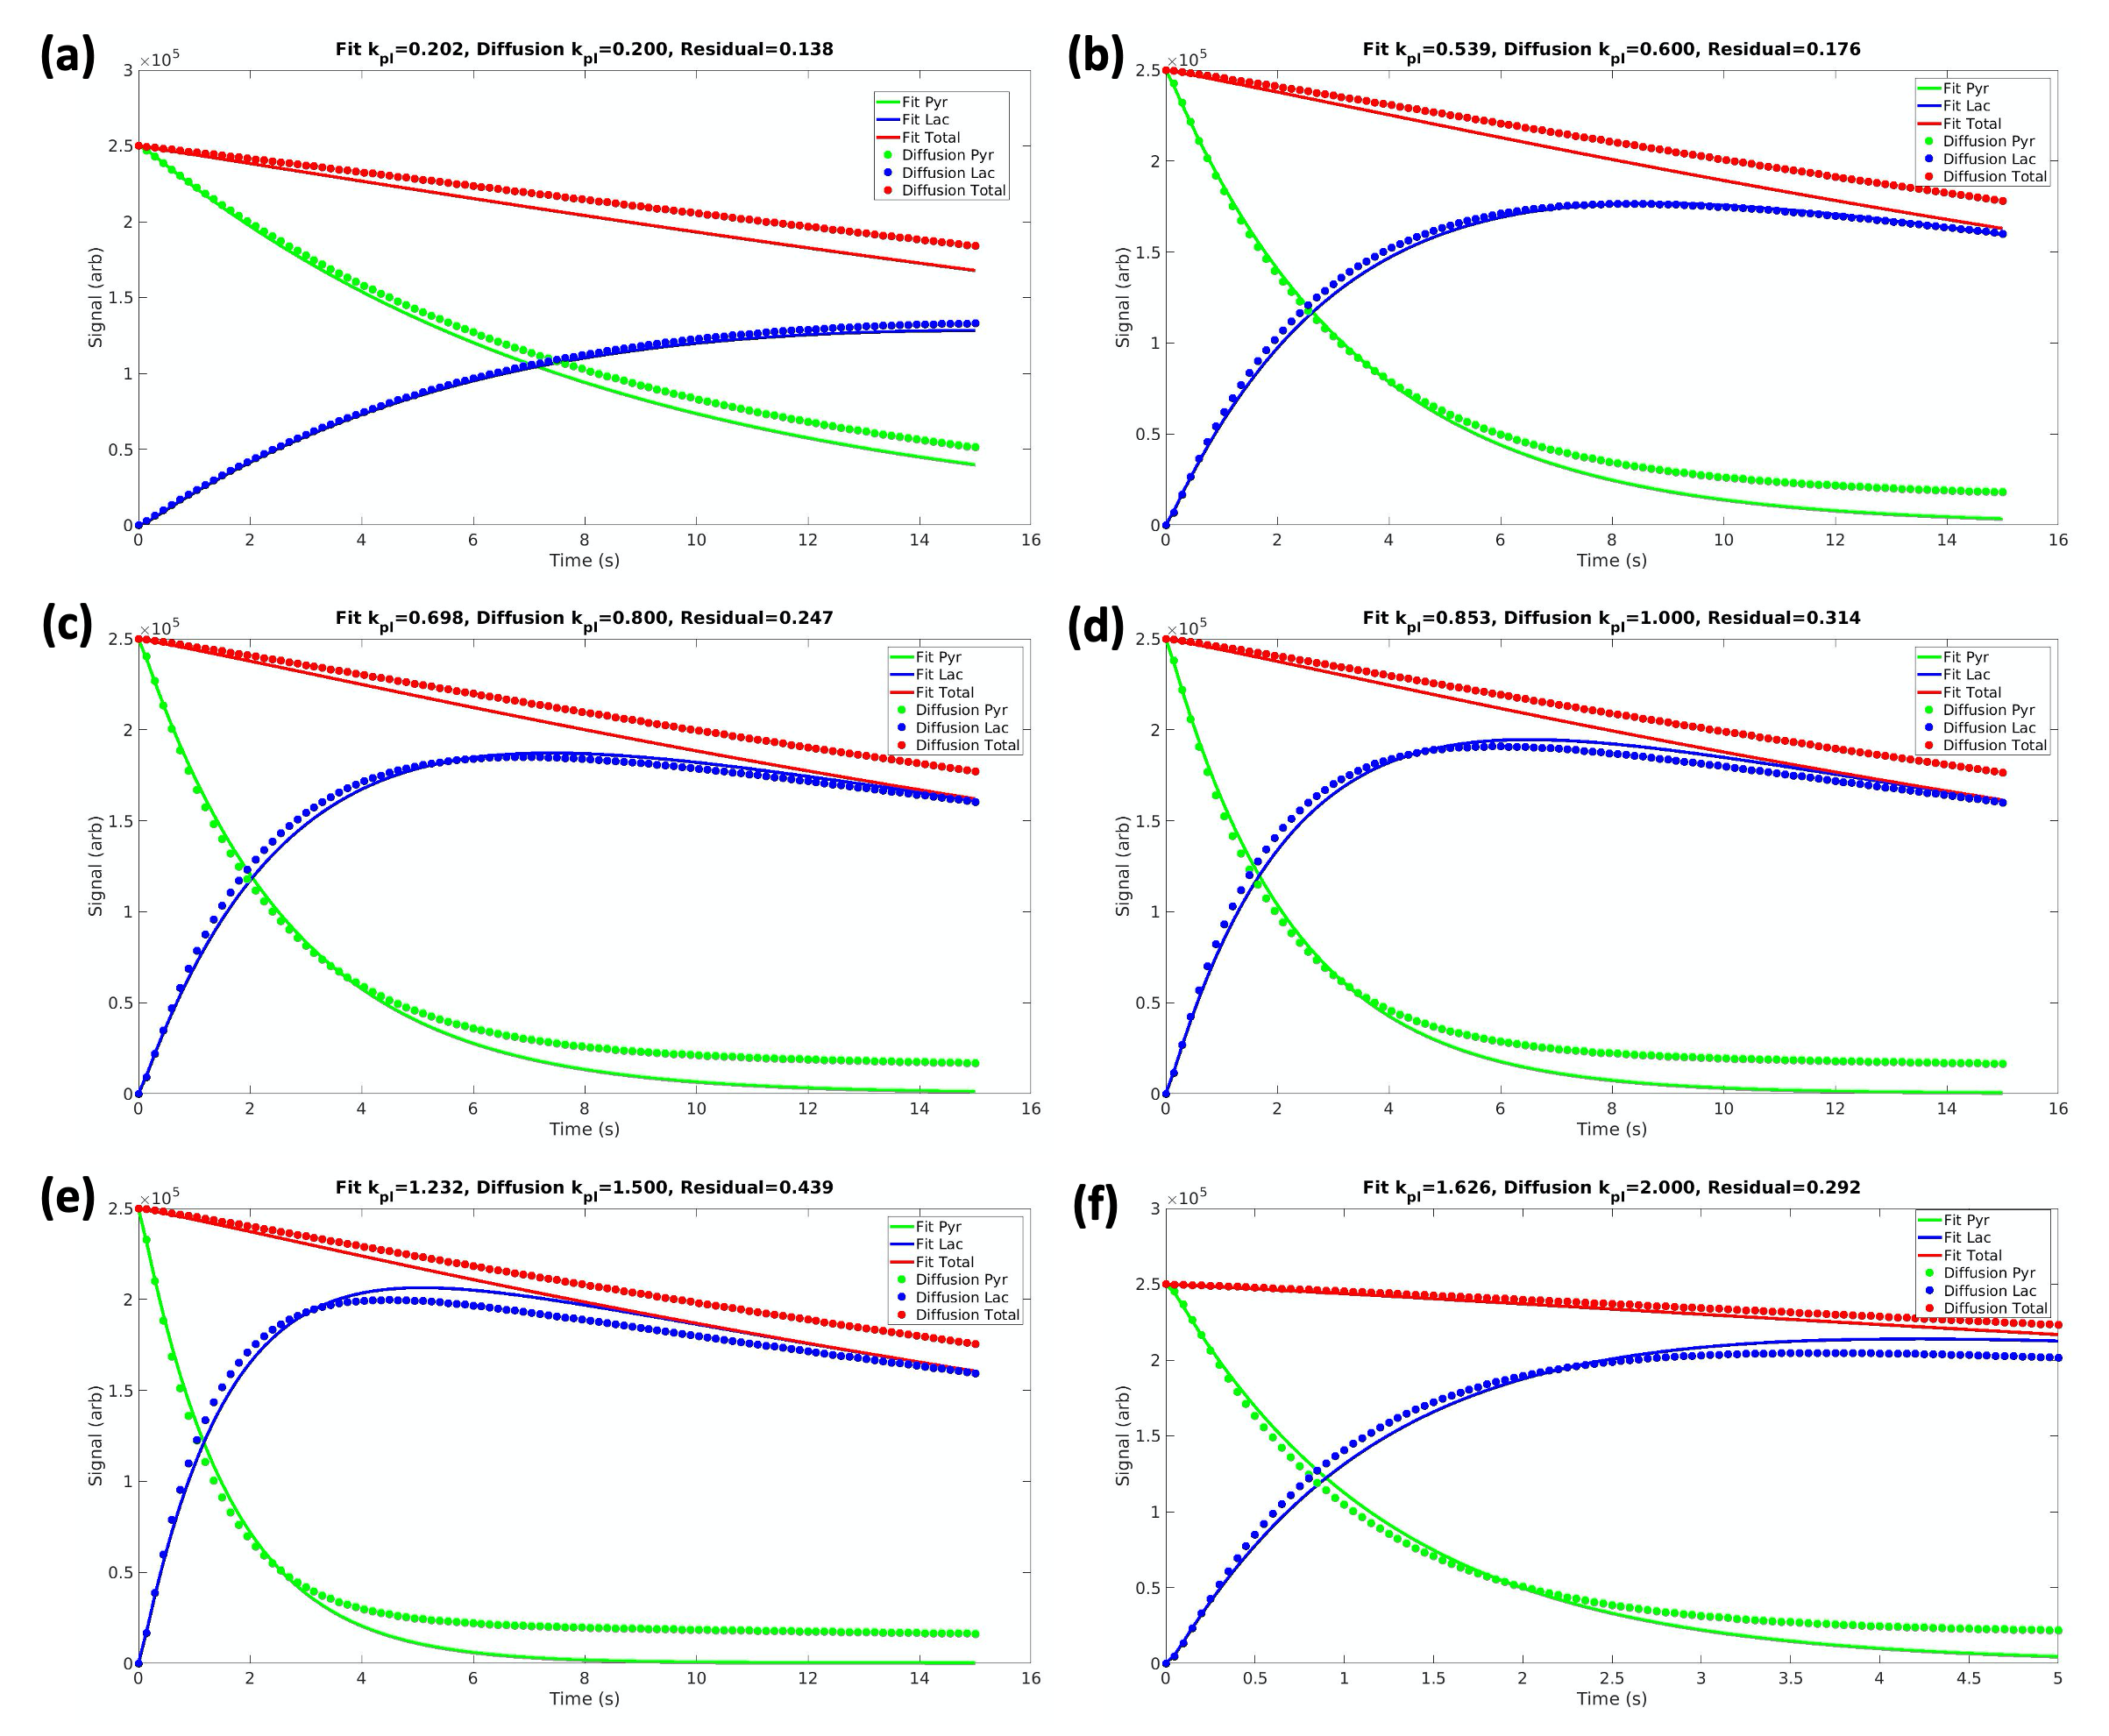
Figure 3. The signal evolution of pyruvate, lactate, and the metabolite total from the diffusion simulation are fit with the non-diffusive model for kpl values varying from 0.2 to 2.0 s-1. The decrease in the total signal (red) is due to T1 relaxation losses. All plots have a good fit with a mean-squared residual of less than 0.5, enabling accurate comparison of kpl values in the two models. As input diffusion kpl increases from (a) to (f), the fitted kpl from the non-diffusive model is lower than the input kpl by a widening margin.
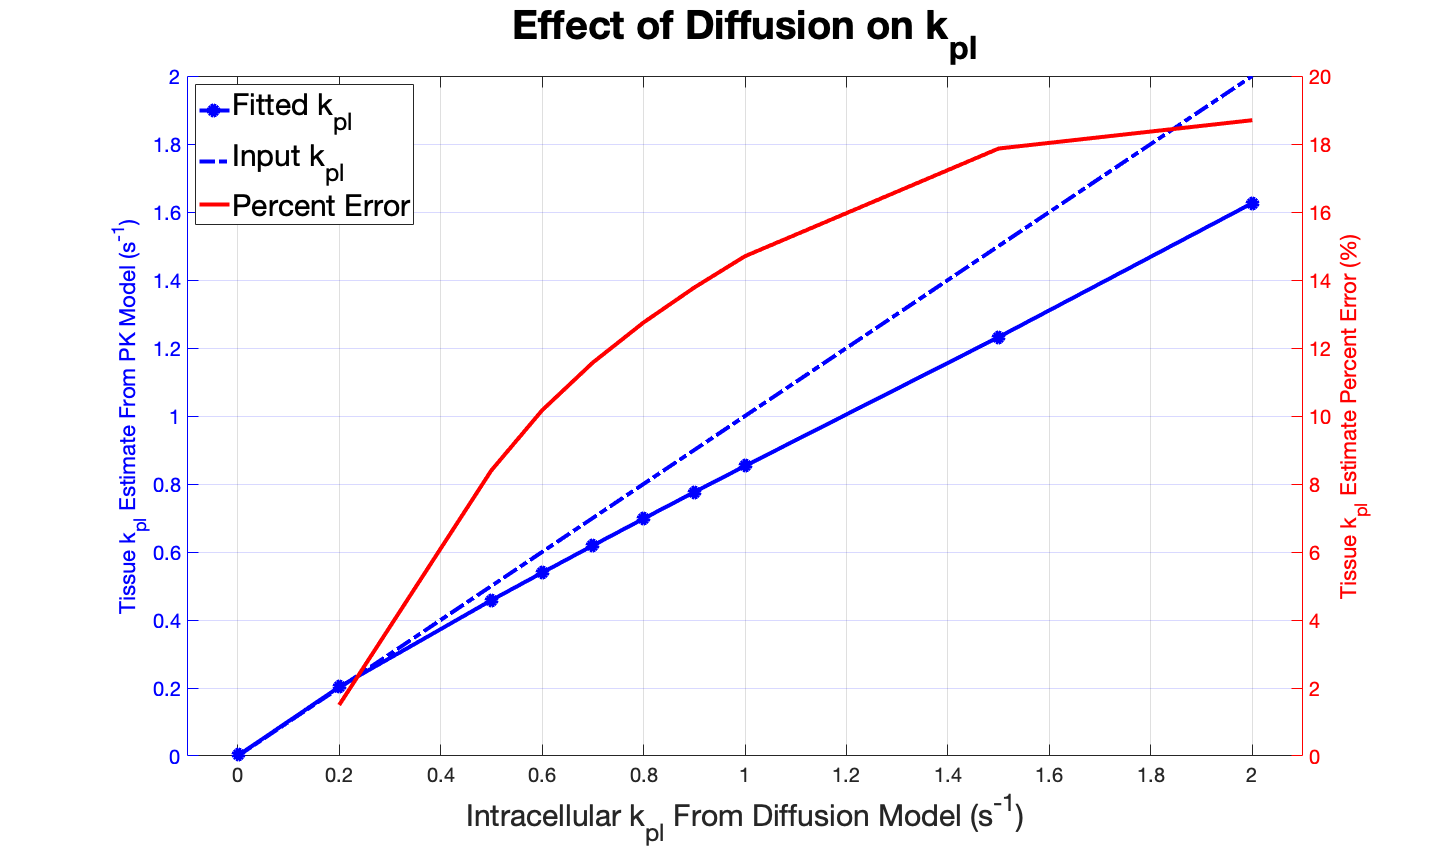
Figure 4. kpl values resulting from fitting the non-diffusive model are plotted against the kpl inputted to generate signal evolution data from the diffusive model. Diffusion effects cause a 10% reduction in macroscopic kpl for intracellular kpl=0.45 s-1. The red curve shows the percent error in the estimated tissue kpl increases with intracellular kpl.