3801
Hyperpolarized 13C Spectroscopy with Simple Slice-and-Frequency-Selective Excitation1Department of Nuclear Medicine, School of Medicine, Klinikum rechts der Isar, Technical University of Munich, Munich, Germany, 2Diagnostic and Interventional Radiology, School of Medicine, Klinikum rechts der Isar, Technical University of Munich, Munich, Germany, 3German Cancer Consortium (DKTK) and German Cancer Research Center (DKFZ), Heidelberg, Germany, 4Division of Solid Tumor Translational Oncology, German Cancer Consortium (DKTK), West German Cancer Center, University Hospital Essen, Essen, Germany
Synopsis
A narrow-bandwidth alternating-frequency multi-frame slice-selective-excitation FID spectroscopy sequence was implemented with minimal pulse sequence modification by prescribing spatially offset slices. This sequence was used to measure hyperpolarized [1‑13C]lactate and its downstream metabolite [1‑13C]pyruvate in a xenograft rat model of human pancreatic cancer (PSN1). Broad bandwidth excitation has difficulty separating the smaller pyruvate peak from the larger peak of injected lactate, when analyzed with magnitude spectra, phased complex spectra, or spectral fitting with the AMARES algorithm, particularly for multi-frame data. Narrow bandwidth excitation spectroscopy is simpler and more consistent to analyze, by achieving the spectral separation during acquisition.
Introduction
Broad bandwidth excitation slice spectroscopy and spectroscopic imaging are used with hyperpolarized 13C-labelled compounds for characterization of metabolism. The most-commonly used hyperpolarized compound, [1‑13C]pyruvate, and its metabolite [1‑13C]lactate, have similar peak amplitudes, but the reverse experiment, injection of hyperpolarized [1‑13C]lactate, is more difficult due to the much smaller amount of downstream [1‑13C]pyruvate, which impairs its quantification. This work demonstrates a narrow bandwidth excitation slice spectroscopy technique, which is simple to implement and effectively isolates the signal of [1‑13C]pyruvate from injected hyperpolarized [1‑13C]lactate in rat subcutaneous tumors. This allows more-reliable quantification than with broad bandwidth excitation, particularly for multi-frame measurements.Methods
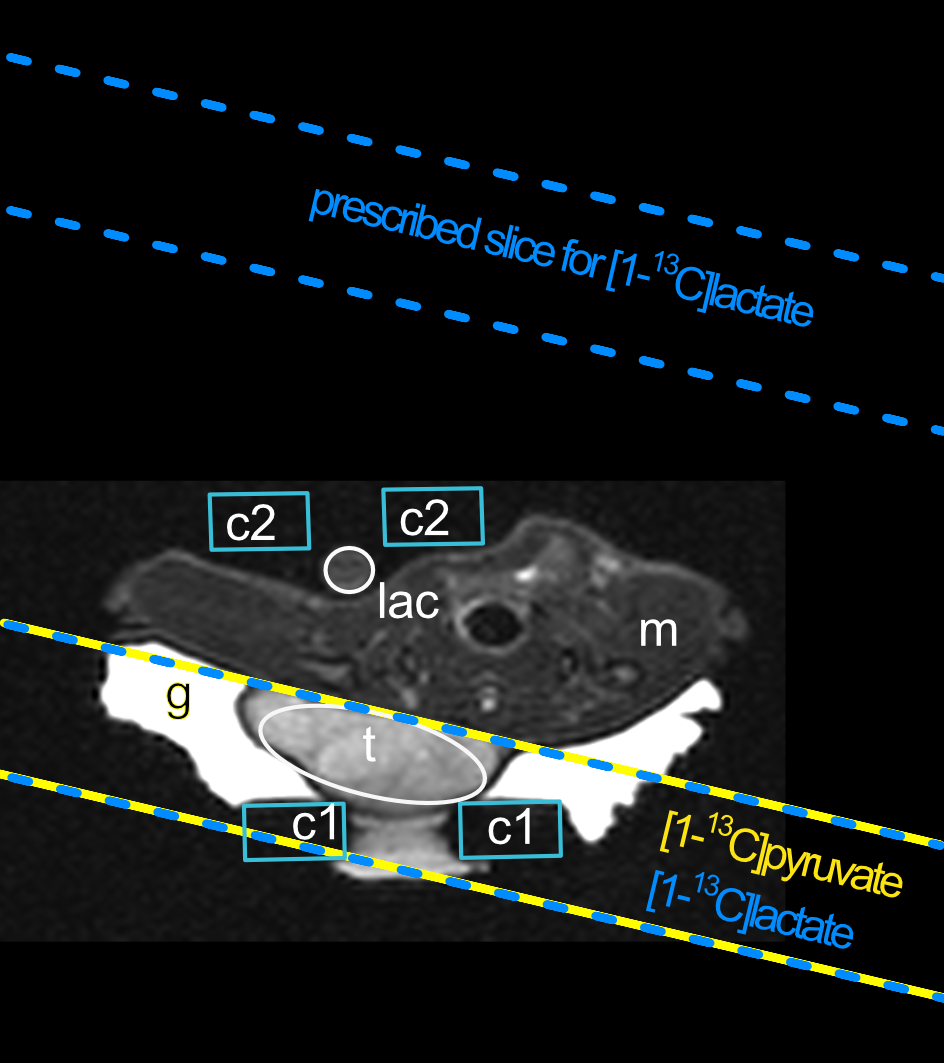
Slice spectroscopy was performed on rat subcutaneous tumors after injection of hyperpolarized [1‑13C]lactate.Tumor Model: Rats (2 male and 1 female, Crl:NIH-Foxn1rnu, Charles River) were implanted subcutaneously in the flank with 1∙107 PSN1 pancreatic cancer cells. Tumors grew to 10 mm before hyperpolarized measurements. Animals were anesthetized with isoflurane in O2 during imaging and spectroscopy.
Imaging System: Small animal 7 T preclinical scanner (Agilent/GE magnet, Bruker AVANCE III HD electronics) using a dual-tuned 1H/13C volume coil (inner diameter 72 mm, RAPID Biomedical) and surface receiver coils (20 mm diameter, RAPID Biomedical) placed on the tumors for 13C signal reception.
MR Proton Imaging and Calibrations: Anatomical proton images were acquired with T2-weighted RARE. B0-map based 2nd order shimming, followed by iterative shimming on PRESS voxels on the tumors was performed. PRESS voxels were also used for 1H frequency calibration that was adapted to set the 13C reference frequency for [1-13C]pyruvate.
Hyperpolarization: 3.1 M [1‑13C]sodium-lactate in 30% (v/v) DMSO and 70% ddH2O were polarized in a HyperSense DNP polarizer for 180 min.
Spectroscopy: FID spectroscopy was acquired with 512 points and TR 2 s from 15 mm thick slices that were prescribed on tumors. Broad bandwidth RF pulses (5 kHz) were centred between lactate and pyruvate. Narrow bandwidth RF pulses (250 Hz) alternated between metabolite frequencies[1] by prescribing spatially offset slices corresponding to the chemical shift offset[2] between [1‑13C]pyruvate and [1‑13C]lactate (Fig. 1).
Analysis: Broad bandwidth data were analyzed as magnitude or manually phased real spectra and with AMARES fitting in jMRUI[3,4] to several models with different numbers of free parameters for peak positions, amplitudes, widths, and phases. Narrow bandwidth data were analyzed as magnitude spectra to determine peak heights.
Results
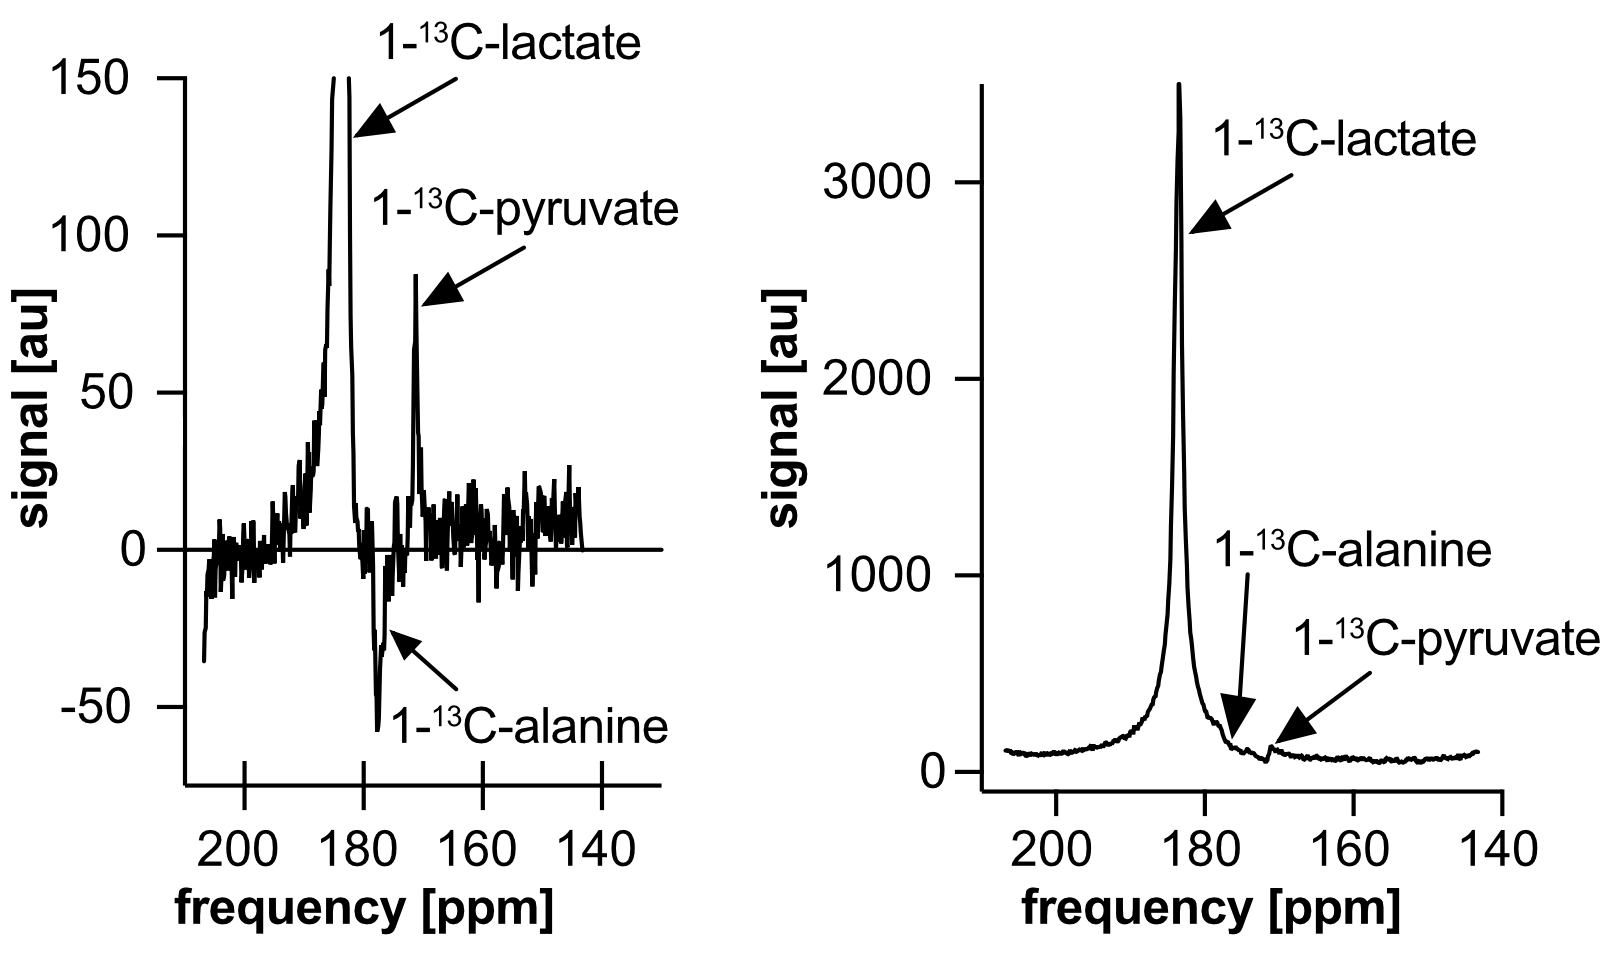
Slice spectroscopy spectra of tumors after hyperpolarized [1‑13C]lactate injection (Figs. 2 and 3) show strong [1‑13C]lactate and weak [1-13C]pyruvate signal.Quantification in broad bandwidth excitation data (Fig. 2) from magnitude spectra is impeded by the larger lactate peak’s tails overlapping the smaller pyruvate peak. Between the alanine and pyruvate centre frequencies, the metabolite signals interfere with each other, producing a lactate peak tail that is lower than the opposite-side tail at the same frequency offsets from the lactate peak centre. At the pyruvate peak frequency, the magnitude spectrum in Fig. 2 is higher than the opposite side of the lactate peak by approximately 3% of the real spectrum pyruvate peak amplitude.
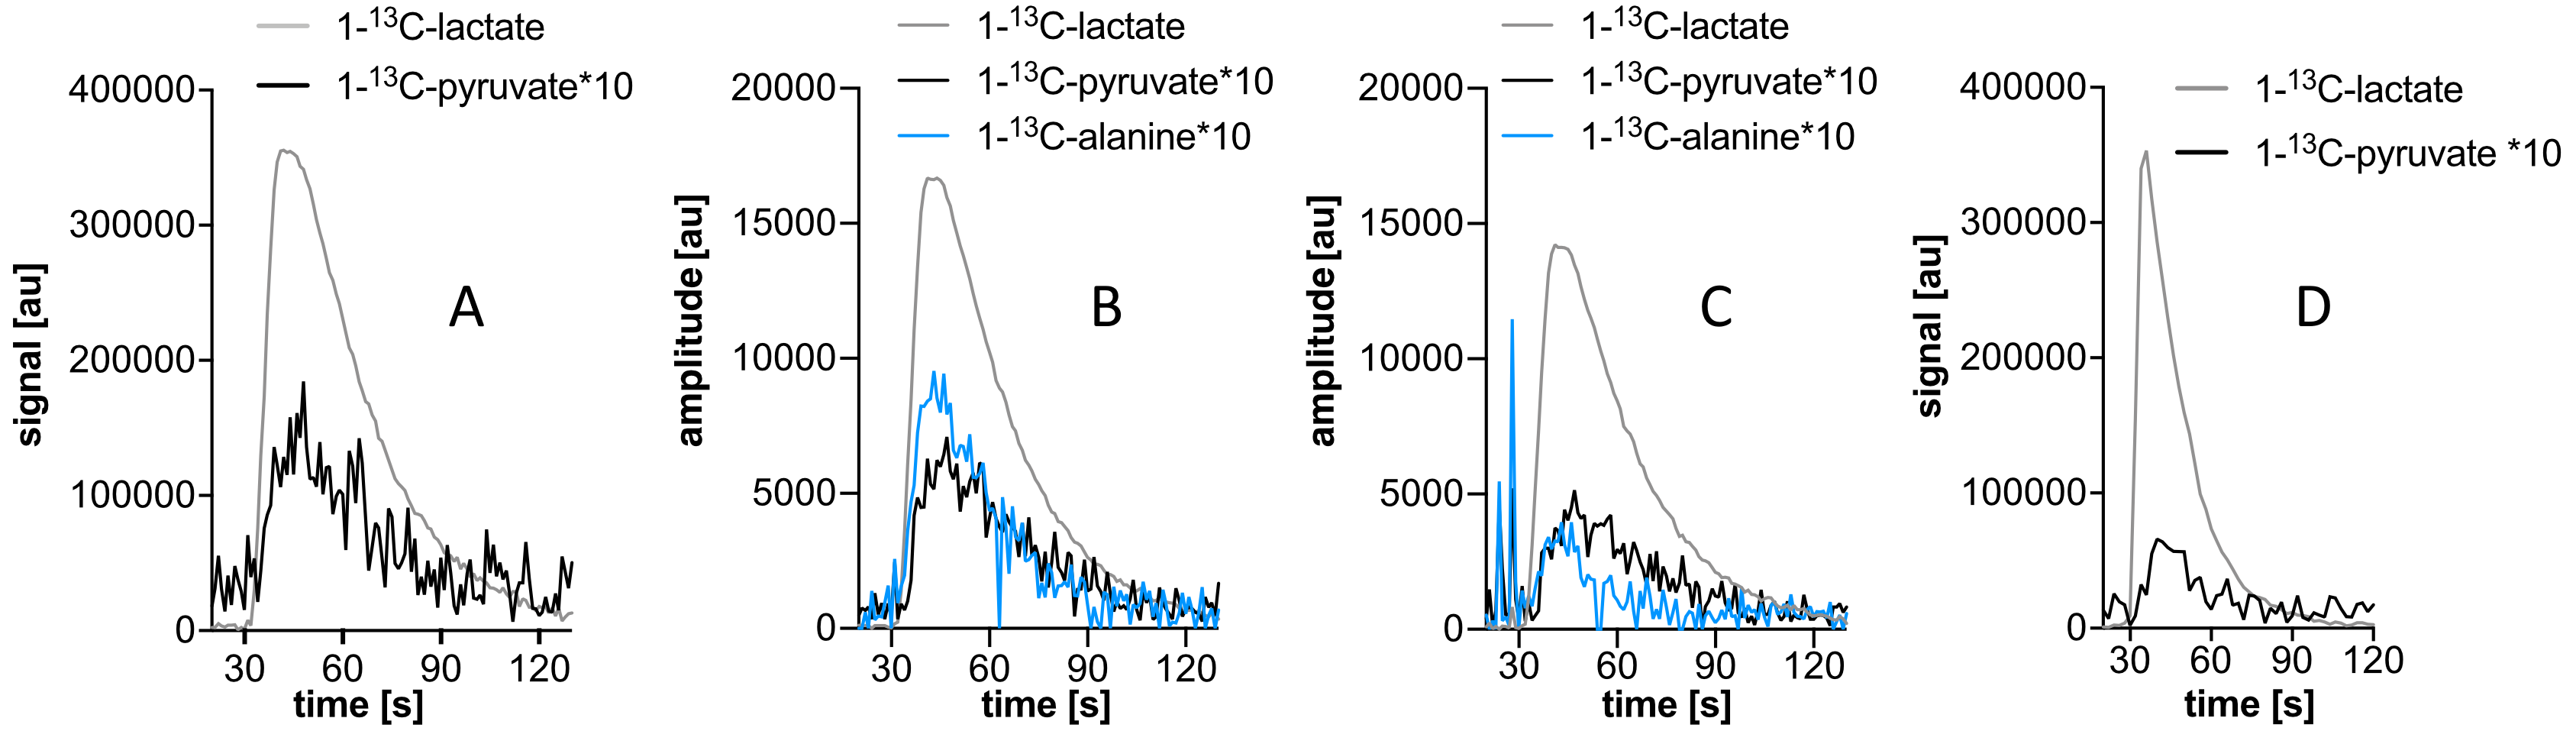
Phased real spectra have narrower peaks and thus less spectral overlap, but reliable manual or automatic phasing is difficult because small changes in phase parameters strongly affect the spectral background signal. AMARES fits to the spectra were inconsistent between acquisition frames (Fig. 4), particularly for models with more free parameters.
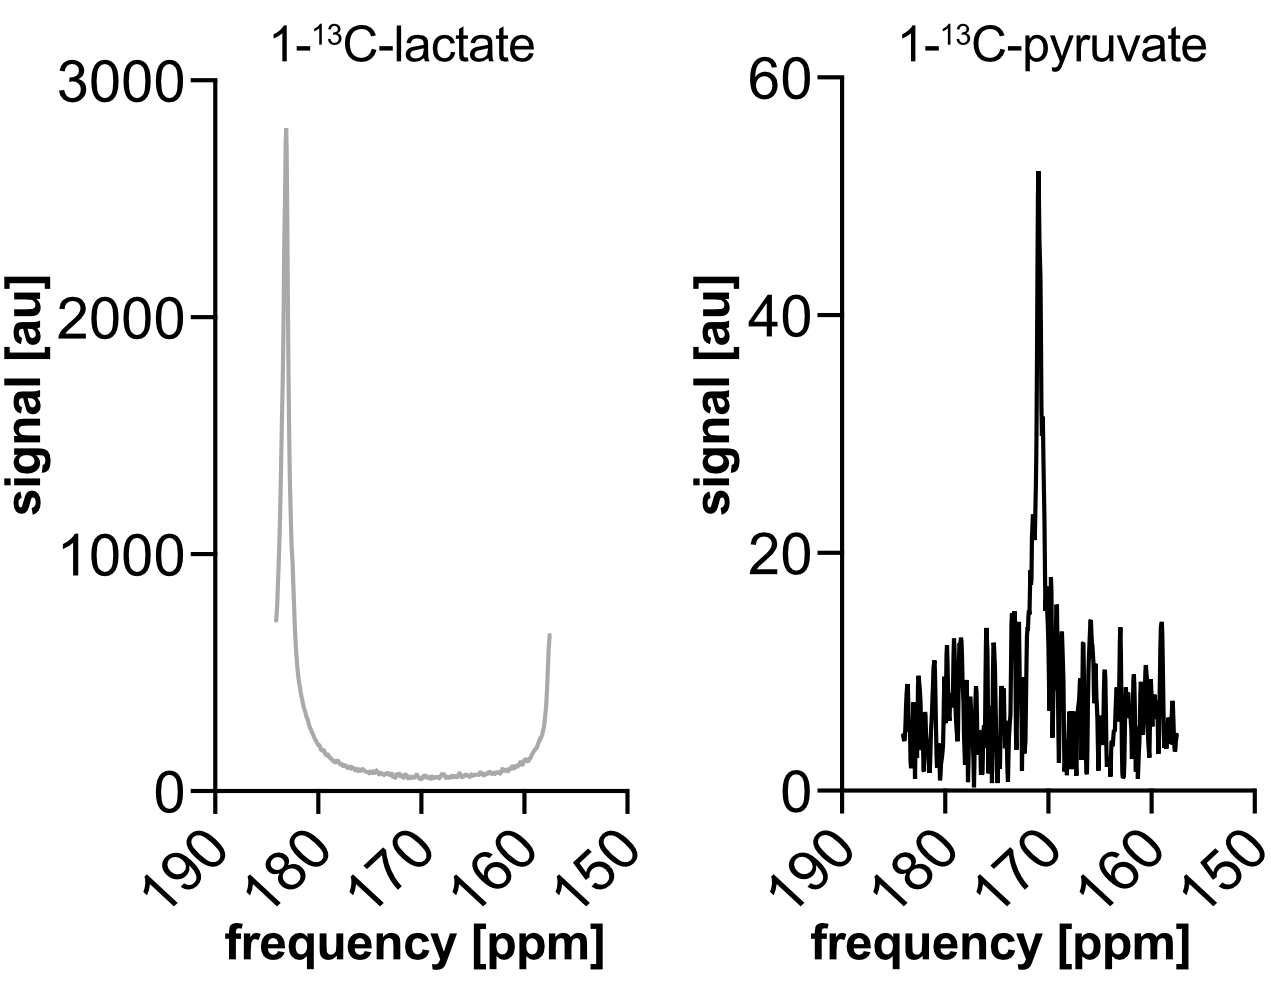
Quantification in narrow bandwidth excited data (Fig. 3) is much simpler, since the downstream pyruvate spectrum shows no contribution from the lactate.
Localized B0-map-based and iterative shimming on the tumor, and 1H‑derived local frequency adjusted applied to 13C excitation, gave better local frequency consistency than determining frequency from a remotely-placed 13C-labelled phantom.
Discussion
This work has several differences from previously-described alternating-frequency 13C methods[1,2]. Here, multi-frame spectroscopy is performed in subcutaneous tumors with hyperpolarized [1‑13C]lactate, rather than single-frame mouse kidney hyperpolarized [1-13C]pyruvate imaging[2] or multi-frame rat heart or liver [2‑13C]pyruvate imaging[1]. The wider frequency separation of [2‑13C]pyruvate and metabolites places different requirements on slice geometry and bandwidth to ensure signal isolation during excitation. The more-similar peak heights of [1‑13C]pyruvate and metabolites makes quantification simpler. Internal organs such as kidney and heart are better-perfused than subcutaneous tumors, and have fewer nearby air-tissue interfaces that affect shim quality. These effects together make quantification of hyperpolarized [1‑13C]lactate and its metabolite [1‑13C]pyruvate in subcutaneous tumors more difficult, even without spreading signal over k-space for imaging. These issues are addressed by the use of carbomer gel to mitigate body-surface shimming issues, narrower bandwidth RF pulses, and tumor-localized shimming and frequency calibration.Another alternative excitation scheme is spectral-spatial RF and gradient pulses, but these are not standard on most systems, whereas the frequency alternating excitations used here have been implemented with minimal modification of a slice-selective spectroscopy pulse sequence, by simply prescribing spatially offset slices at positions corresponding to metabolite chemical shift offsets.
Conclusion
The combination of narrow bandwidth excitation slice spectroscopy with localized frequency calibration in rat subcutaneous tumors allows reliable isolation of downstream [1‑13C]pyruvate signal from the large peak of injected hyperpolarized [1‑13C]lactate, simplifying data processing and improving quantification.Acknowledgements
This work was supported by the Deutsche Forschungsgemeinschaft (DFG, German Research Foundation – 391523415, SFB 824).
Sandra Sühnel, Elisabeth Bliemsrieder, and Irina Skuratovska assisted with the animal work and technical equipment.
References
1. Sonal Josan, Ralph Hurd, Jae Mo Park, Yi-Fen Yen, Ron Watkins, Adolf Pfefferbaum, Daniel Spielman, and Dirk Mayer (2014) Dynamic Metabolic Imaging of Hyperpolarized [2-13C]Pyruvate Using Spiral Chemical Shift Imaging with Alternating Spectral Band Excitation. Magnetic Resonance in Medicine 71: 2051–2058
2. Seungwook Yang, Joonsung Lee, Eunhae Joe, Hansol Lee, Young-Suk Choi, Jae Mo Park, Daniel Spielman, Ho-Taek Song, Dong-Hyun Kim (2016) Metabolite-selective hyperpolarized 13C imaging using extended chemical shift displacement at 9.4 T. Magnetic Resonance Imaging 34: 535–540
3. A. Naressi, C. Couturier, J.M. Devos, M. Janssen, C. Mangeat, R. de Beer, D. Graveron-Demilly (2001) Java-based graphical user interface for the MRUI quantitation. Magnetic Resonance Materials in Physics, Biology and Medicine 12: 141-152
4. D Stefan, F Di Cesare, A Andrasescu, E Popa, A Lazariev, E Vescovo, O Strbak, S Williams, Z Starcuk, M Cabanas, D van Ormondt and D Graveron-Demilly (2009) Quantitation of magnetic resonance spectroscopy signals: the jMRUI software package. Measurement Science and Technology 20
Figures