3796
Simulating the impact of asymmetric geometries on apparent alveolar septal wall thickness measurements with hyperpolarized xenon-129 MRI1University of Pennsylvania, Philadelphia, PA, United States
Synopsis
Measurement of the apparent alveolar septal wall thickness (SWT) via chemical shift saturation recovery (CSSR) with hyperpolarized xenon-129 is emerging as a robust and sensitive technique for detecting lung disease. However, the extracted pulmonary physiological values are obtained by fitting theoretical gas uptake curves that are based on assumptions of an unrealistically symmetric alveolar anatomy to the measurement data. In this work, we investigated the impact of asymmetric septal walls on the fitting parameters using numerically simulated CSSR measurement data. Our simulations predict potentially large errors in all fitting parameters other than the total septal wall thickness.
Purpose
Measurement of the apparent alveolar septal wall thickness (SWT) via chemical shift saturation recovery (CSSR) with hyperpolarized xenon-129 is emerging as a robust and sensitive technique for the detection of lung disease1-9, typically by saturating the magnetization of xenon dissolved in the lung parenchyma and subsequently monitoring its replenishment over time by gas exchange with the alveolar airspaces. The time-dependent recovery of the xenon dissolved-phase signal is fitted to a gas uptake model, and the associated fitting parameters, such as the apparent SWT, are interpreted as metrics of the underlying lung physiology. Likely the most realistic model to date, Model Of Xenon Exchange (MOXE), has been introduced by Chang et al.10,11 In MOXE, the alveolar wall is interpreted as a 1D geometric structure consisting of two equal-width barriers surrounding a central blood vessel. However, such an assumption is a suboptimal representation of alveolar anatomy, which would be more accurately described by blood vessels separated from the airspaces by a thin membrane (active side) on one side, and a thicker barrier (service side) on the other. It is known that in many cases interstitial pulmonary pathophysiology is concentrated within the service side, leaving the bulk of the gas exchange through the active side largely unaffected12. In this work, we used a 1D gas exchange simulation to investigate the consequences of fitting MOXE to hypothetical CSSR measurements for an asymmetric alveolar wall structure.Methods
A 1D numerical lung model was used to simulate xenon gas exchange between the tissue-plasma (TP), red blood cell (RBC), and alveolar gas-phase (GP) compartments comprising a single alveolus (Fig. 1). At the start of the simulation, 2.4 million xenon atoms were randomly distributed across the compartments in Fig. 1 such that 98% were in the (GP) and the remainder in the DP. Random diffusional motion was simulated at 0.3 μs time increments, with diffusion constants of 0.68 10-5 m2s-1 in the GP and 0.33 10-9 m2s-1 in the DP, respectively. To maintain the prescribed concentration ratio, the probability for entering the DP was set to 5.7%. Other parameters included: 1 s capillary transit time, 0.64 RBC fraction (equivalent to 39% hematocrit13), 200 μm alveolar diameter, 0.3 μm membrane thickness, 6 or 8 μm vessel diameter, 0.5 - 10 μm barrier thickness. To simulate an ideal CSSR experiment, the longitudinal magnetization for all DP atoms was set to zero at simulation start, and the subsequent regrowth of longitudinal magnetization in the DP due to gas exchange was tracked over 600 ms and fitted using MOXE.Results and Discussion
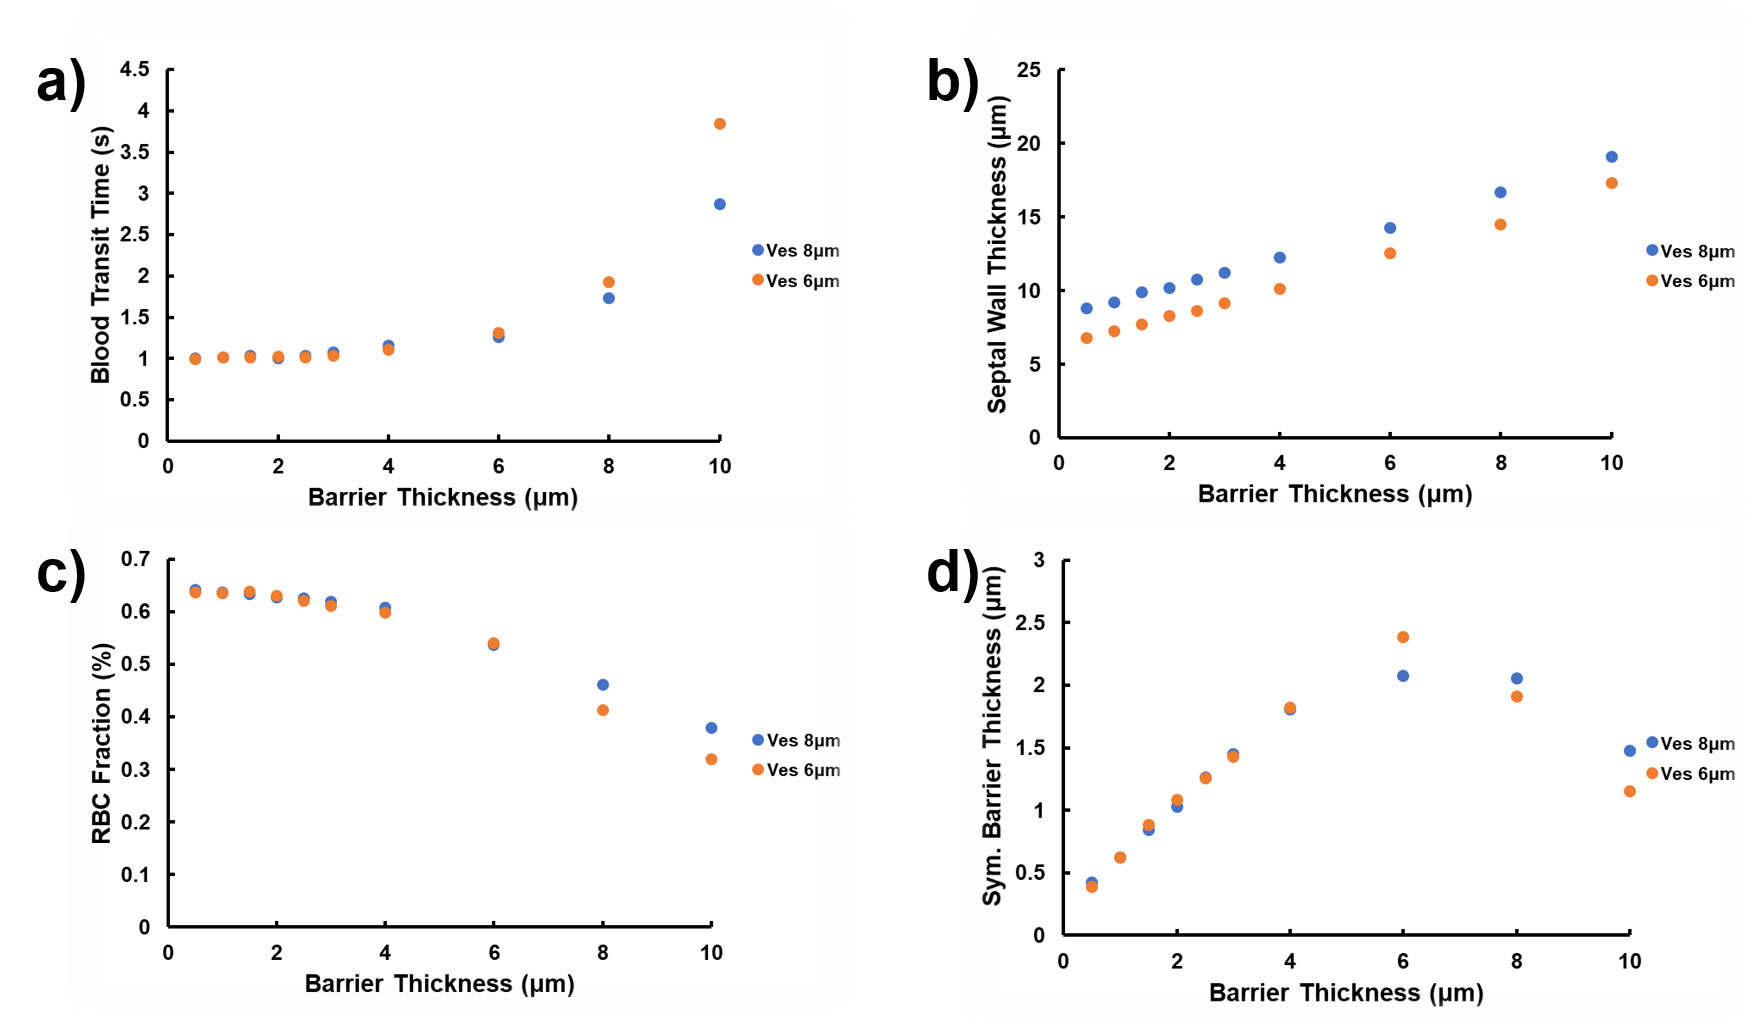
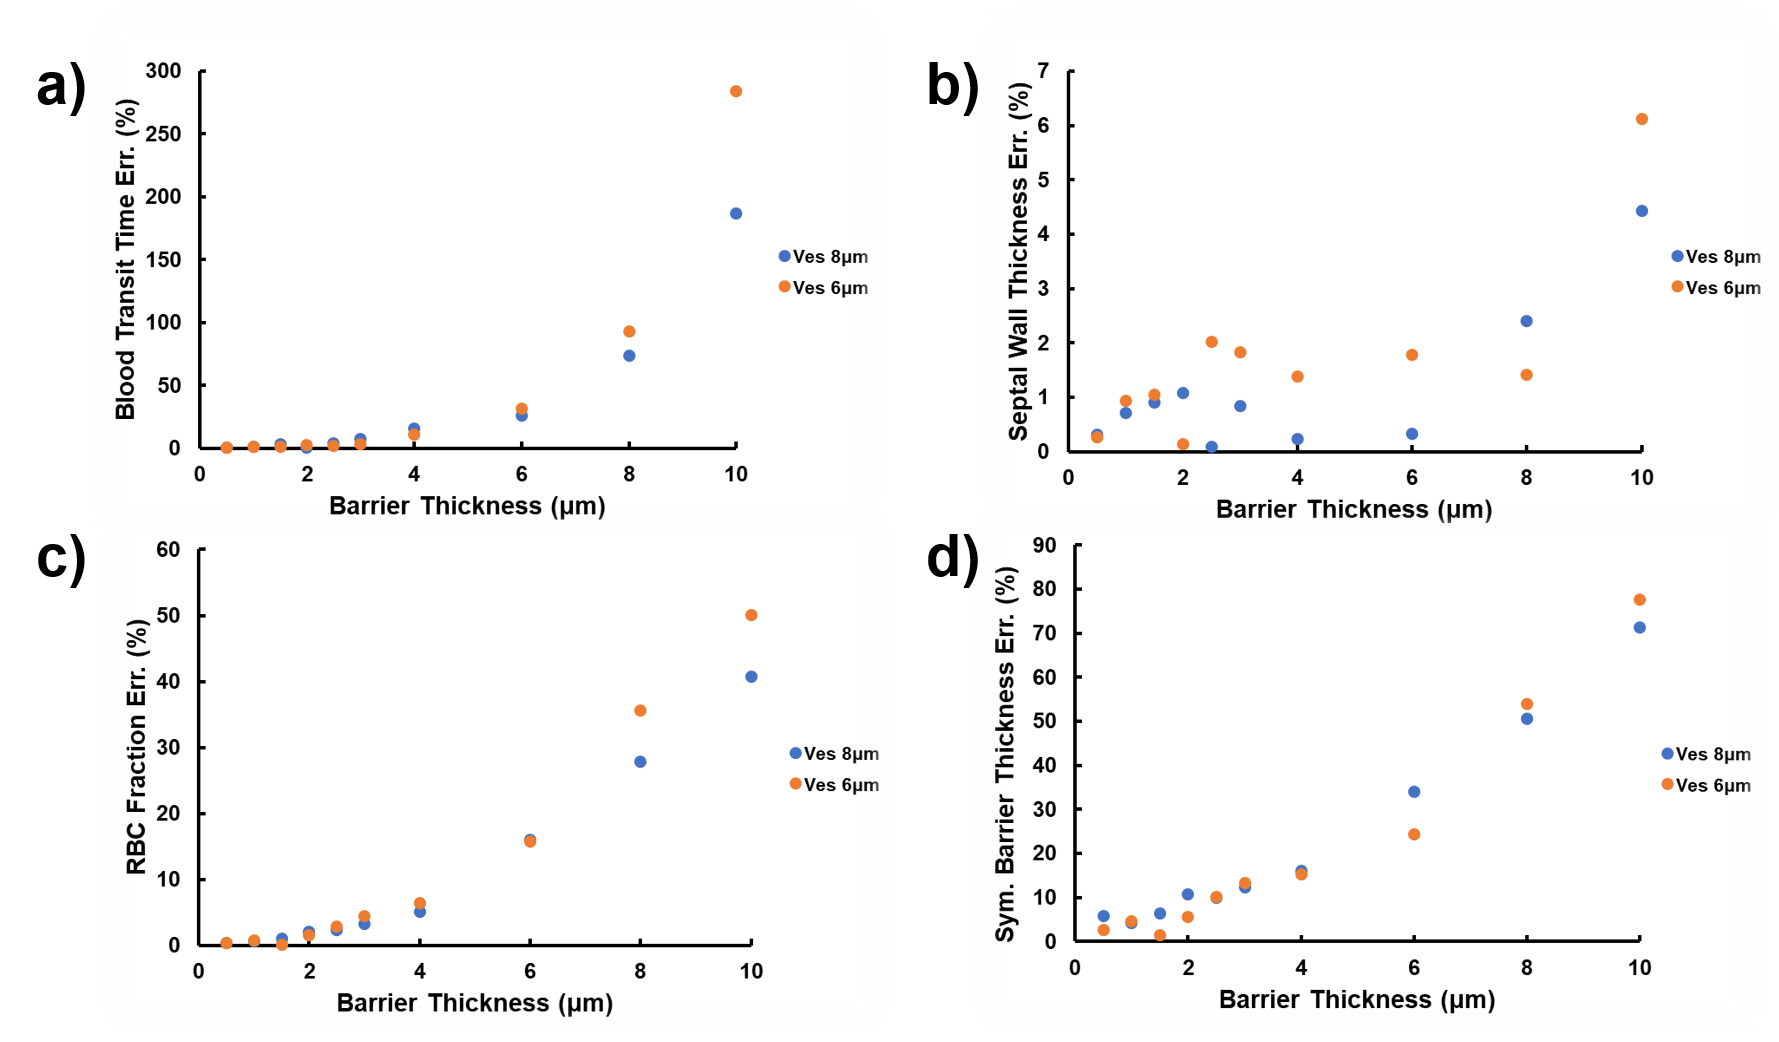
Figure 2 depicts the dependence of the MOXE fitting parameters blood transit time (Figure 2a), total SWT (Figure 2b), RBC fraction (Figure 2c), and symmetric barrier thickness (Figure 2d) on the simulated barrier thickness. The corresponding relative errors are shown in Figure 3. For thin simulated barriers, which could be considered the hallmark of healthy lungs, the associated low model asymmetry results in reasonably good MOXE fitting, and the fitting parameters track the simulation input parameters well. For both investigated vessel diameters, however, once the simulated barrier thicknesses exceeds about 4 μm, the arising discrepancies between the simulated signal shapes and those achievable by solutions to the analytical MOXE begin to push the fitting parameters further and further away from the simulated anatomy. While the relative error in the SWT remains small over the investigated parameter range, the errors in the other fitting parameters escalate rapidly. For instance, our simulations predict that MOXE fitting tends to assign surplus tissue to the blood plasma compartment, possibly resulting in the unphysiological hematocrits that have been observed by Chang et al. in healthy volunteers11 and especially by Stewart et al. in patients with interstitial lung disease.14Conclusion
Our simulation study predicts that fitting the analytical MOXE to a CSSR signal based on a more realistic, asymmetric alveolar anatomy still produces reliable results for the total alveolar SWT but can cause significant errors in all other fitting parameters, especially in cases of moderate to severe interstitial lung disease.Acknowledgements
No acknowledgement found.References
[1] Ruppert K et al. NMR of hyperpolarized 129Xe in the canine chest: spectral dynamics during a breath-hold. NMR Biomed 2000;13:220-228.
[2] Butler JP et al. Measuring surface-area-to-volume ratios in soft porous materials using laser-polarized xenon interphase exchange nuclear magnetic resonance. J Phys Condens Matter 2002;14:L297-L304.
[3] Qing et al. Assessment of lung function in asthma and COPD using hyperpolarized 129Xe chemical shift saturation recovery spectroscopy and dissolved-phase MRI. NMR in Biomed 2014;27(12):1490-1501.
[4] Zhong et al. Simultaneous assessment of both lung morphometry and gas exchange function within a single breath‐hold by hyperpolarized 129Xe MRI. NMR in Biomed 2017; 30(8).
[5] Doganay et al. Quantification of regional early stage gas exchange changes using hyperpolarized 129Xe MRI in a rat model of radiation-induced lung injury. Med Phys 2016;43(5):2410-2420.
[6] Kern et al. Regional investigation of lung function and microstructure 129Xe chemical shift saturation recovery parameters by localized and dissolved‐phase imaging: A reproducibility study. MRM 2019; 81(1):13-24.
[7] Ruppert et al. Using Hyperpolarized Xenon-129 MRI to Quantify Early-Stage Lung Disease in Smokers. Acad Radiol 2019; 26(3):355-366.
[8] Kern et al. Mapping of regional lung microstructural parameters using 129 Xe dissolved‐phase MRI in healthy volunteers hyperpolarized and patients with chronic obstructive pulmonary disease. MRM 2018; 81(4):2360-2373.
[9] Zanette et al. Physiological gas exchange mapping of hyperpolarized 129Xe using spiral-IDEAL and MOXE in a model of regional radiation-induced lung injury. Med Phys 2018;45(2):803-816.
[10] Chang. MOXE: a model of gas exchange for hyperpolarized 129Xe magnetic resonance of the lung. Magn Reson Med 2013;69(3):884-890.
[11] Chang et al. Quantification of human lung structure and physiology using hyperpolarized 129Xe. Magn Reson Med 2014;71(1):339-344.
[12] Lumb AB. Nunn’s Applied Respiratory Physiology. New York: Elsevier; 2017.
[13] Norquay et al. Relaxation and Exchange Dynamics of Hyperpolarized 129Xe in Human Blood. MRM 2015;74:303-311.
[14] Stewart et al. Experimental validation of the hyperpolarized 129Xe chemical shift saturation recovery technique in healthy volunteers and subjects with interstitial lung disease.
Figures