3794
A Comparison of Multi-breath Wash-in/Wash-out and RF-Contrast Hyperpolarized 129Xe Imaging Schemes for Quantifying Fractional Ventilation1University of Pennsylvania, Philadelphia, PA, United States, 2Radiology, University of Pennsylvania, Philadelphia, PA, United States
Synopsis
Fractional ventilation, a metric denoting per-breath pulmonary gas replacement, has been shown to be sensitive to disease-induced alterations in ventilation in diseases such as emphysema. We have developed two discrete techniques for measuring FV using hyperpolarized 129Xe MR imaging and demonstrated their acquisition in a rat. Although the two techniques yield different FV maps, these two techniques offer both a quick and cost-effective method and a longer, robust method for probing pulmonary ventilation.
Introduction
Hyperpolarized 129Xe (HXe) MRI-derived lung function metrics are sensitive to disease-related alterations. Fractional ventilation (FV), a measure of per-breath pulmonary gas replacement, has been used to assess disease-related ventilation impairment in animal models of lung cancer [1] and bleomycin-induced fibrosis [2], as well as in human COPD patients [3]. While traditional imaging schemes for measuring FV have used signal build-up and decay over multiple wash-in/wash-out breaths to derive FV, an alternative, continuous HXe breathing scheme in which images are acquired at various flip-angles offers a slightly more cost-effective method for measuring FV, and avoids any potential biases induced by changes in airway resistance when switching to and from gas mixtures of differing densities [4]. Here, we demonstrate two discrete imaging/breathing schemes for measuring FV in a healthy rat using natural abundance HXe.Methods
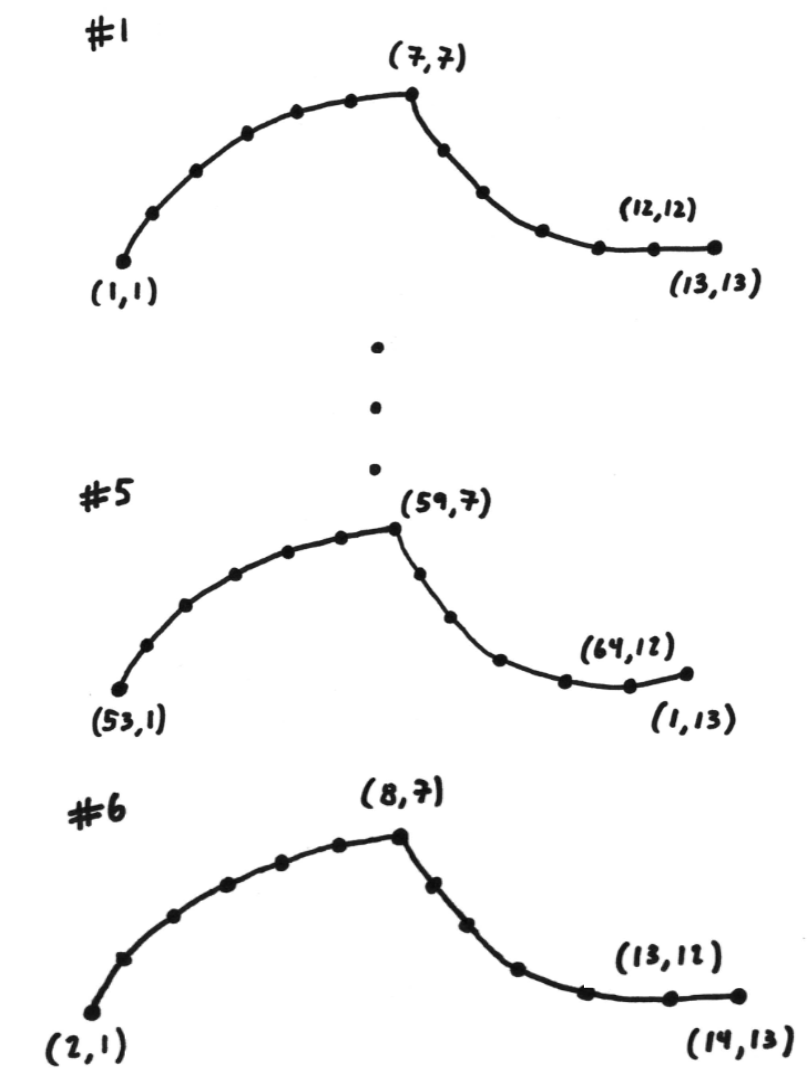
One healthy, male Sprague-Dawley rat (310g) was anesthetized using a ketamine/xylazine anesthetic cocktail, intubated using a 16-gauge catheter, ventilated using either air (30% O2, 70% N2) or a HXe gas mixture (30% O2, 70% N2) at 10 ml/kg, and imaged in a horizontal-bore 3T animal research magnet (BioSpec 3T, Bruker Inc.) Natural-abundance xenon was polarized using a commercial optical pumping system (Xebox E10 Xemed, LLC). Respiratory-gated gradient echo (GRE) images were acquired by encoding one k-space line per breath. For images acquired using the wash-in/wash-out breathing scheme, the number of breaths was specifically chosen to enable acquisition of each k-space line once for each wash-in/wash-out breath; we chose 13 breaths (7 wash-in, 6 wash-out), allowing us to acquire entire images at each point in the breathing cycle while making use of each breath. Images acquired using the continuous HXe breathing scheme used a much simpler approach: one k-space line was acquired per breath for 64 total breaths before varying the flip-angle for each successive image. All images used the same parameters (MS = 64×64, FOV = 40mm×40mm, three 8.0mm slices) except for the flip-angle (FA = 6° for wash-in/wash-out images, FA = 15°, 30°, 45°, 90° for continuous HXe images). Images acquired using the wash-in/wash-out scheme were fit to a theoretical model of signal build-up/decay to derive FV, while images acquired using the continuous HXe breathing scheme were divided by images acquired at FA = 90° and fit to a theoretical model of gas replacement as described in [1].Results
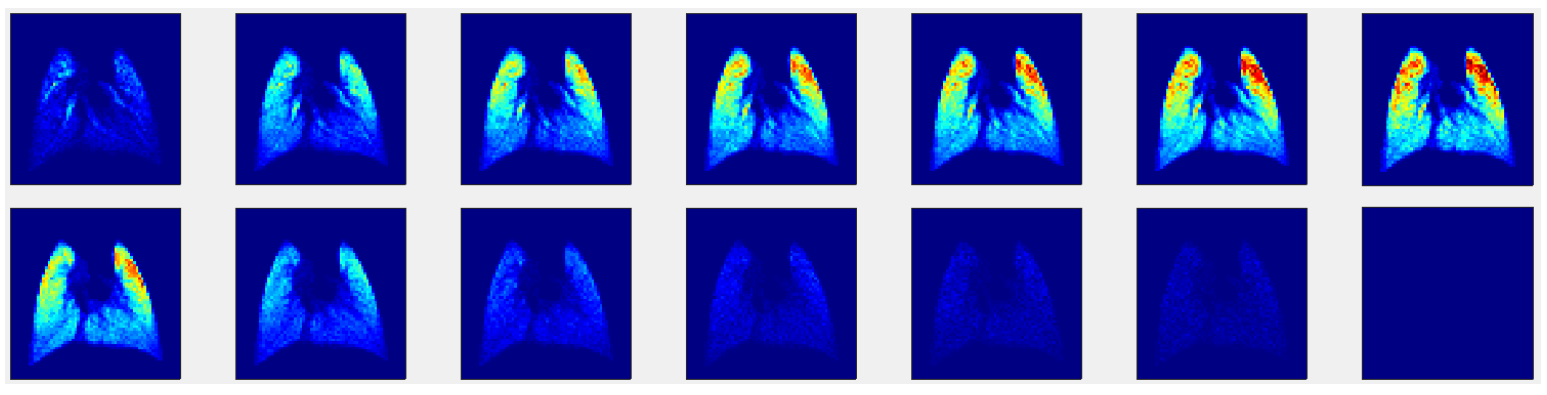
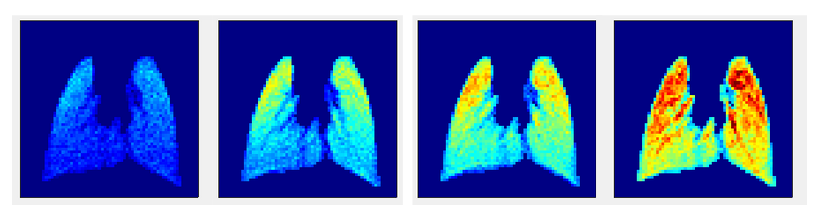
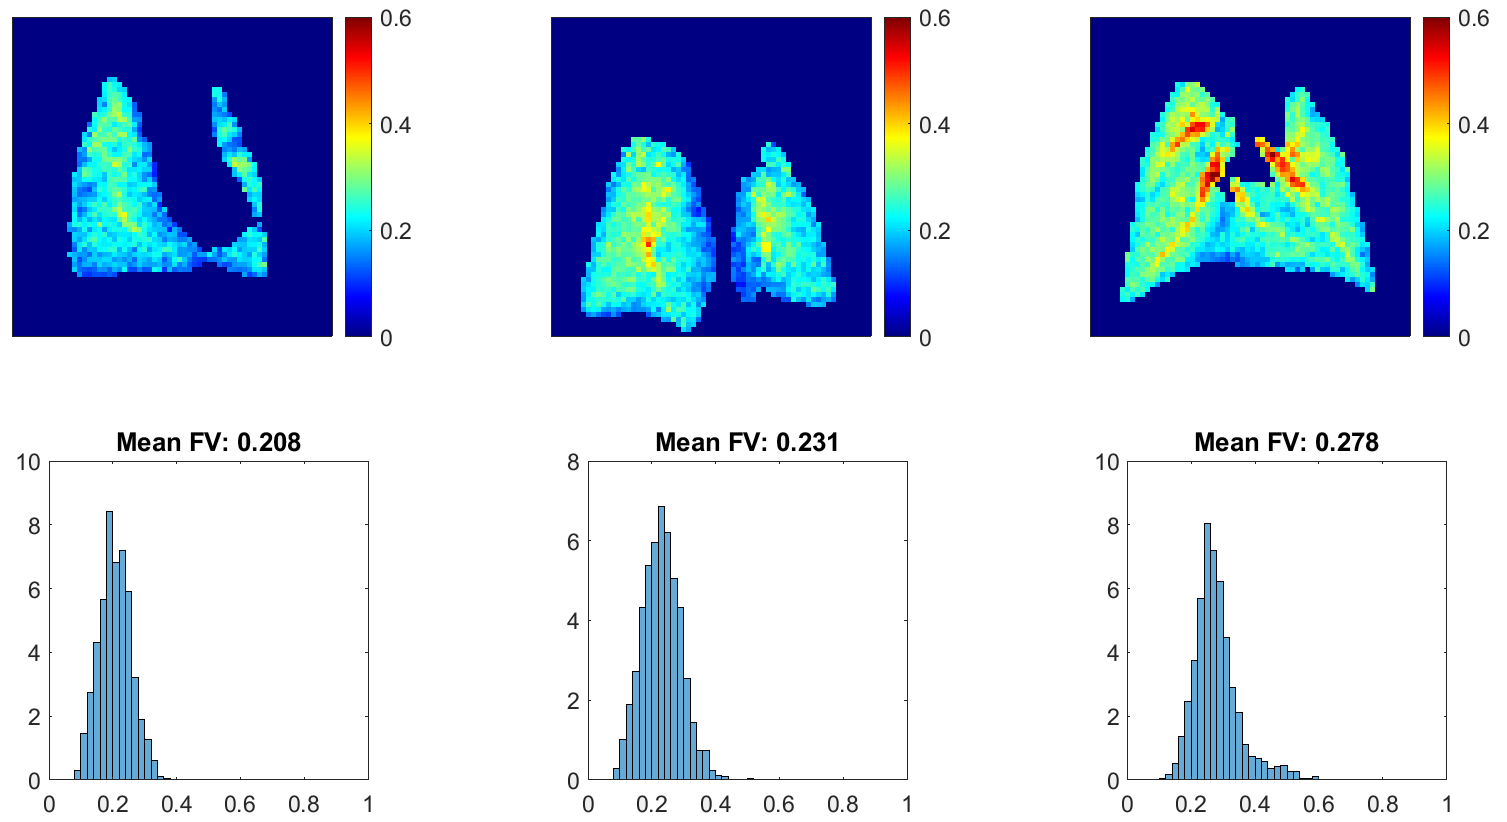
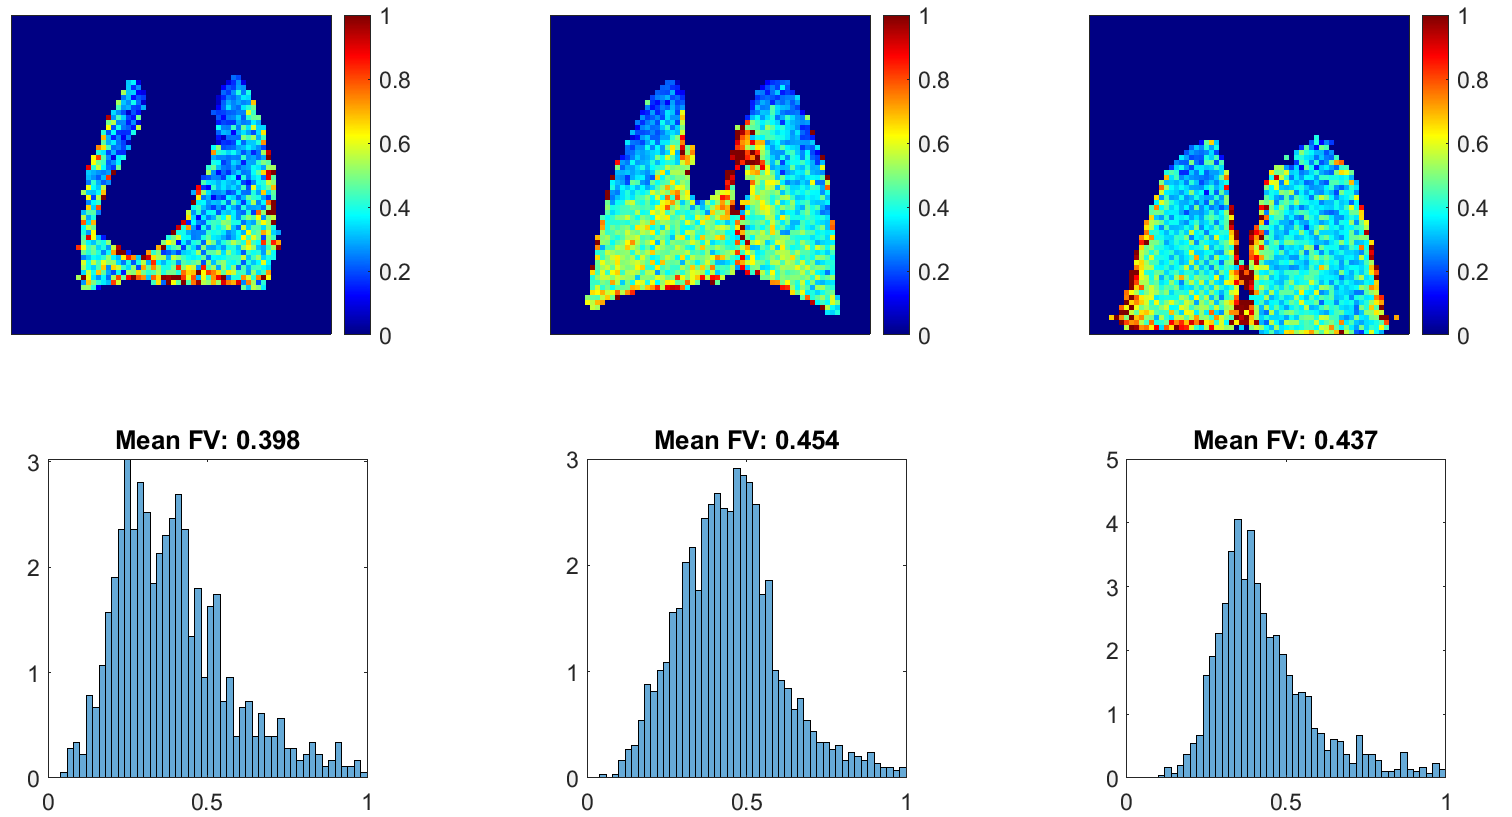
Figure 2 shows the 13 GRE images acquired during the wash-in/wash-out sequence. The signal builds-up during the initial 7 HXe wash-in breaths, as expected; notably, however, the apex of the lungs fills quite quickly. During the remaining wash-out breaths, signal decays as expected. Figure 3 shows GRE images acquired at various flip-angles (15°, 30°, 45°, 90°); as the images were acquired during a continuous delivery of HXe gas, high signal intensity can be seen throughout the lung, which also scales with the flip-angle.Figure 4 shows FV maps derived from the wash-in/wash-out acquisition scheme; a homogeneous distribution of values is seen throughout all three lung slices, with elevated FV coinciding with the large airways. The histogram of all three slices shows a fairly narrow and semi-symmetrical distribution as well, in agreement with the maps. The distribution of FV values is centered at approximately 0.23, with the mean FV between all slices at ~0.24. Figure 5 shows FV maps derived from the continuous HXe breathing scheme; a noticeably lower FV is seen in the apex of the lung of all three slices, while a moderate-to-high FV is seen throughout the rest of the lung. Most noticeable is the higher mean FV when compared to that of Figure 4, which hovers around 0.39 to 0.45.Discussion
We have investigated two methods for acquiring FV, which produced maps yielding surprisingly different results. Among possible factors contributing to these differences are the well-documented changes in airway resistance and onset of the convection-diffusion front when gases of differing densities are introduced to the lung [4]. Dead volume within the ventilator set-up may also play a role in the differences between the FV maps, as the wash-in/wash-out FV maps rely heavily on the switch from HXe to air during implementation of the breathing scheme. Furthermore, while the RF-contrast FV maps can be derived using as few as two images at different flip-angles [1], wash-in/wash-out imaging uses substantially more HXe (64×2 breaths using the continuous HXe scheme vs 64×13 breaths with the wash-in/wash-out sequence). However, the wash-in/wash-out maps also produce more images that have been previously shown to highlight the presence of ‘slow-filling’ regions seen in diseases such as COPD. While qualitative rather than quantitative, the 13 wash-in/wash-out images are potentially useful for identifying this behavior in pulmonary diseases whereas the RF-contrast method cannot.Conclusion
Here we demonstrated two imaging/breathing techniques for deriving FV in a rat using natural abundance HXe. Further studies using wash-out gas mixtures of both higher and lower density, as well as non-polarized xenon wash-out breaths, are needed to elucidate the precise mechanisms contributing to the differences in mean FV derived with these methods. Moreover, the comparison of these two techniques in cases of pulmonary disease, such as emphysema, are of interest for assessing the utility of wash-in/wash-out HXe images with respect to FV images.Acknowledgements
No acknowledgement found.References
[1] Loza, L.A., Kadlecek, S.J., Pourfathi, M., Hamedani, H., Duncan, I.F., Ruppert, K. and Rizi, R.R., 2019. Quantification of Ventilation and Gas Uptake in Free-Breathing Mice With Hyperpolarized 129 Xe MRI. IEEE transactions on medical imaging, 38(9), pp.2081-2091.
[2] Stephen, M.J., Emami, K., Woodburn, J.M., Chia, E., Kadlecek, S., Zhu, J., Pickup, S., Ishii, M., Rizi, R.R. and Rossman, M., 2010. Quantitative assessment of lung ventilation and microstructure in an animal model of idiopathic pulmonary fibrosis using hyperpolarized gas MRI. Academic radiology, 17(11), pp.1433-1443.
[3] Hamedani, H., Clapp, J.T., Kadlecek, S.J., Emami, K., Ishii, M., Gefter, W.B., Xin, Y., Cereda, M., Shaghaghi, H., Siddiqui, S. and Rossman, M.D., 2016. Regional fractional ventilation by using multibreath wash-in 3He MR imaging. Radiology, 279(3), pp.917-924.
[4] Crawford, A.B., Makowska, M., Paiva,
M. and Engel, L.A., 1985. Convection-and diffusion-dependent ventilation
maldistribution in normal subjects. Journal of Applied Physiology, 59(3), pp.838-846.
Figures