3792
Within-session Repeatability of Pulmonary 129Xe Static and Dynamic Spectroscopy
Elianna Ada Bier1, David G Mummy2, Junlan Lu3, and Bastiaan Driehuys2
1Biomedical Engineering, Duke University, Durham, NC, United States, 2Radiology, Duke University, Durham, NC, United States, 3Medical Physics Graduate Program, Duke University, Durham, NC, United States
1Biomedical Engineering, Duke University, Durham, NC, United States, 2Radiology, Duke University, Durham, NC, United States, 3Medical Physics Graduate Program, Duke University, Durham, NC, United States
Synopsis
129Xe MRS has the potential to detect and characterize cardiopulmonary disease; however, clinical use demands a better understanding of the repeatability of these measurements. We studied the within-session repeatability of 129Xe MR static and dynamic spectroscopy of 117 pairs of scans with matched heart rates and adequate quality in both scans. Repeatability of each spectroscopic measurement was quantified using the coefficient of repeatability (CR), coefficient of variation (CV), and the intraclass correlation coefficient (ICC). All measurements had very little bias between the two scans and significant ICCs. The CRs for RBC:barrier and RBC amplitude oscillation were 0.07 and 4.2%, respectively.
Purpose
129Xe MR spectroscopy provides a direct measurement of the pulmonary and pulmonary capillary environment. As 129Xe diffuses from airspaces into the capillaries it exhibits distinct chemical shifts corresponding to three gas exchange compartments: gas, barrier tissue, and red blood cells (RBCs). The RBC:barrier ratio is a clear marker of gas exchange efficiency, while the RBC chemical shift appears sensitive to capillary blood oxygenation. Additionally, variations of the RBC spectral parameters with the cardiac cycle have demonstrated the ability to differentiate between pre- and postcapillary pulmonary hypertension (PH)[1]. Thus, an increasing array of static and dynamic 129Xe spectroscopic parameters have the potential to play an integral role in the detection and characterization of various cardiopulmonary diseases. However, use of these parameters for clinical decision making and monitoring requires developing a better understanding of their repeatability. In this study we address this gap by reporting on the intra-session repeatability 129Xe static and dynamic spectroscopic parameters.Methods
Paired sets of 129Xe MRS scans were acquired on total of 155 subjects with a range of cardiopulmonary disorders. Subjects underwent two separate 129Xe dynamic spectroscopy scans during a single 129Xe study. From FRC subjects inhaled a 500-1000mL volume containing ~70 mL dose equivalent of hyperpolarized 129Xe and held their breath. During this breath hold, 129Xe free induction decays (FIDs) were acquired every 15 or 20 ms at the dissolved-phase 129Xe frequency (TE=0.45ms, flip angle≈20°, dwell time=20µs, 512 points, 500-800 FIDs).The first 100 FIDs were discarded to ensure steady-state 129Xe magnetization was confined to the pulmonary gas exchange regions. FIDs 100-150 were averaged together create a high SNR static spectrum before time domain fitting to a model with 1 Voigt lineshape (barrier) and 2 Lorentzian (RBC and gas) peaks. The static spectroscopy parameters quantified were RBC:barrier ratio, RBC chemical shift, RBC spectral width (FWHM), RBC phase (°, relative to barrier), barrier chemical shift, and 2 barrier spectral width parameters (FWHML and FWHMG). For dynamic spectroscopy, all FIDs after the first 100 were fit in the time domain to the barrier Voigt model. Dynamic oscillations in the RBC signal amplitude, chemical shift, and phase were quantified by their peak-to-peak amplitudes after detrending[2].
Scans were excluded from repeatability analysis if the absolute difference in heart rate (HR) between scans was above 15 bpm (19 subjects excluded), if either static RBC SNR was below 6 (14 additional subjects excluded), or if either RBC amplitude oscillation R-square (goodness-of-fit parameter) was below 0.2 (5 additional subjects excluded). All statistical analysis was performed using the 117 subjects in the filtered data set. Repeatability was visualized using Bland-Altman plots. Intra-scan repeatability was quantified using the, coefficient of repeatability (CR), coefficient of variation (CV), and the intraclass correlation coefficient (ICC), defined as follows: $${CR= 1.96\times SD(scan_1-scan_2)}$$ $${CV=\frac{SD(scan_1-scan_2)}{mean(scan_1-scan_2)}}$$ $${ICC= \frac{MS_{subj}-MS_{error}}{MS_{subj} + MS_{error}} \approx \frac{ (SD\_subject's\_ true\_values)^2}{(SD\_subject's\_true\_values)^2 + (SD\_measurement\_error)^2} }$$ where MS is the mean square from an analysis of variance (ANOVA).
Results
The exclusion process is visualized in Figure 2, which depicts the relationship between the exclusion criteria and the repeatability of the RBC amplitude oscillations and RBC:barrier for all subjects. Figure 3 provides a table of all repeatability metrics calculated from this study. The repeatability of the static spectroscopic measurements is shown in Figure 4.None of the measurements had a significant bias indicating that there is no difference in spectroscopic measurements taken at the beginning or end of MRS session. In the static parameters, RBC:barrier ratio had the highest ICC of 0.97 with CR=0.7.
The Bland-Altman plots of the RBC dynamic parameters are shown in Figure 5. Again, none of the measurements had significant bias. The RBC amplitude oscillations had CR=4.2% was more reproducible than either the chemical shift or phase oscillations, showing ICCs of 0.88, 0.64, and 0.73, respectively.
Discussion
These results indicate that 129Xe static spectroscopy is very repeatable with all ICCs, except barrier chemical shift, at or above 0.90, and that dynamic spectroscopy is moderately repeatable. The higher repeatability in static spectroscopy is expected because the time-dimension is removed during FID averaging which creates a much higher SNR data set. This suggests that even if a subject does not have adequate SNR for a repeatable dynamic scan, there may be enough signal to reliably calculate static spectral parameters.The repeatability of these measurements can be greatly affected by a change in in physiology. To reduce variation due to change in cardiac output, which could change RBC amplitude oscillation, we limited analysis to subjects that had similar HRs across both scans. However, there is a known dependence of RBC:barrier ratio on lung inflation level[3] and unfortunately, spectroscopy cannot measure lung inflation. In the future it may be possible to use 129Xe oscillation imaging[4] to correct the global RBC amplitude oscillations for a change in lung inflation volume. Another potential source of physiological variation could be subjects inadvertently performing either a Muller or Valsalva maneuver and introducing a change in intrapleural pressures that could affect both static and dynamic spectral parameters.
Ultimately, this repeatability study for 129Xe MRS measurements helps quantify meaningful variations in spectroscopy metrics and is an important step forward in moving 129Xe MRS into the clinical setting.
Acknowledgements
2R01HL105643-06, R01HL126771, R01HL126771, GenentechReferences
- Wang, Z., et al., Diverse cardiopulmonary diseases are associated with distinct xenon magnetic resonance imaging signatures. European Respiratory Journal, 2019. 54(6).
- Bier, E.A., et al., A protocol for quantifying cardiogenic oscillations in dynamic 129Xe gas exchange spectroscopy: The effects of idiopathic pulmonary fibrosis. NMR in Biomedicine, 2019. 32(1): p. e4029.
- Hahn, A.D., et al., Repeatability of regional pulmonary functional metrics of Hyperpolarized 129Xe dissolved‐phase MRI. Journal of Magnetic Resonance Imaging, 2019. 50(4): p. 1182-1190.
- Niedbalski, P.J., et al., Mapping cardiopulmonary dynamics within the microvasculature of the lungs using dissolved 129Xe MRI. Journal of Applied Physiology, 2020. 129(2): p. 218-229.
Figures
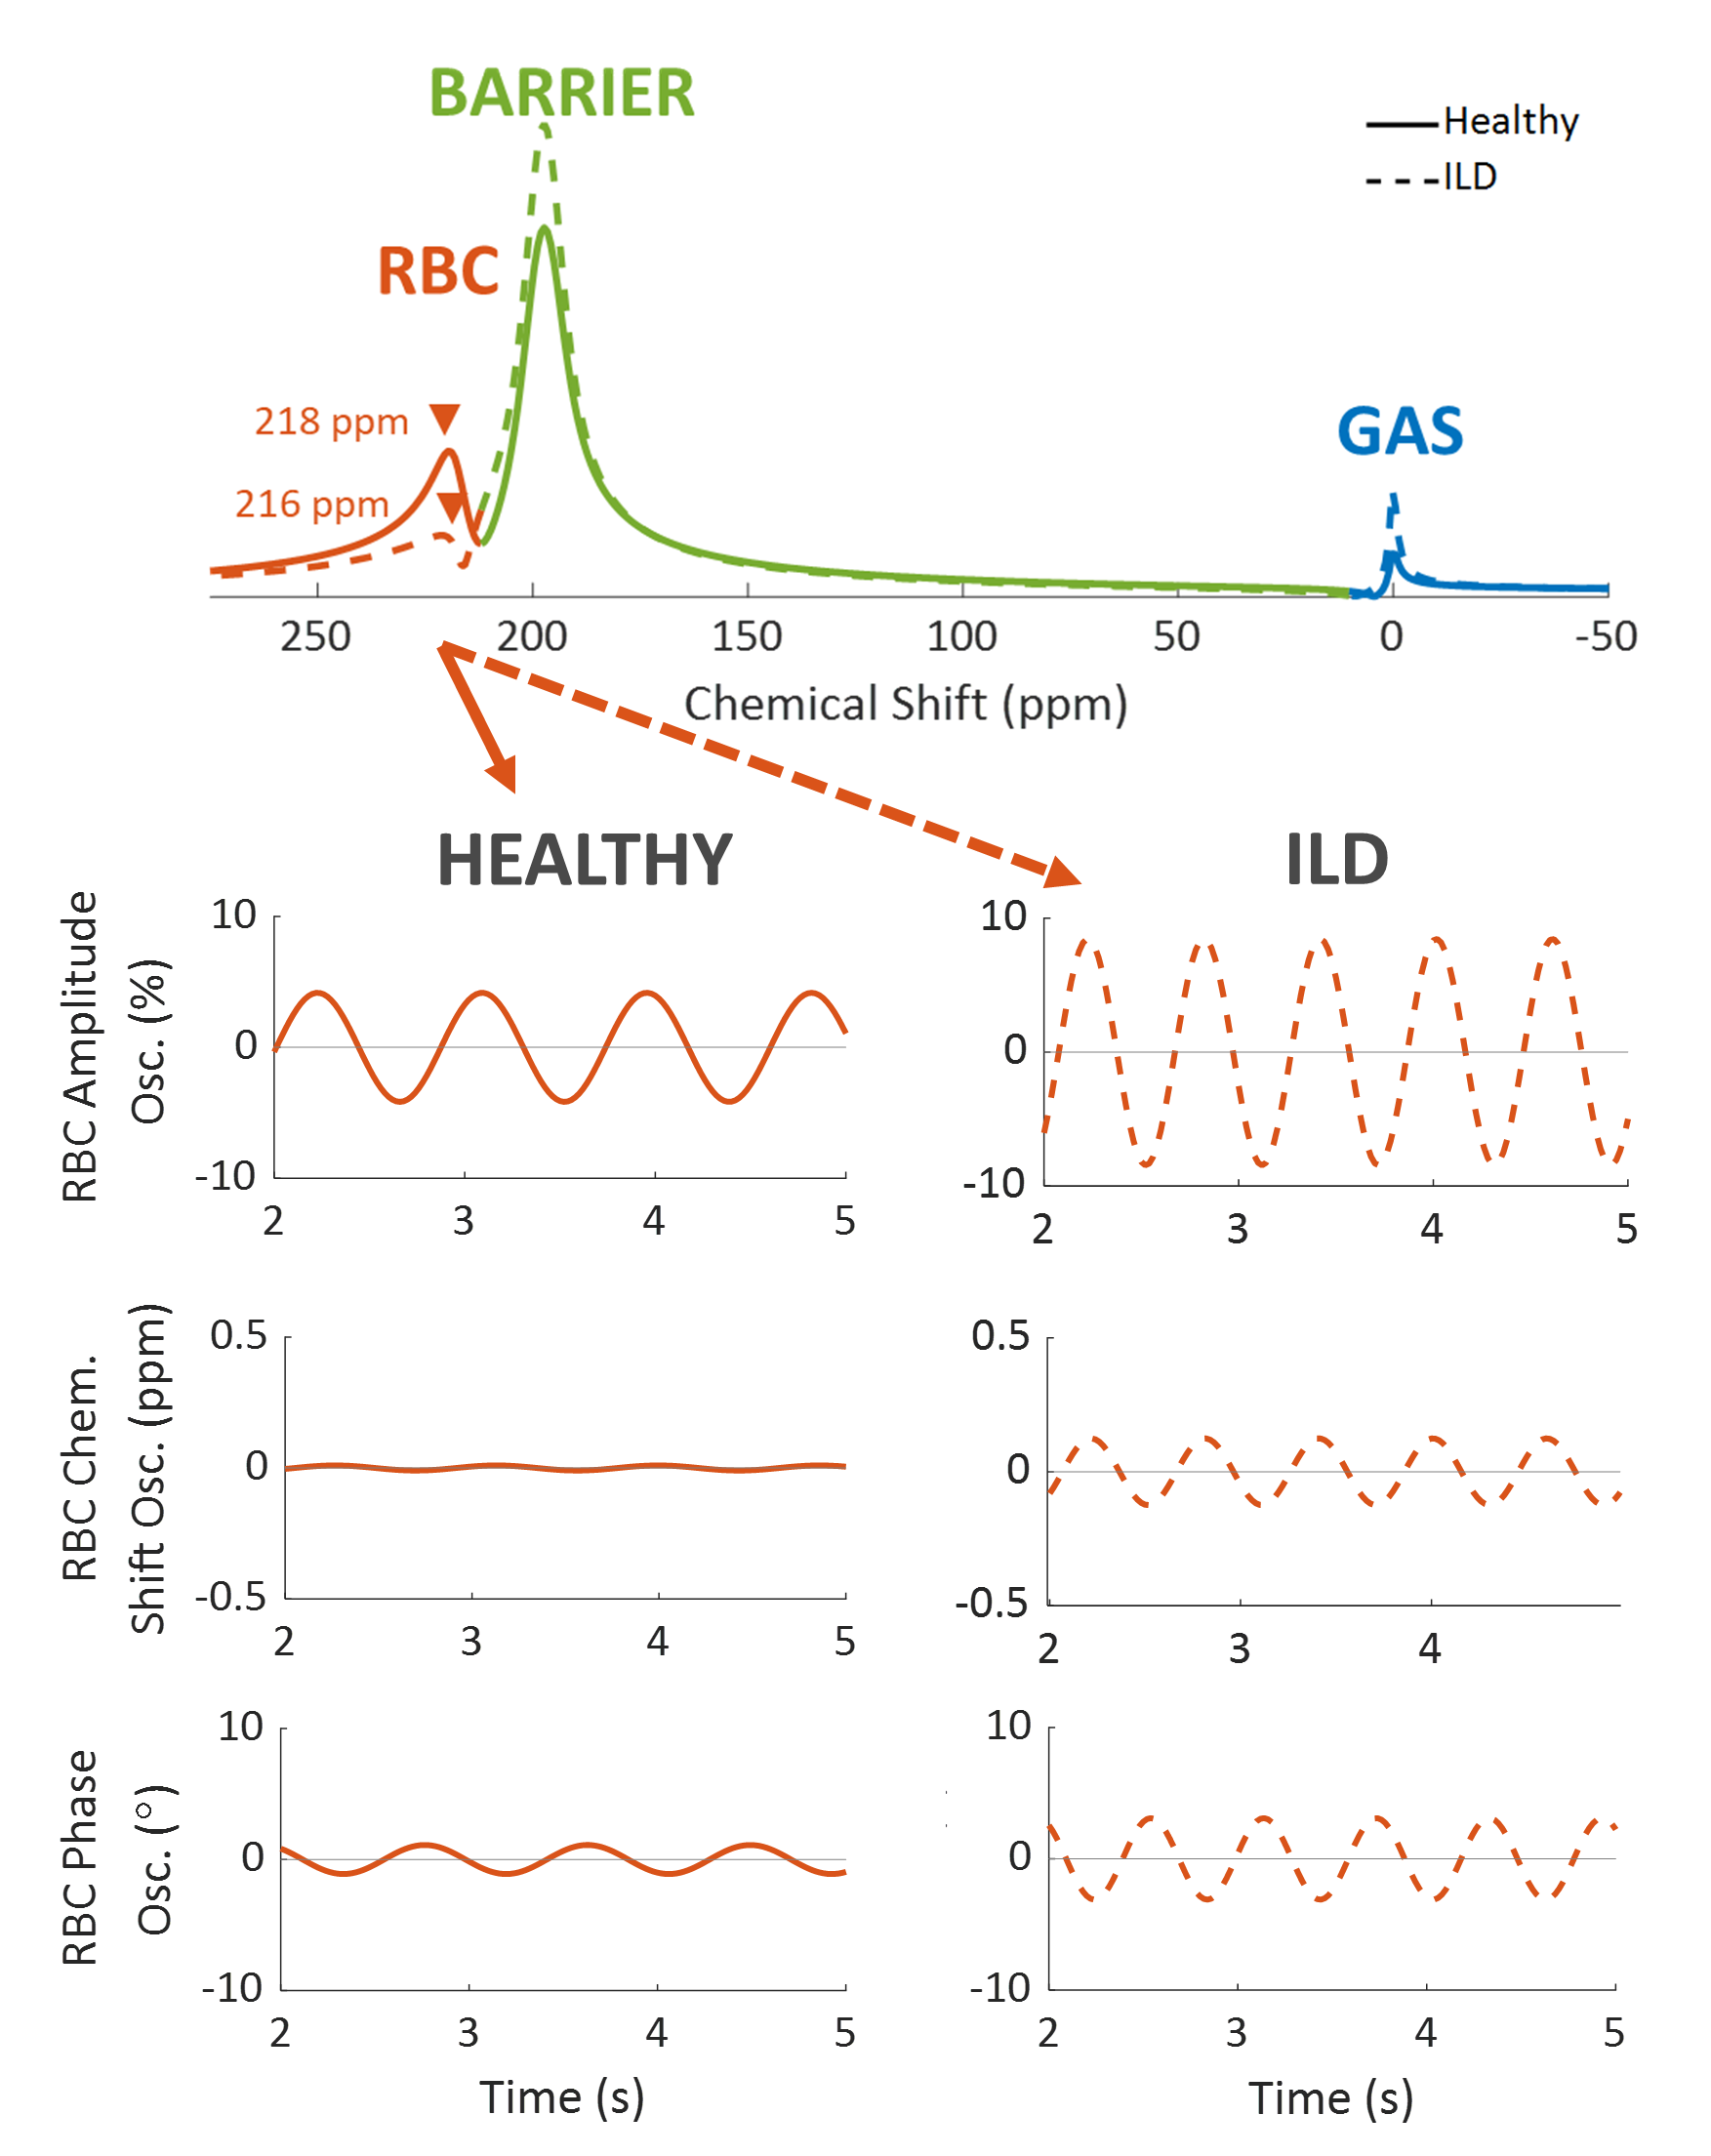
Figure 1. 129Xe static and dynamic spectroscopy
for an example healthy volunteer (solid line) and interstitial lung disease
(ILD) subject (dashed line). Static spectroscopy quantifies the RBC chemical
shift, FWHM, and phase, and the barrier chemical shift, FWHMG, and
FWHML. Dynamic spectroscopy focuses on the cardiogenic oscillations
in the RBC resonance and quantifies the peak-to-peak height of the RBC signal
amplitude, RBC chemical shift, and RBC phase.
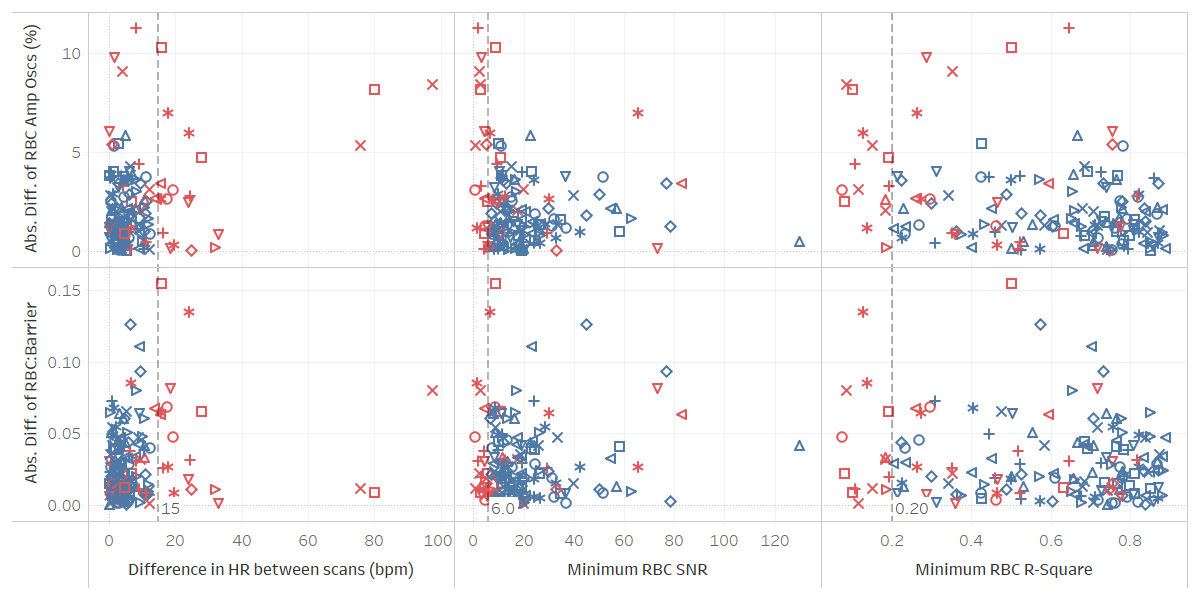
Figure 2. To be included in repeatability analysis scan
pairs had to have a heart rate (HR) difference of < 15 bpm, both needed an
RBC SNR > 6, and both needed an RBC R-square of > 0.2 (vertical dashed
lines). Each shape represents a different subject, although shapes had to be
repeated due to the large cohort size. Subjects represented by red markers were
those excluded from analysis because the scans did not meet at least one of the
cut-off requirements.
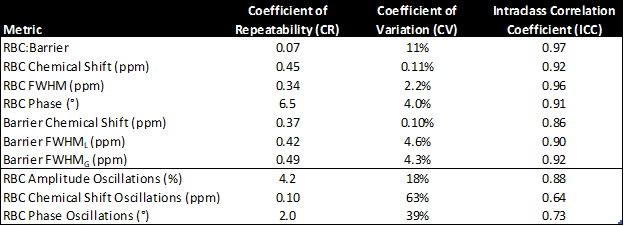
Figure 3. Repeatability
metrics for intra-study 129Xe and static and dynamic spectroscopy
parameters. All ICC P-values were statistically significant (P < 0.001).
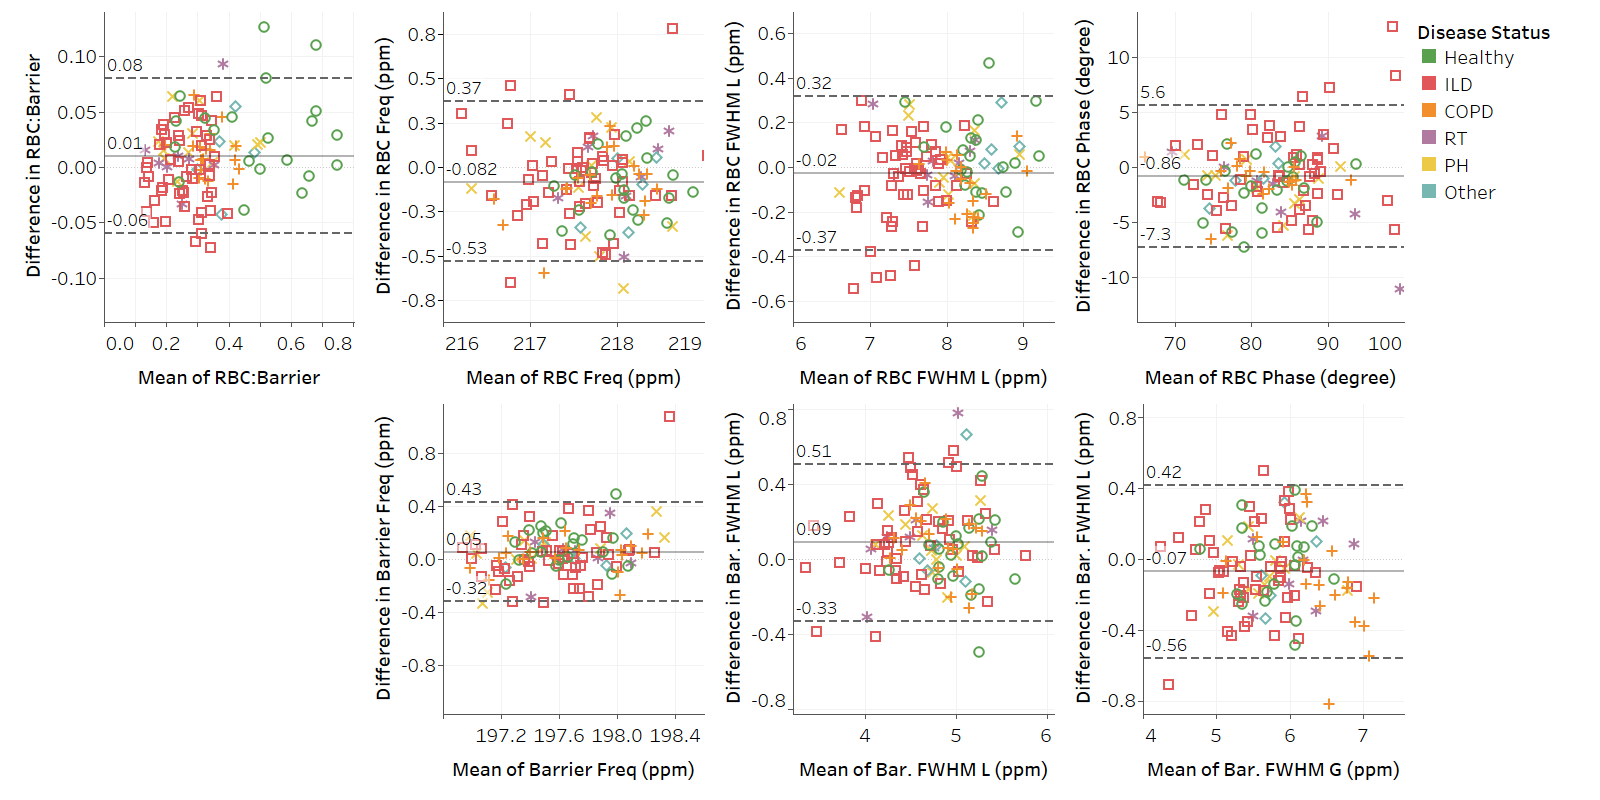
Figure 4. Bland-Altman plots for static spectroscopy
parameters. On the x-axis is the mean
value of scan 1 and scan 2, i.e. mean(scan1,scan2), and on the y-axis is the
difference between the two scans i.e. (scan 1 – scan 2). The solid line is the
bias (mean of the differences). The dashed lines are the upper and lower bounds
for the 95% confidence interval. The confidence interval is calculated as: bias
±
CR (the coefficient of repeatability).
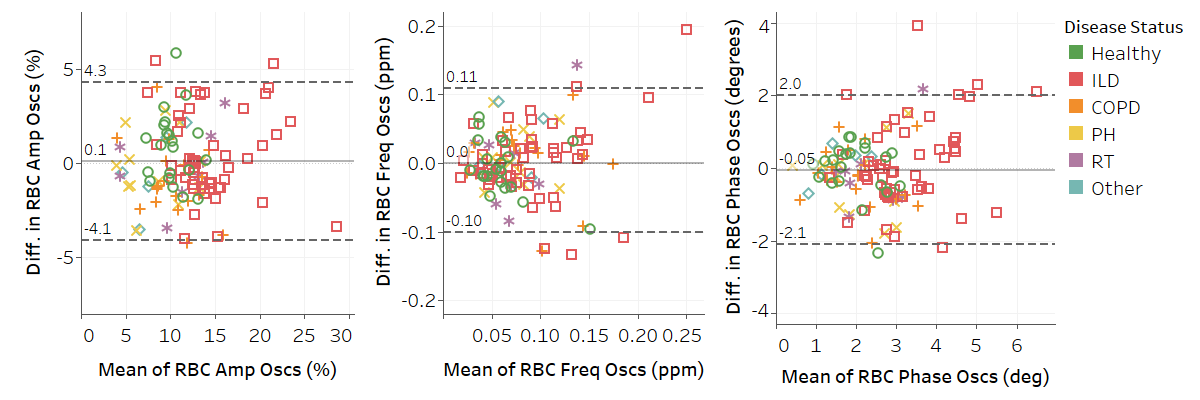
Figure 5. Bland-Altman plots for dynamic spectroscopy
parameters. Solid line is the bias (mean of the differences). Dashed lines are
the upper and lower bounds for the 95% confidence interval.