3791
Establishing the Structurally Limited Healthy RBC to Barrier Ratio for 129Xe Gas Exchange MRI
Bastiaan Driehuys1 and Elianna Ada Bier2
1Radiology, Duke University, Durham, NC, United States, 2Biomedical Engineering, Duke University, Durham, NC, United States
1Radiology, Duke University, Durham, NC, United States, 2Biomedical Engineering, Duke University, Durham, NC, United States
Synopsis
In quantitative 129Xe gas exchange MRI, the RBC/barrier ratio is emerging as a robust and important functional metric. However, it depends strongly on how it is measured, specifically on flip angle and repetition time. Moreover, we don’t yet have a clear understanding of its expected range in healthy subjects. Here, we demonstrate that by combining a physical diffusion model of 129Xe signal recovery with the recently introduced concept of flip angle to TR-equivalence, we can estimate the “structural limit” for the maximum RBC/barrier ratio expected in healthy adult subjects at any TR and flip angle.
Purpose:
In quantitative 129Xe gas exchange MRI, the RBC/barrier ratio is emerging as a critical functional metric. It provides a sensitive measure of gas exchange impairment, is used to decompose gas exchange MR images [1], and correlates well with DLCO. However, the ratio depends strongly on how it is measured, specifically on flip angle and repetition time TR. It has been measured using chemical shift saturation recovery (CSSR), which reports RBC/barrier at 90˚ flip, and TR = 100ms. However, most gas exchange imaging employs smaller flip angles (~20˚) and shorter TRs (15-25ms), making comparisons across studies difficult. Notably, there is currently no well-defined healthy reference value for the RBC/barrier ratio. Here, we demonstrate that by combining a physical diffusion model of 129Xe signal recovery [2] with the newly introduced concept of flip angle to TR-equivalence [3], we can estimate the “structural limit” for maximum expected RBC/barrier ratio in healthy adult subjects.Methods
The 1-D model of gas exchange (MOXE) was used to calculate the diffusive replenishment of 129Xe signal in barrier and RBCs. As summarized in Figure 1, we ran the model with the suggested parameters for healthy subjects [4] as well as higher hematocrit values informed by this work. To calculate RBC/barrier ratio smaller flip, we estimated the TR90 at which equivalent signal recovery would occur after 90˚ flip, as with the flip angle α and TR of interest using $$${TR_{90} = TR/(1-cosα)}$$$. This TR90 was then used in the MOXE model to calculate barrier and RBC recovery for the commonly used 20˚ flip in gas exchange imaging [1] for TRs ranging from 0 to 100ms.Such modeling was combined with new RBC/barrier measurements in healthy cohorts and a summary of literature reports, allowing us to estimate the structurally limited RBC/barrier. New cohorts were selected from healthy subjects in our database with a KCO (DLCO/VA) exceeding 4.5 mL/min/mmHg/L. Each had undergone steady-state 129Xe spectroscopy, inhaling a 1-L volume containing a dose equivalent of ~70 mL.129Xe free induction decays (FIDs) were acquired every 20 or 73 ms at the dissolved 129Xe frequency (TE=0.45ms, flip angle≈20°, dwell time=20µs, 512 points). FIDs were fit in the time domain as previously described [5]. The healthy reference cohort measured at TR=20˚ (n=12), had DLCO=31.9±4.4 mL/min/mm Hg and KCO= 5.13±0.54 mL/min/mmHg/L, while the TR=73 ms cohort (n=8) had DLCO=32.7±4.4 mL/min/mm Hg and KCO= 5.52±0.54 mL/min/mmHg/L.
An additional literature search identified 4 publications quoting healthy RBC/barrier ratios from the CSSR literature, and 2 publications with steady-state RBC/barrier at a=20˚, one at TR=20ms, and one at TR=50ms.
Results
Figure 2 shows the steady-state RBC and barrier signal recovery as a function of TR for the 20˚ flip scenario. Both barrier and RBC rise rapidly from 0 to 5ms and then continue to increase linearly. However, from TR=5 to 100ms, RBC/barrier increases by only 22%. Figure 3 shows the RBC/barrier recovery predicted by the default MOXE model (Hct=26%) and our proposed version (Hct=32.1%) for both 90˚ and 20˚ flip recovery scenarios; to each graph we have appended the literature and newly reported measurements. For the 90˚ flip scenario, mean literature RBC/barrier values are lower than both forms of MOXE model. For the 20˚ flip, the default MOXE model under-estimates the RBC/barrier reported in 3 of the 4 cohorts. By contrast the Hct=32.1% model agrees well with the new healthy TR=20 and 73ms cohorts. Notably, at TR=20ms, the RBC/barrier=0.686, which at TR=15ms, is reduced by only 1.6% to 0.675. Because RBC/barrier is often measured during calibration, Figure 4, shows that post-hoc corrections of <4% can adjust it for actual vs desired 20˚ flip.Discussion:
The proposed simple adaptation of the MOXE model enables an estimate of the structural limit (in adult subjects) for RBC/barrier independent of acquisition. Additional benefits include the ability to correct RBC/barrier for Hgb, and flip angle.While many of the literature-reported RBC/barrier values fell somewhat below these predictions, this likely reflects a heterogeneity of patient selection from early studies. For example, several subjects in the Bier ‘19 and Kaushik ‘14 publications had DLCO values below 25 mL/min/mm Hg. Most of the healthy values from the CSSR literature also fall below both predicted curves, again attributable to subject selection or possibly spectral fitting techniques. For example, it is likely that efforts to phase spectra and fit only the real portion will underestimate RBC signal. Nonetheless, this work suggest that future healthy cohorts should likely select subjects with KCO>5 mL/min/mmHg/L. KCO is appropriate because, like RBC/barrier, it does not depend on alveolar volume, while DLCO does.
Note that this simple 1-D model has limitations. Most CSSR literature using this model to fit report notoriously low Hct (and Hgb), likely due to the simplified 1-D model, which cannot accurately capture continued barrier uptake at longer recovery times in tissues distal to the thinnest part of the blood gas barrier. Our proposed Hct=32.1% corresponds to Hgb=10.9 g/dL, which is still low, but moderately plausible. Future models based on finite element modeling as suggested by Stewart could predict RBC and barrier signal at long recovery times with more plausible Hct [6].
Acknowledgements
2R01HL105643-06, R01HL126771, R01HL126771, GenentechReferences
- Z. Wang et al., Magn. Reson. Med. 80, 2374 (2018).
- Y. V. Chang, Magn. Reson. Med. 69, 884 (2013).
- K. Ruppert et al., Magn. Reson. Med. 81, 1784 (2019).
- Y. V. Chang, J. D. Quirk, I. C. Ruset, J. J. Atkinson, F. W. Hersman, and J. C. Woods, Magn. Reson. Med. 71, 339 (2014).
- E. A. Bier, S. H. Robertson, G. M. Schrank, C. Rackley, J. G. Mammarappallil, S. Rajagopal, H. P. McAdams, and B. Driehuys, NMR Biomed. 32, e4029 (2019).
- N. J. Stewart, J. Parra-Robles, and J. M. Wild, J. Magn. Reson. 271, 21 (2016).
Figures
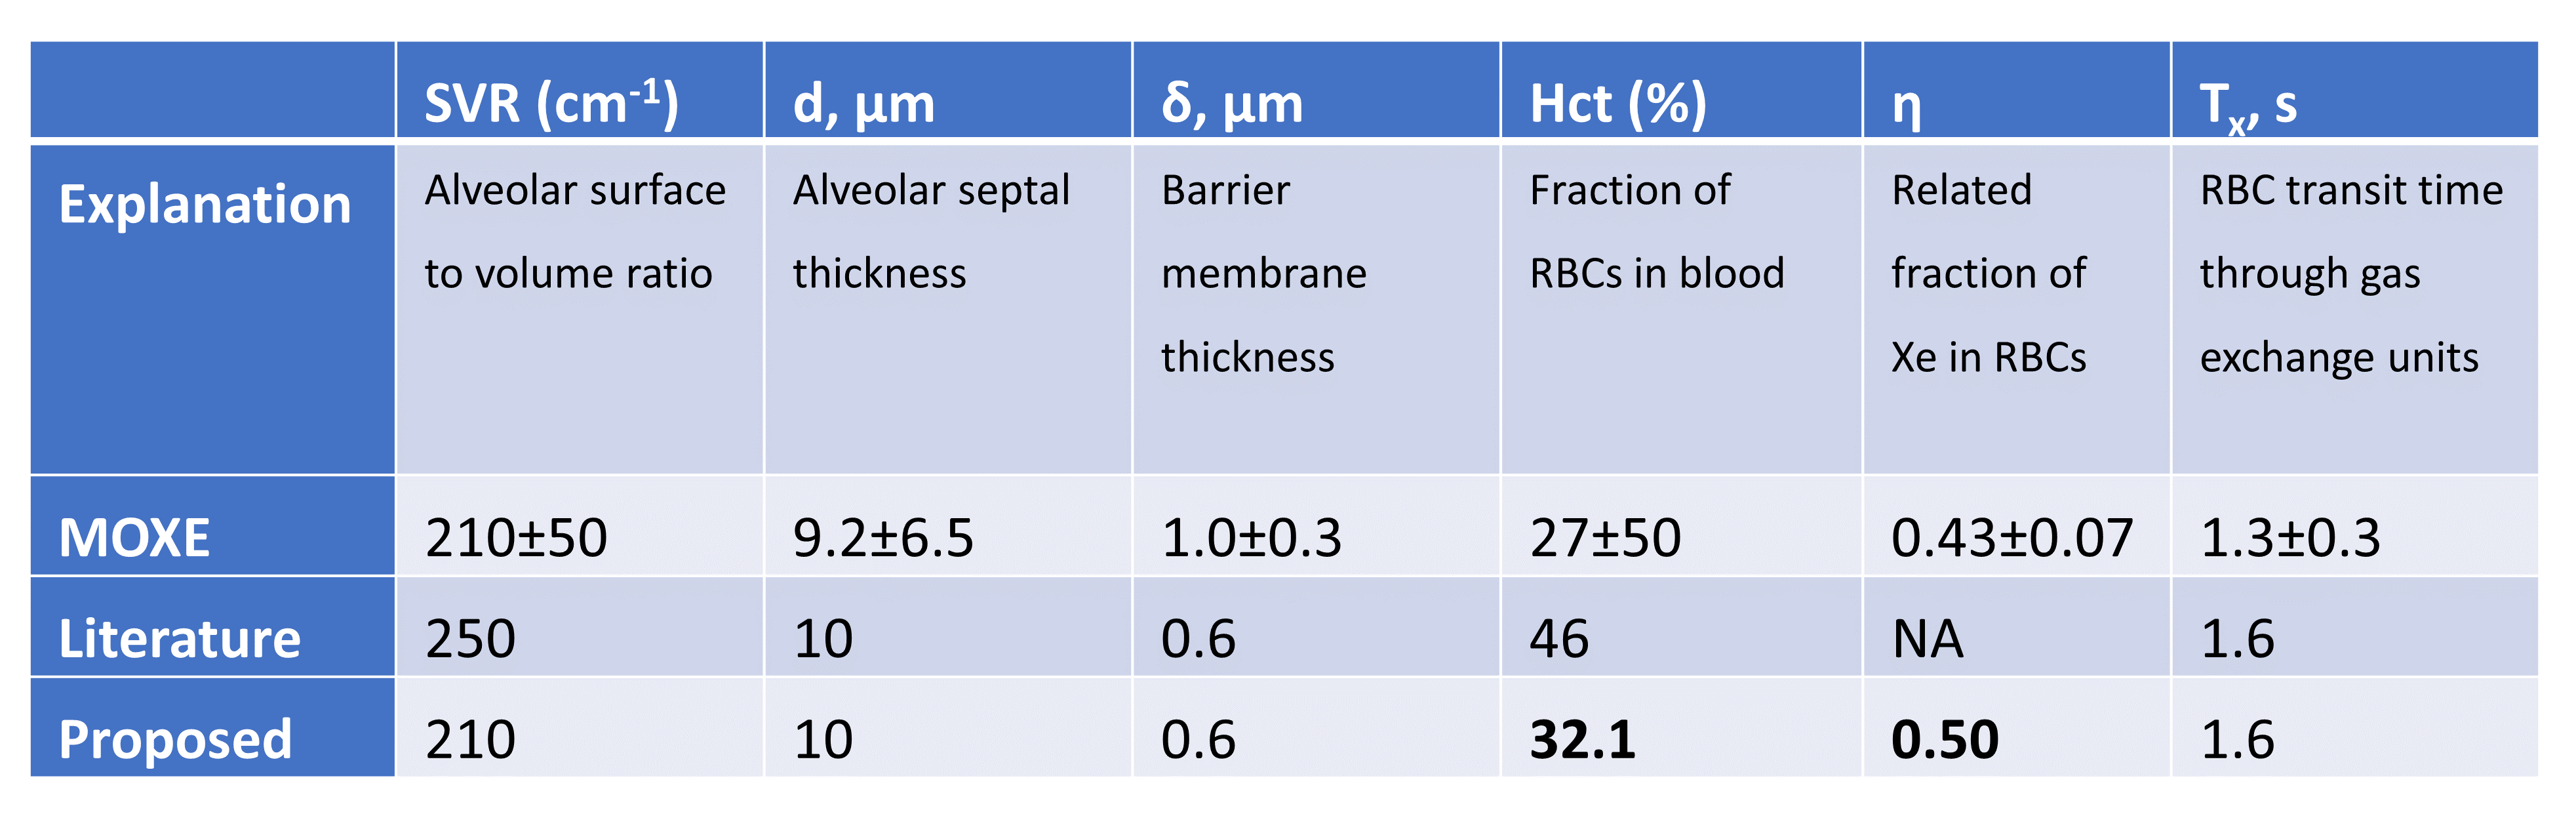
Figure 1. Table of parameters for the default MOXE model with
hematocrit of 27% as well as the 32.1% we propose to better define the
structural limit of healthy RBC/barrier. Note that the MOXE model and most CSSR
publications report notoriously low values of hematocrit likely reflecting a
limitation of the simple 1-D model. Our proposed updated hematocrit value,
while still on the low end of normal, better aligns with observed RBC/barrier
ratios at 20˚ flip in healthy young cohorts.
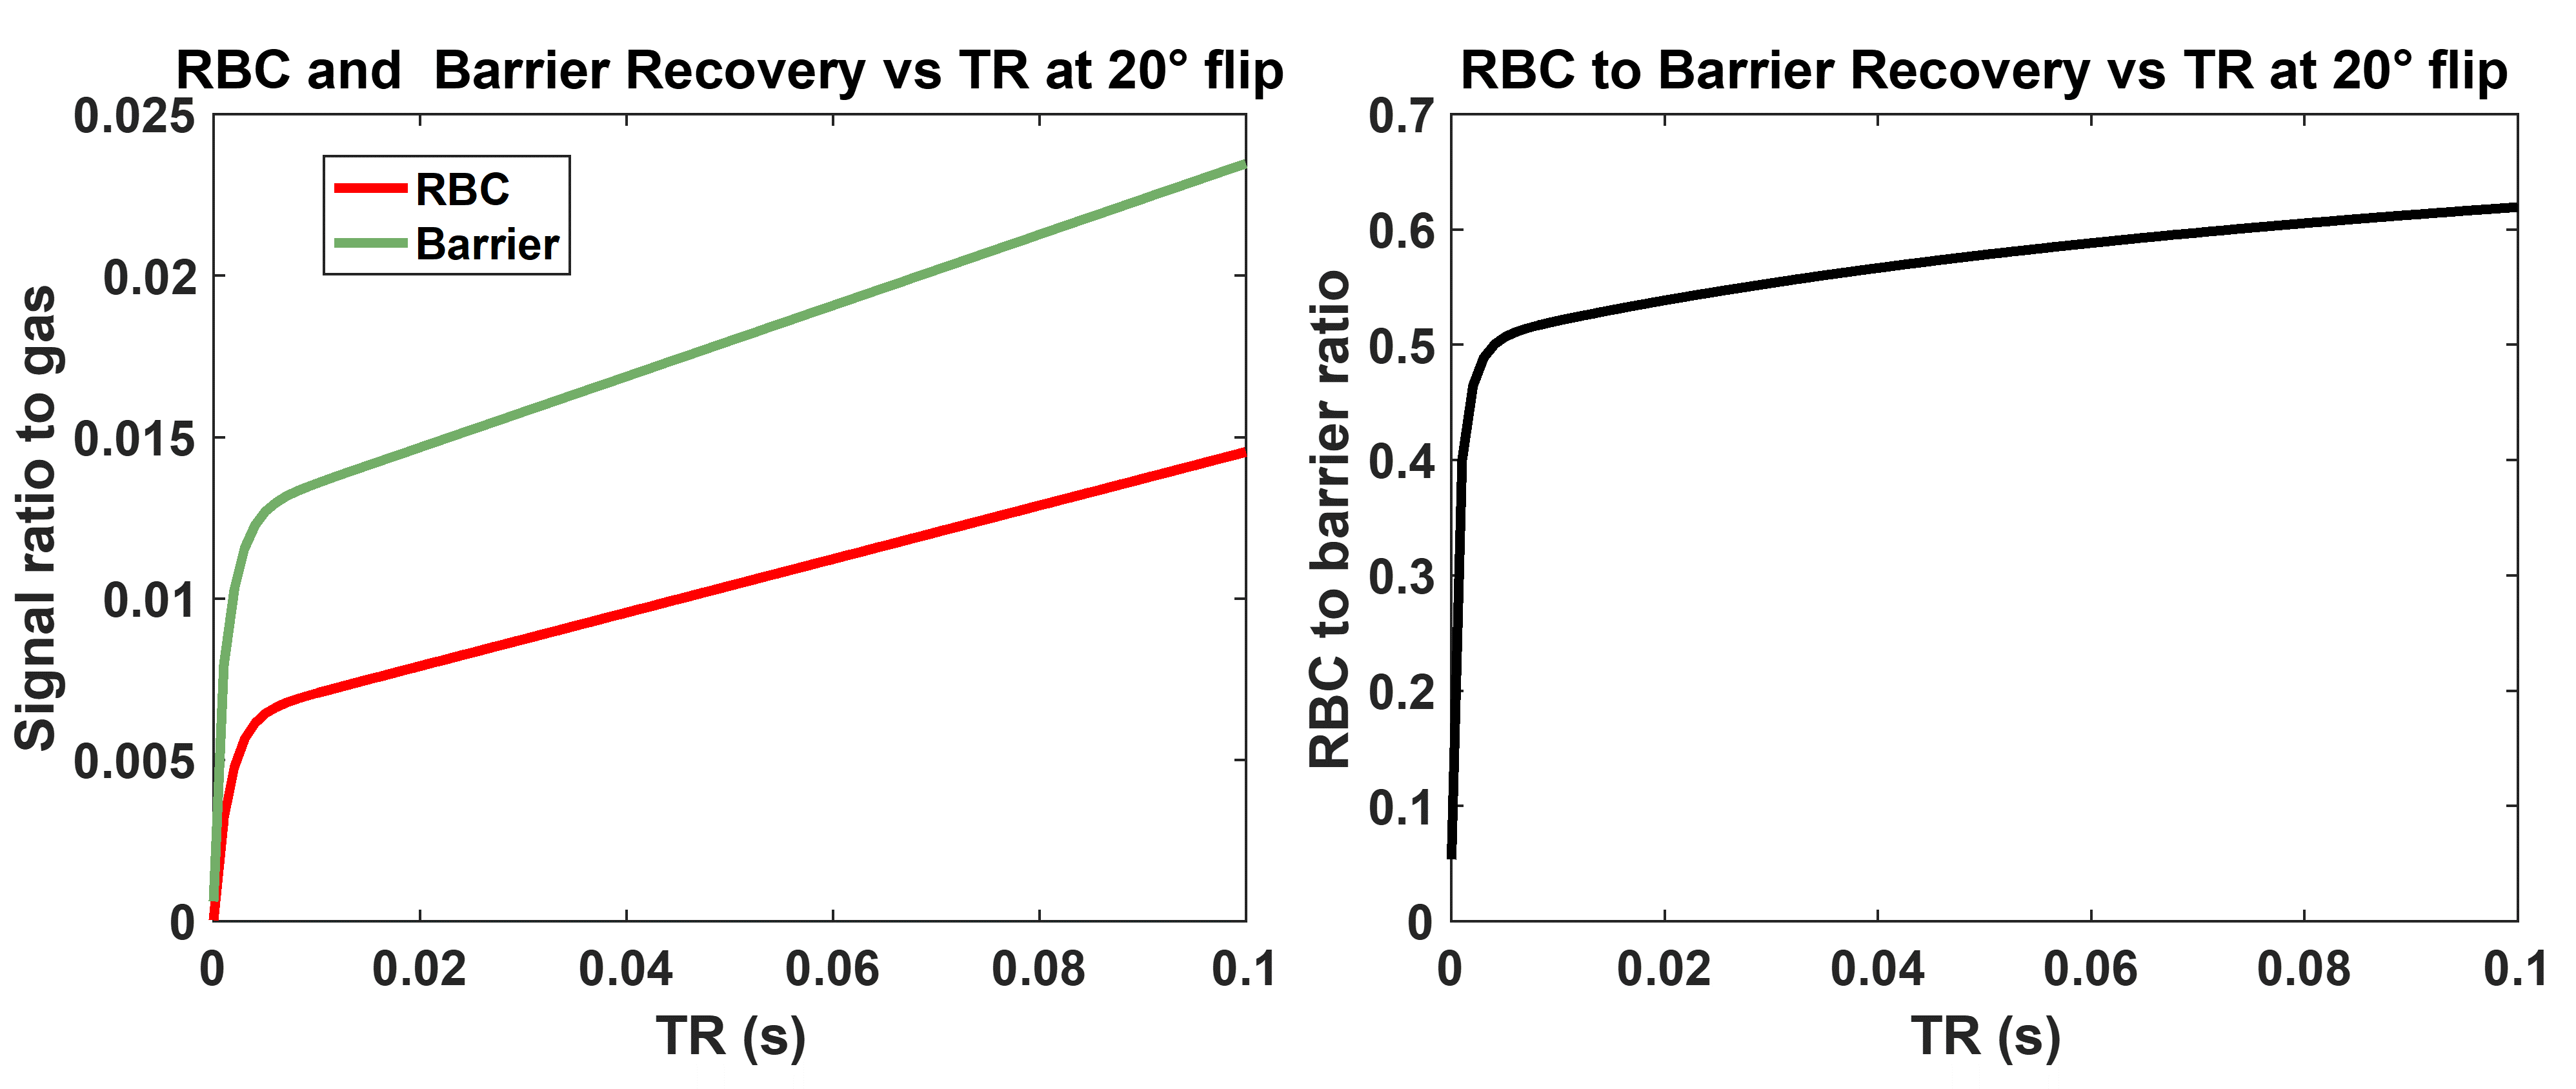
Figure 2. Barrier and RBC
recovery calculated with default MOXE model parameters for a time range of TR =
0 to 100ms for a steady-state 20˚ flip angle recovery vs TR. Left panel:
individual barrier/gas and RBC/gas recovery curves. Right panel: RBC/barrier recovery.
To
evaluate recovery from 0 to 100ms for 20˚ flip requires evaluating the MOXE
model from TR90=0 to 1.66 sec.
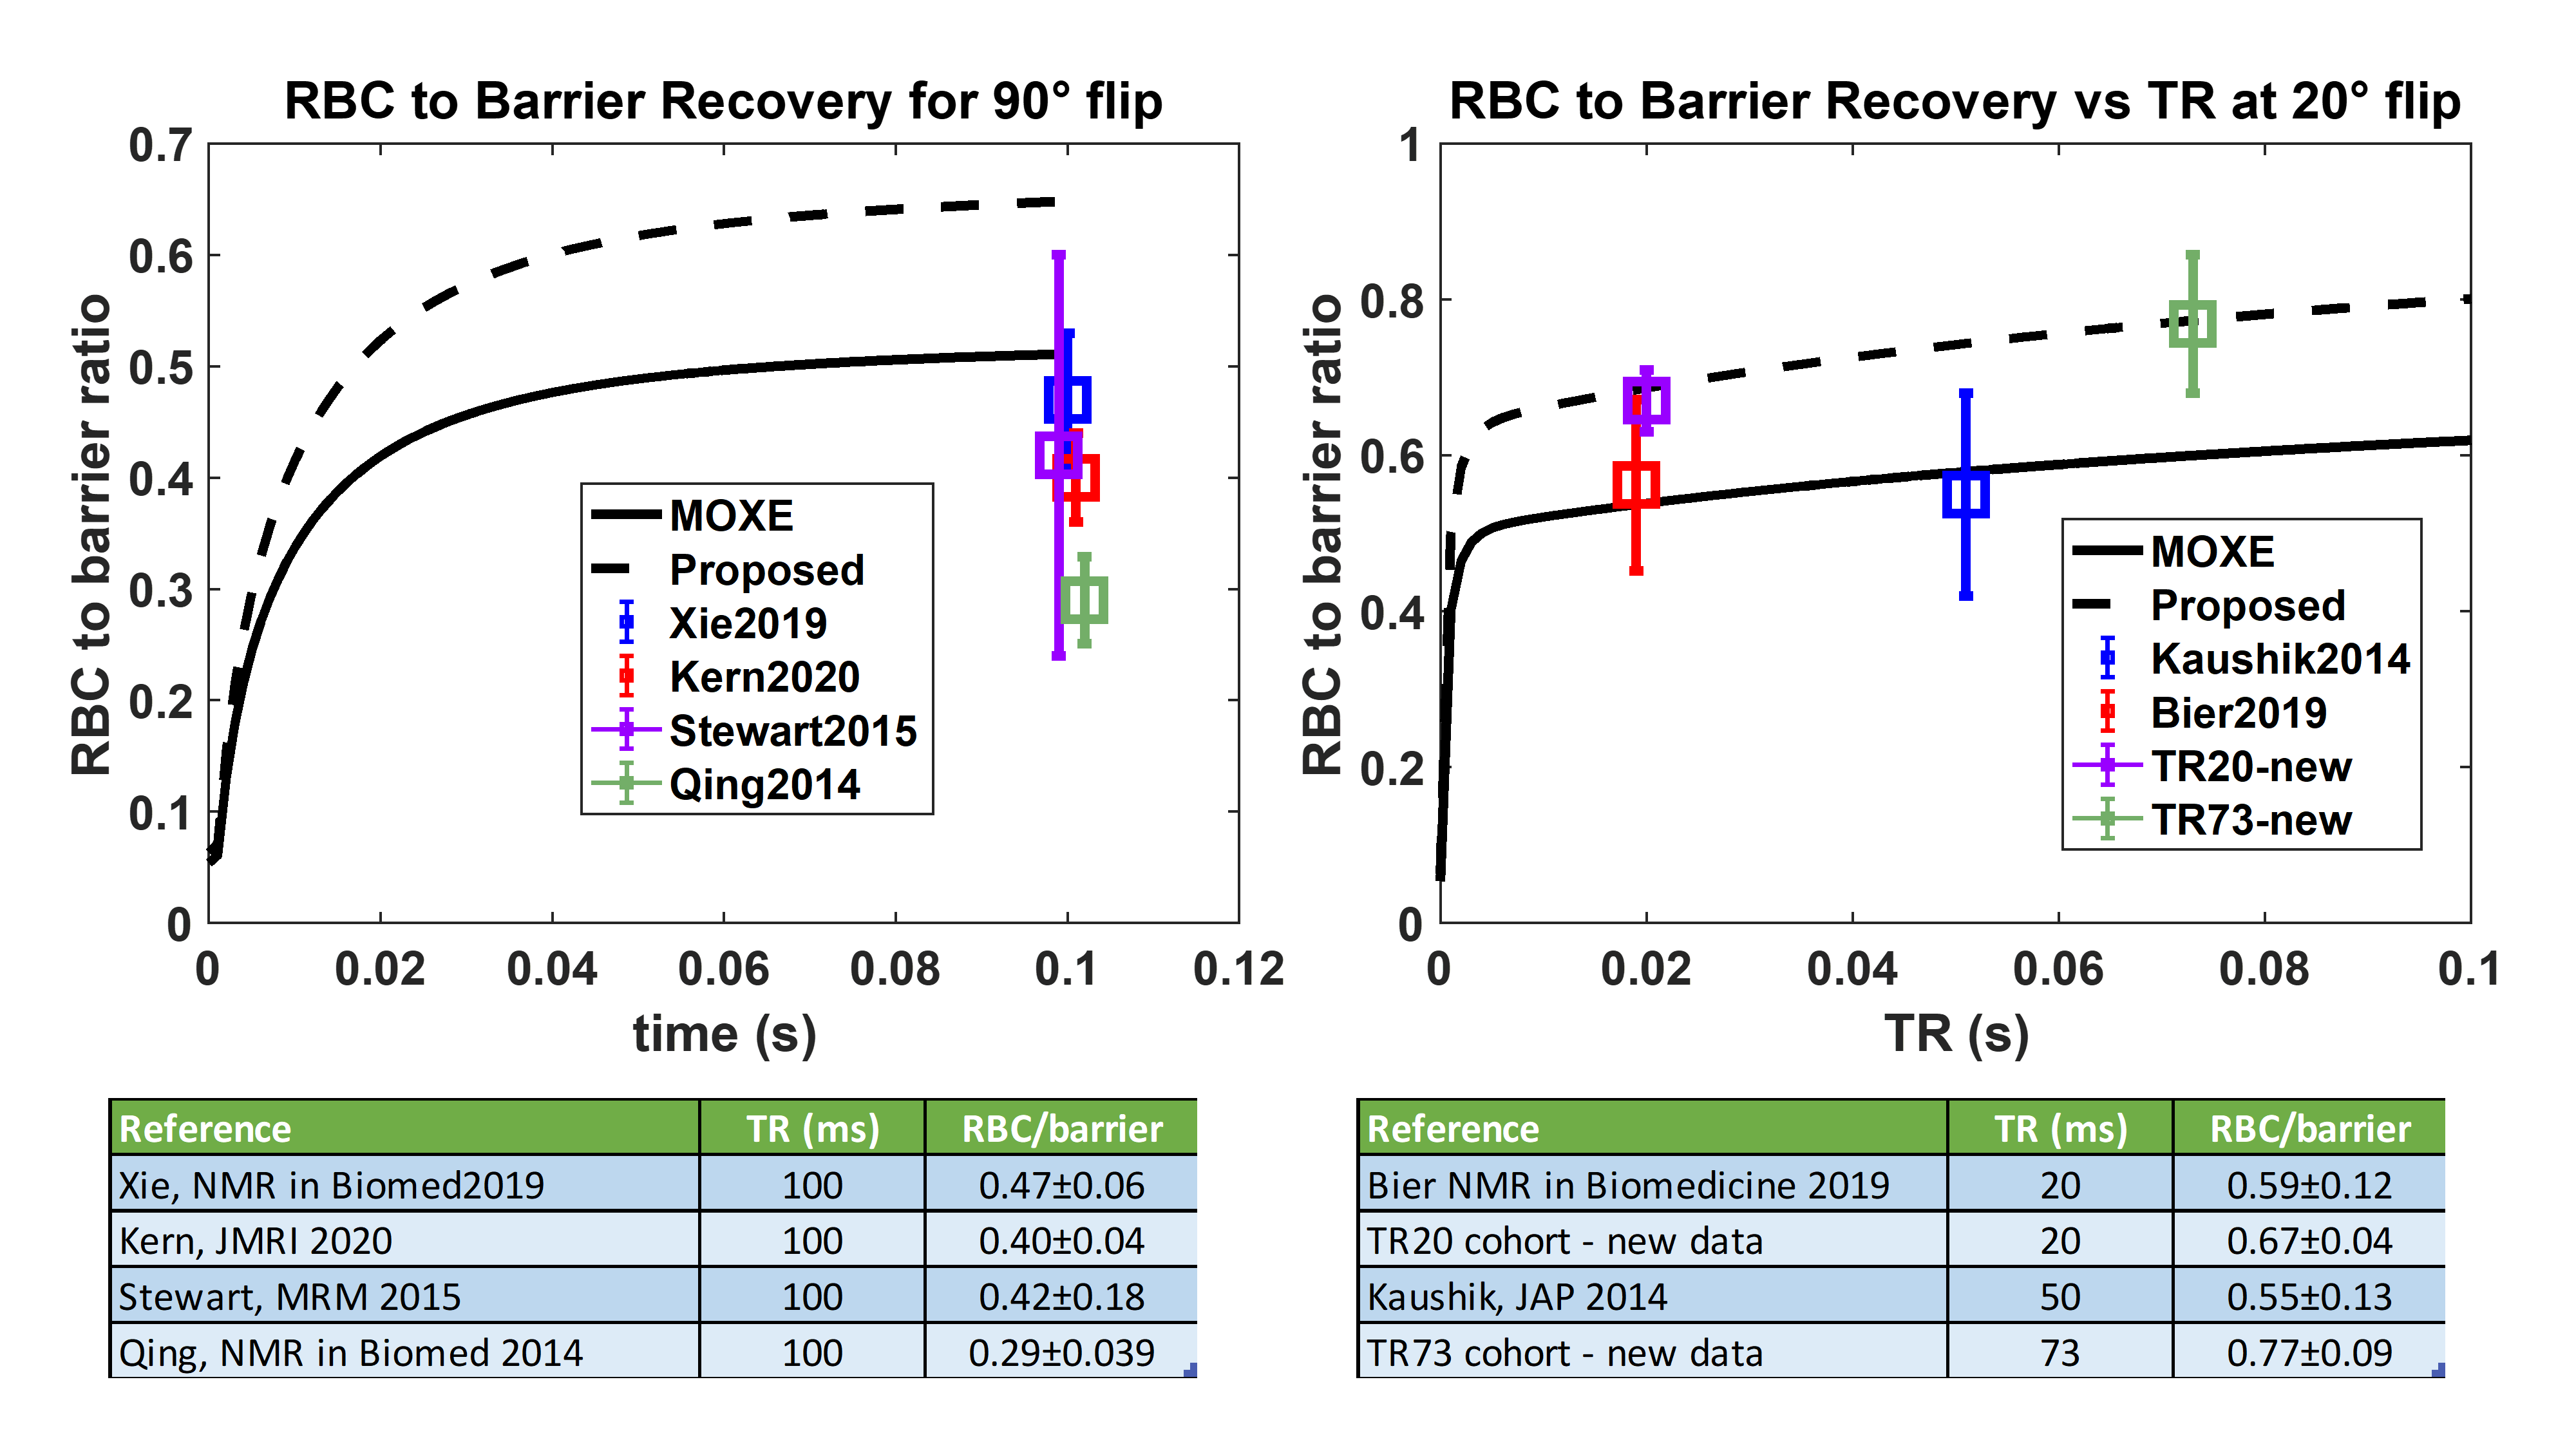
Figure 3. MOXE model predictions with
default Hct=27% and proposed Hct=32.1% are compared to literature reports and
new data. Left panel: In the CSSR (90˚ flip) scenario, the mean literature
RBC/barrier values are lower than both MOXE models. Right panel: In the steady-state
20˚ flip scenario the default model reports considerably lower RBC/barrier than
measured for most subjects. The proposed recovery (dashed line) shows better
agreement with the RBC/barrier in healthy cohorts.
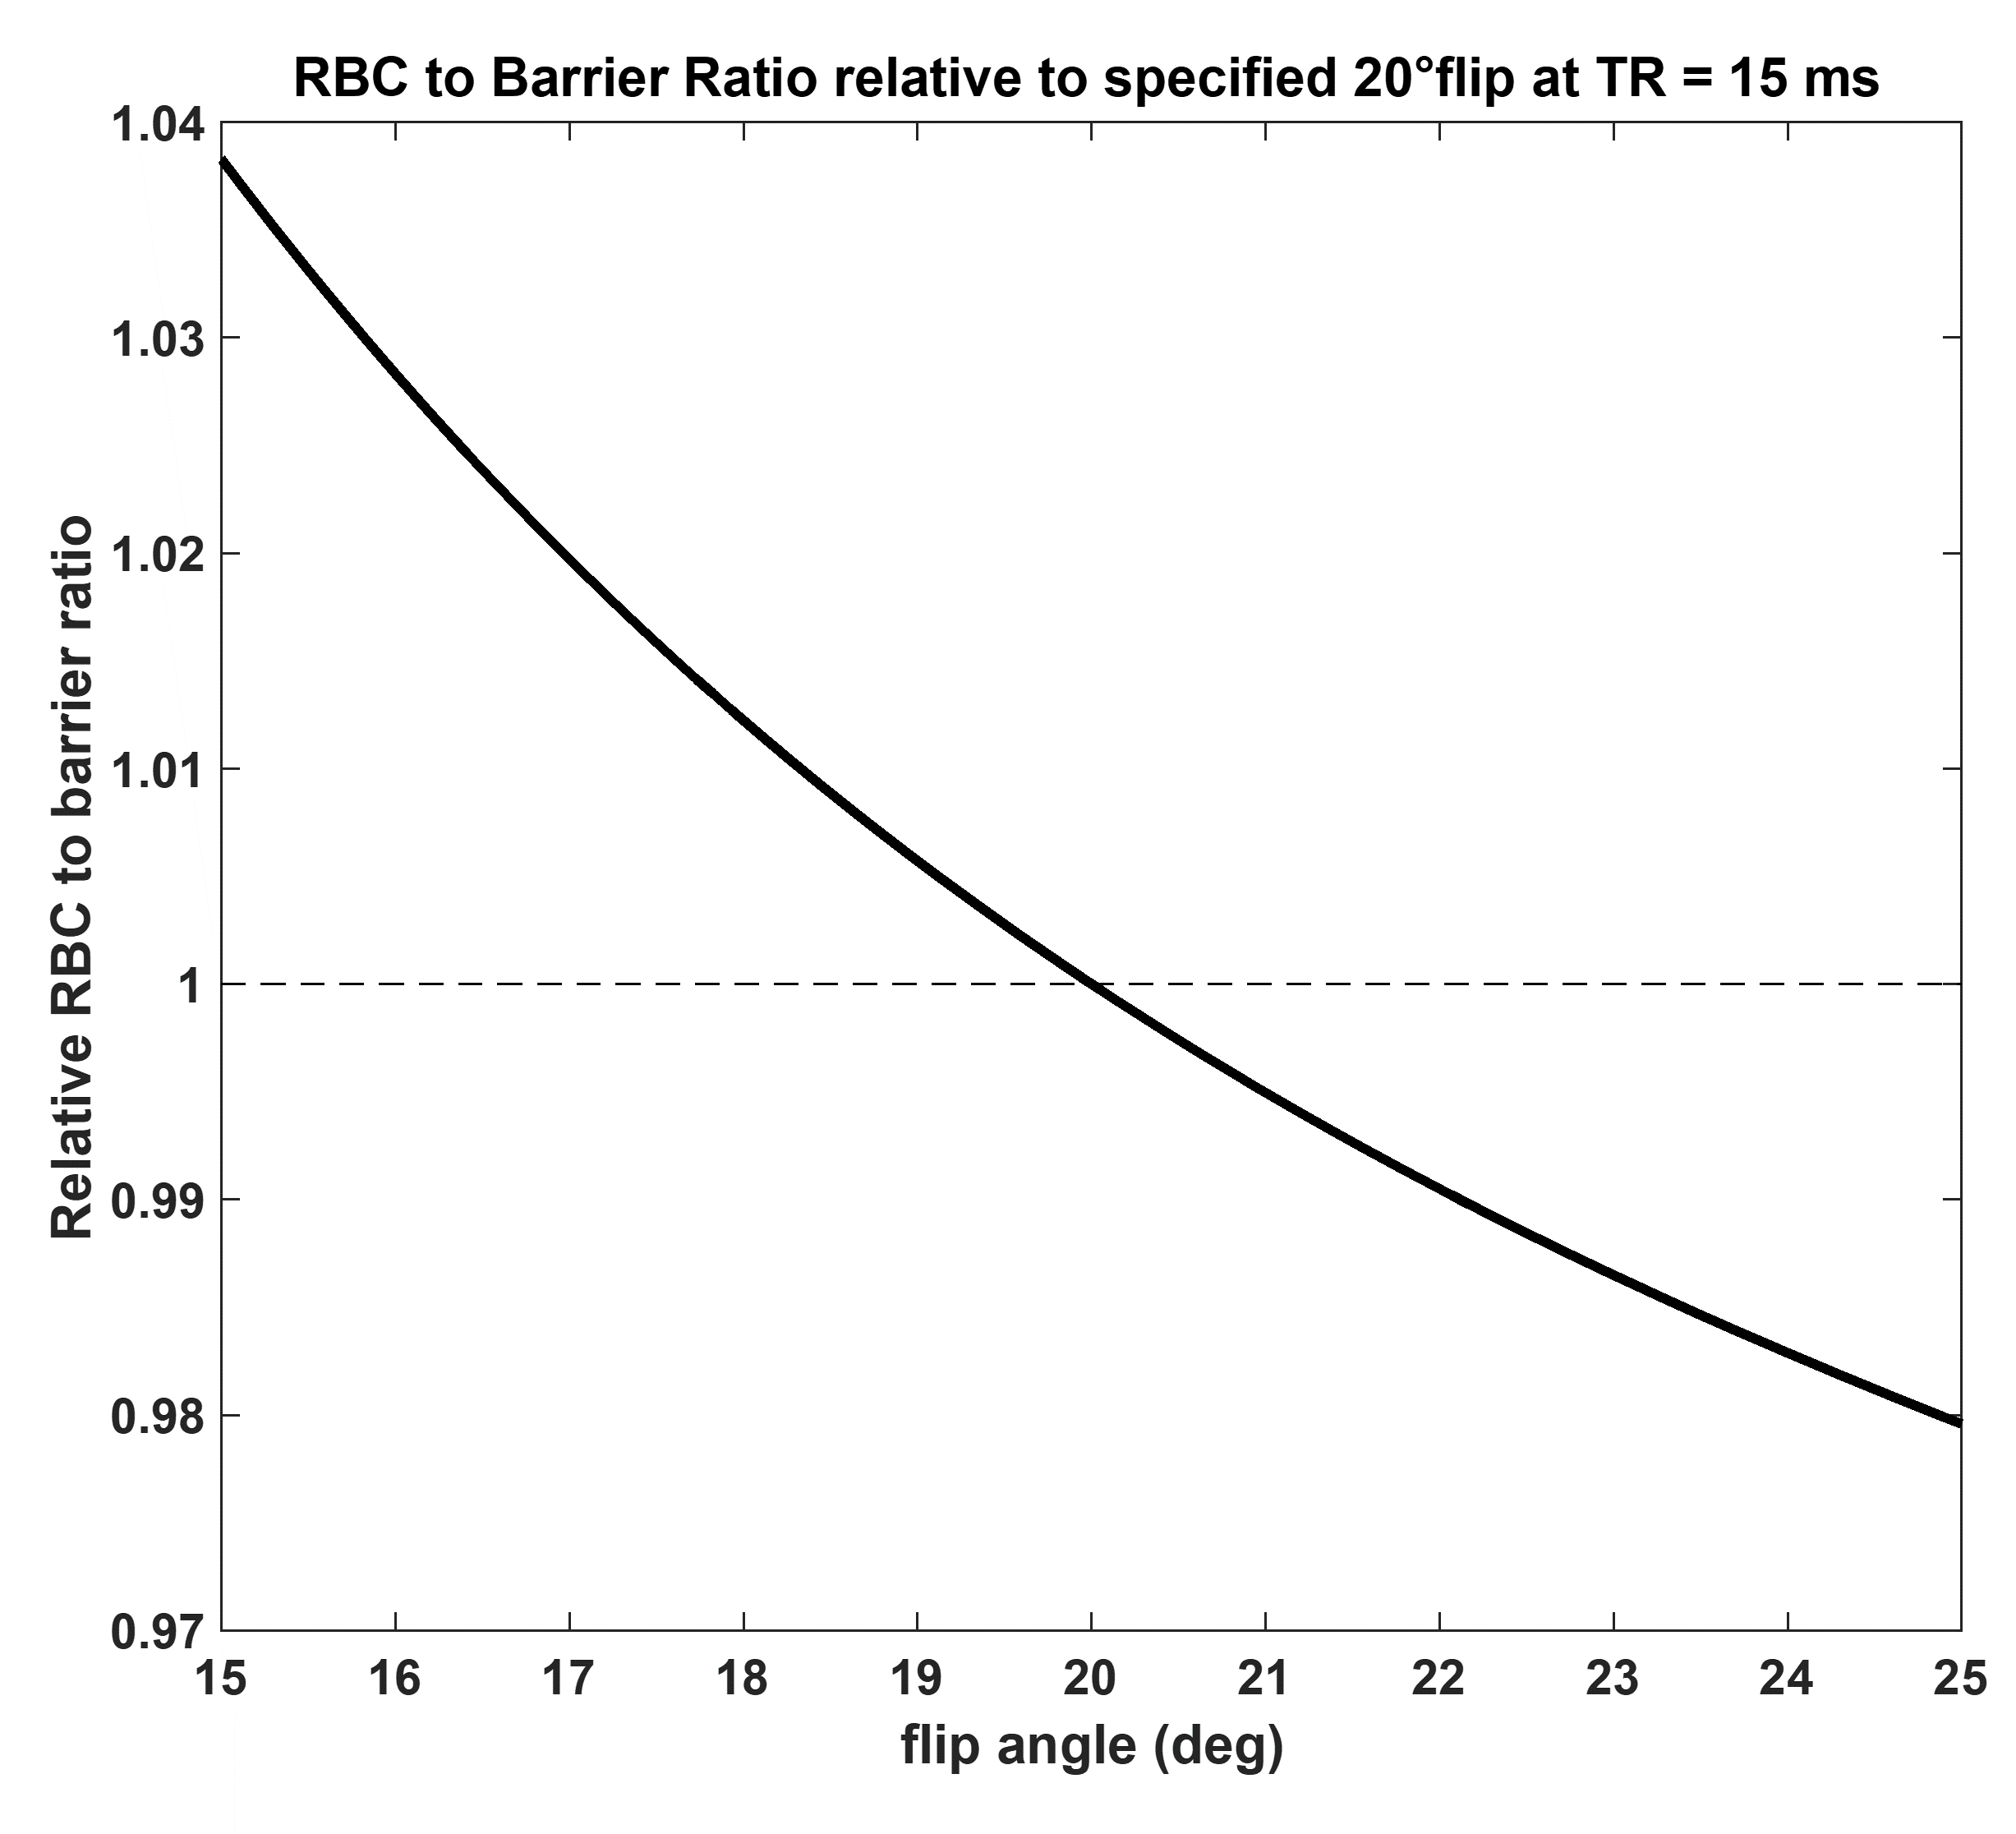
Figure 4. Correction factor for RBC/barrier measurements
acquired at flip angles that deviate from 20˚ for calibration acquisition at
TR=15ms. Most RBC/barrier measurements are taken during calibration at which
time the target flip angle of 20˚ may not yet be achieved. As evidenced from the
figure, for most practical calibration flip angles (20 ± 5°), the RBC/barrier
correction factor is <4%.