3789
Optimization of SNR and the total acquisition time in MRCDI1Electrical and Electronics Eng., Middle East Technical University (METU), Ankara, Turkey
Synopsis
The clinical applicability of magnetic resonance current density imaging (MRCDI) is highly dependent on the sensitivity of the acquired current-induced magnetic flux density ($$$\widetilde{B}_z$$$) distribution. Here, the combined effect of relevant parameters of the ICNE-SPGE pulse sequence on the SNR level and the total acquisition time of the $$$\widetilde{B}_z$$$ images are analyzed. The optimized sequence parameters are estimated to acquire $$$\widetilde{B}_z$$$ images with the highest possible SNR for a given acquisition time or the desired SNR in the shortest scan time. Besides, alternative sequence parameters are estimated to acquire the same SNR level for a given acquisition time.
INTRODUCTION
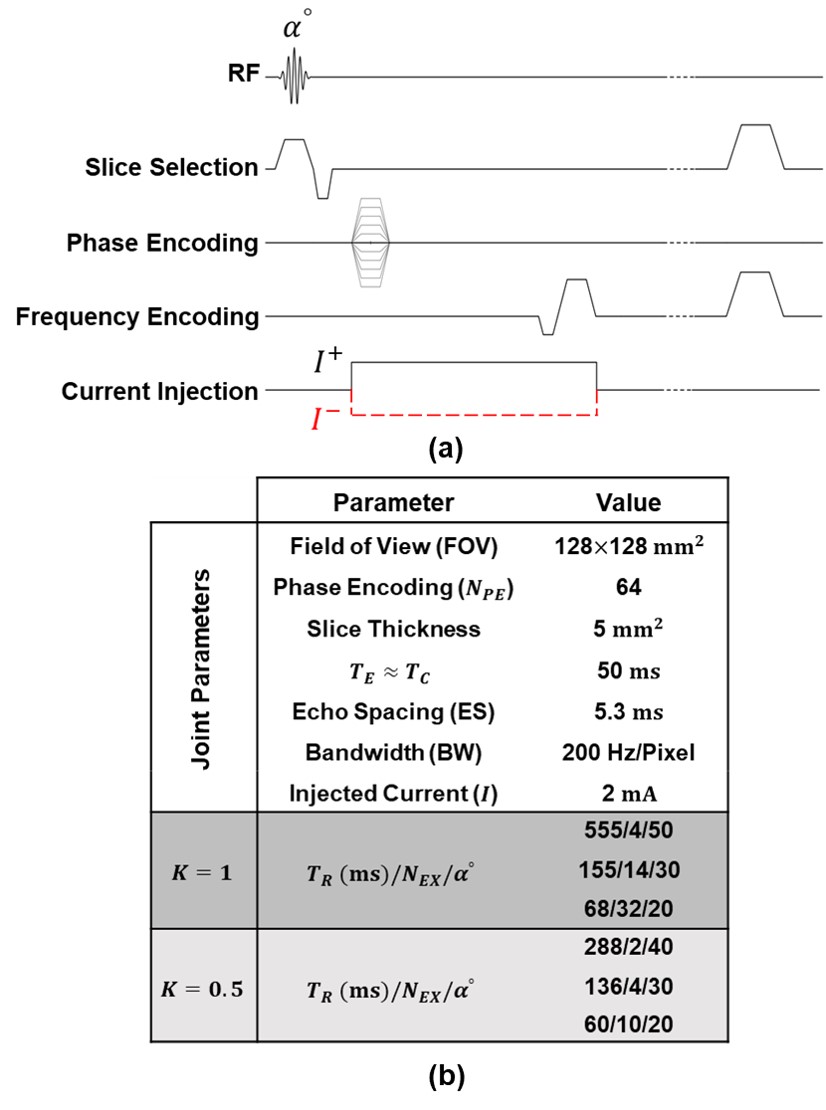
Knowledge of the current density ($$$\overline{J}$$$) distribution of impressed currents in the mA range inside the tissue is used to optimize and plan treatments like transcranial direct current stimulation (tDCS), transcranial alternating current stimulation (tACS), or deep brain stimulation.1-6 Besides, $$$\overline{J}$$$ is a key parameter to reconstruct conductivity distributions of the biological tissues using magnetic resonance electrical impedance tomography (MREIT) and diffusion tensor – MREIT (DT-MREIT). Magnetic resonance current density imaging (MRCDI) is an imaging modality providing cross-sectional $$$\overline{J}$$$ distributions of impressed currents inside the body. The current is injected into the imaging region in synchrony with an MRI pulse sequence.7 The injected current produces a local magnetic flux density ($$$B_z$$$) distribution, which introduces a phase shift to the MR signal. The amplitude of the injected current ($$$I$$$) is limited to a few mA in the low-frequency range due to safety limits8,9, and the duration of the injected current ($$$T_C$$$) is limited by the signal decay, which is related to tissue properties. ICNE-SPGE (Fig.1(a)) is an efficient pulse sequence to acquire high SNR images per measurement time in MRCDI.10 In this study, the combined effect of the ICNE-SPGE pulse sequence parameters on the SNR level and the total acquisition time of the $$$\widetilde{B}_z$$$ images are investigated.METHODS
The noise standard deviation of $$$\widetilde{B}_z$$$, $$$s_{\widetilde{n}}$$$, can be estimated as:7$$ s_{\widetilde{n}}=\frac{1}{2{\gamma}T_C{SNR_M}}\qquad[1]$$ Here, $$$\widetilde{n}$$$ represents the random noise, and $$$SNR_M$$$ is the SNR of the MR magnitude image. To express $$$SNR_M$$$, the steady-state signal amplitude of the SPGE sequence from a voxel containing several isochromats is considered:10 $$\rho(\alpha,T_E)={\rho_0}{\sin{\alpha}}\frac{(1-e^{-\frac{T_R}{T_1}})}{(1-\cos{\alpha}e^{-\frac{T_R}{T_1}})}e^{-\frac{T_E}{T_2^*}}\qquad[2]$$ Here, $$$\alpha$$$ is the flip angle, $$$\rho_0$$$ is the voxel spin density, and $$$T_E$$$ is the echo time. $$$T_R$$$, $$$T_1$$$ and $$$T_2^*$$$ represent the repetition time, longitudinal and transversal relaxation times, respectively. Since the external current is injected during the readout gradients in ICNE-SPGE $$$T_E\approx T_C$$$ and $$$SNR_M$$$ in Eq.1 can be expressed as: $$SNR_M\propto{\rho_0}{\sin{\alpha}}\frac{(1-e^{-\frac{T_R}{T_1}})}{(1-\cos{\alpha}e^{-\frac{T_R}{T_1}})}e^{-\frac{T_C}{T_2^*}}\qquad[3]$$ Thus, the SNR level function of the acquired $$$\widetilde{B}_z$$$, $$$\xi_{\widetilde{B}_z}$$$, can be defined as: $${\frac{\hat{B}_z}{s_{\widetilde{n}}}}{\propto{\xi_{\widetilde{B}_z}}}=2{\hat{B}_z}{\gamma}{T_C}{\rho_0}{\sin{\alpha}}\frac{(1-e^{-\frac{T_R}{T_1}})}{(1-\cos{\alpha}e^{-\frac{T_R}{T_1}})}e^{-\frac{T_C}{T_2^*}}\qquad[4]$$ where $$$\hat{B}_z$$$ is the noise-free current-induced $$$B_z$$$. For a single excitation, the maximum achievable SNR level, $$${\xi_{\widetilde{B}_z}^{max}}$$$, when $$$T_R\rightarrow\infty$$$ and $$$\alpha=90^\circ$$$ can be expressed as: $$\underset{\underset{\alpha=90^\circ}{T_R\rightarrow\infty}}{\operatorname{lim}}{\xi_{\widetilde{B}_z}}=2{\hat{B}_z}{\gamma}{T_C}{\rho_0}e^{-\frac{T_C}{T_2^*}}=\xi_{\widetilde{B}_z}^{max}\qquad[5]$$ By including the number of excitations ($$$N_{EX}$$$) in Eq.4, $$${\xi_{\widetilde{B}_z}^*}$$$ can be obtained as: $${\xi_{\widetilde{B}_z}^*}=2{\hat{B}_z}{\gamma}{T_C}{\rho_0}{\sin{\alpha}}\frac{(1-e^{-\frac{T_R}{T_1}})}{(1-\cos{\alpha}e^{-\frac{T_R}{T_1}})}e^{-\frac{T_C}{T_2^*}}\sqrt{N_{EX}}\qquad[6]$$ Now to minimize the total acquisition time ($$$T_{Total}$$$) using the finite sequence parameters while keeping $$${\xi_{\widetilde{B}_z}^*}={\xi_{\widetilde{B}_z}^{max}}$$$ we obtain: $${\xi_{\widetilde{B}_z}^*}={\xi_{\widetilde{B}_z}^{max}}\Rightarrow{T_R}={T_1}\ln{\frac{\sin{\alpha}{\sqrt{N_{EX}}}-{\cos{\alpha}}}{\sin{\alpha}{\sqrt{N_{EX}}}-1}}\qquad{s.t.}\qquad{N_{EX}>\frac{1}{\sin^2{\alpha.}}}\qquad[7]$$ By including the effect of $$$N_{EX}$$$ in Eq.6, a higher SNR level than $$${\xi_{\widetilde{B}_z}^{max}}$$$ can be obtained. Hence, Eq.7 can be rewritten to provide points with $$$K{\xi_{\widetilde{B}_z}^{max}}$$$ SNR level where $$$K\in{\mathbb{R}^+}$$$ as: $${\xi_{\widetilde{B}_z}^*}=K{\xi_{\widetilde{B}_z}^{max}}\Rightarrow{T_R}={T_1}\ln{\frac{\sin{\alpha}{\sqrt{N_{EX}}}-K{\cos{\alpha}}}{\sin{\alpha}{\sqrt{N_{EX}}}-K}}\quad{s.t.}\quad{N_{EX}>\frac{K^2}{\sin^2{\alpha}}}\qquad[8]$$ For a chosen $$$N_{EX}$$$, the $$$\alpha$$$ value which provides the shortest acquisition time $$$(T_R\times{N_{EX}})$$$ for the same SNR level, can be calculated using Eq.8 as: $$\frac{d}{d\alpha}N_{EX}{T_1}\ln{\frac{\sin{\alpha}{\sqrt{N_{EX}}}-{K\cos{\alpha}}}{\sin{\alpha}{\sqrt{N_{EX}}}-K}}=0.\qquad[9]$$ Eq.9 is equal to zero when $$$\alpha=\alpha_t$$$. Hence, for a chosen $$$N_{EX}$$$, $$$\alpha_t$$$ is calculated as: $$\alpha_t(N_{EX})=\cos^{-1}{\left({\frac{N_{EX}-K^2}{N_{EX}+K^2}}\right)}\qquad{s.t.}\qquad{N_{EX}\geq{K^2}}\qquad[10]$$RESULTS
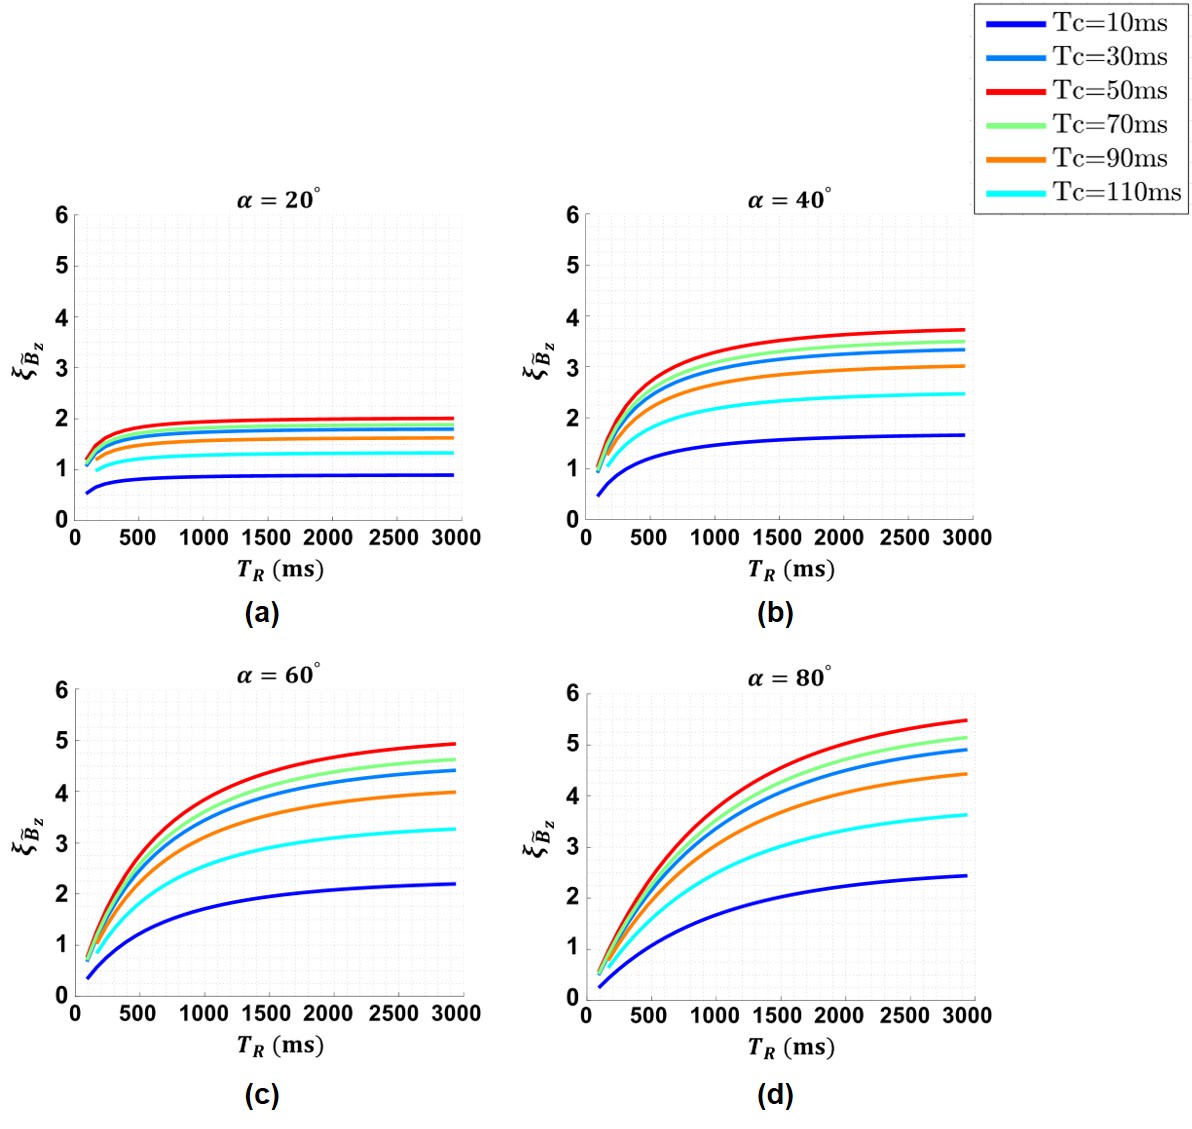
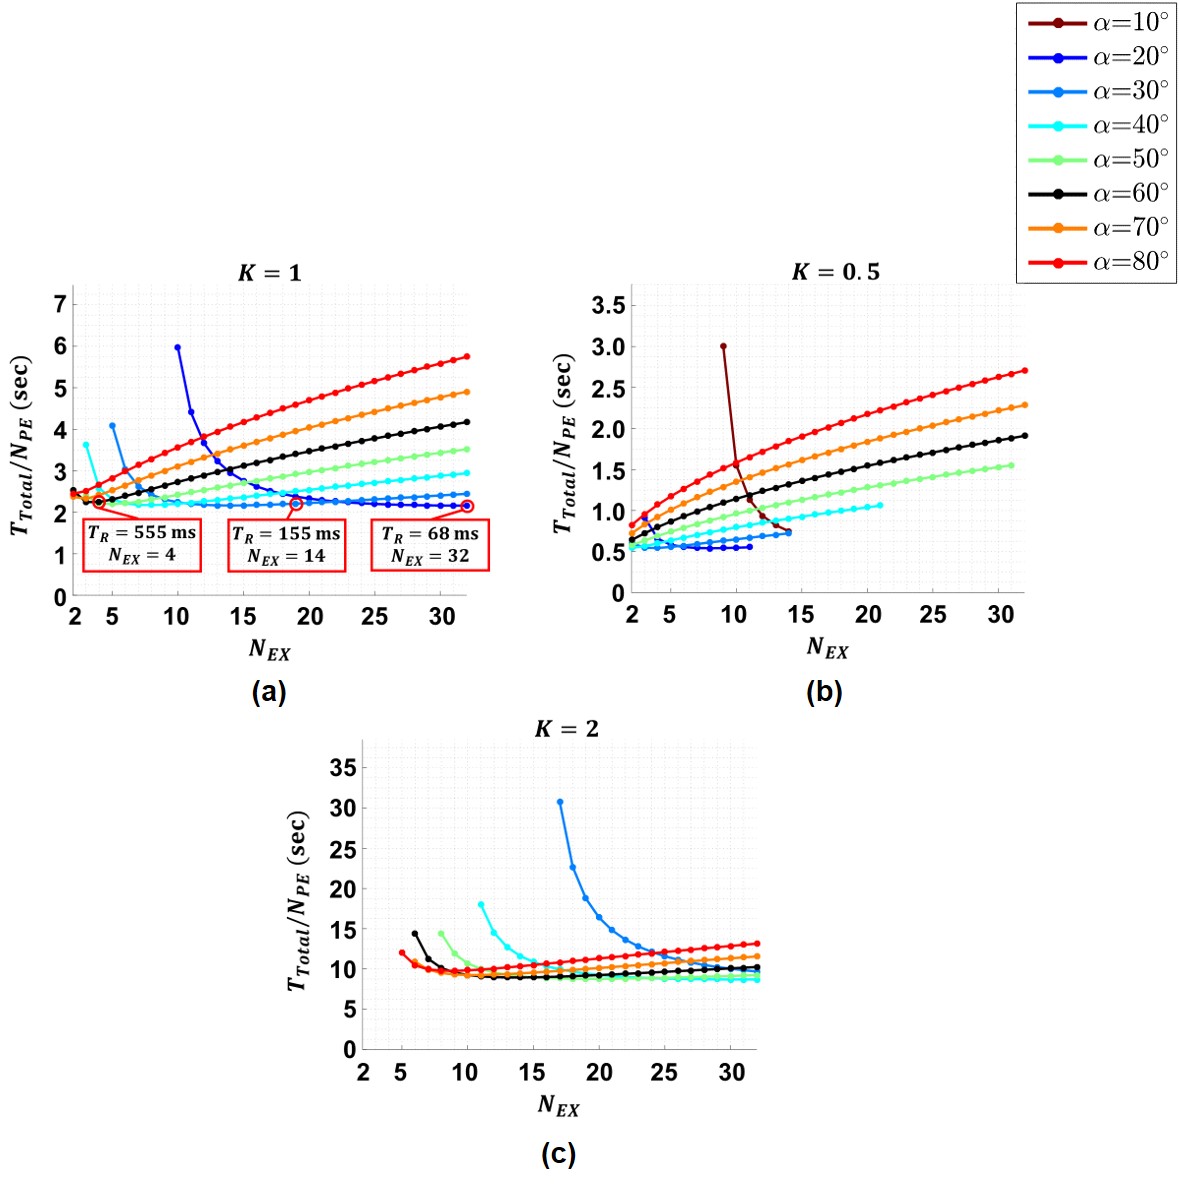
The $$$\xi_{\widetilde{B}_z}$$$ for different $$$T_R,\:\alpha,\:\text{and}\:T_C$$$ values ($$$N_{EX}=1$$$) are calculated for the human brain white matter (WM) ($$$T_1=1080\:\text{ms}\:\text{and}\:T_2=70\:\text{ms}$$$)11 as shown in Fig.2.The results for the total acquisition time per each phase encoding step ($$$T_{total}/N_{PE}=T_R\times{N_{EX}}$$$) obtained using Eq.8 for different $$$\alpha,\:N_{EX},\:\text{and}\:K=0.5,\:1\:\text{and}\:2$$$ are shown in Fig.3 for WM. The three points in (a) have almost the same $$$T_{Total}/N_{PE}$$$ but different $$$T_R$$$ and $$$N_{EX}$$$ values.
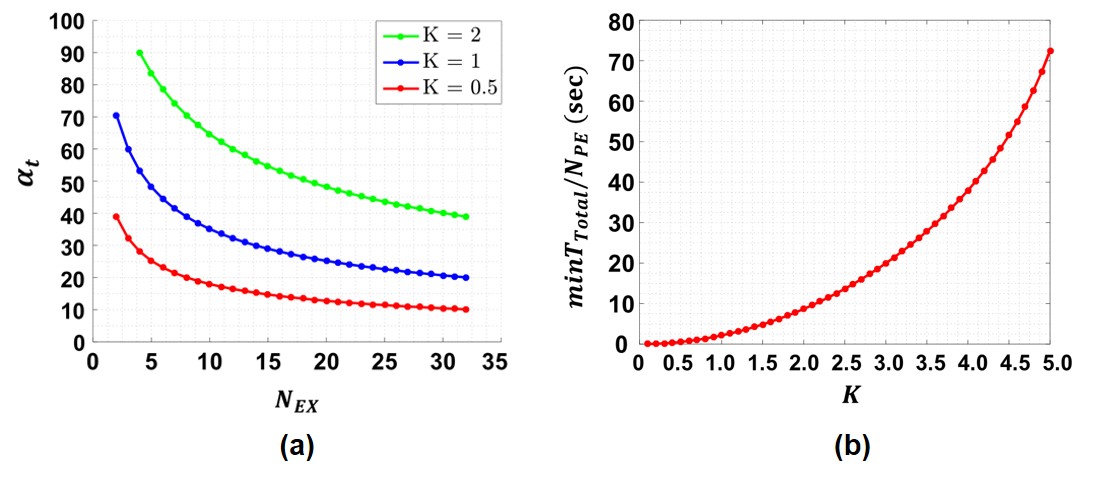
The $$$\alpha_t$$$ values calculated using Eq.10 for $$$K=0.5,\:1,\:2$$$ and different $$$N_{EX}$$$ are shown in Fig.4(a). Combining Eq.8 and Eq.10, the minimum total time per phase encoding ($$$minT_{Total}/N_{PE})\:\text{versus}\:K$$$ is shown in Fig.4(b).
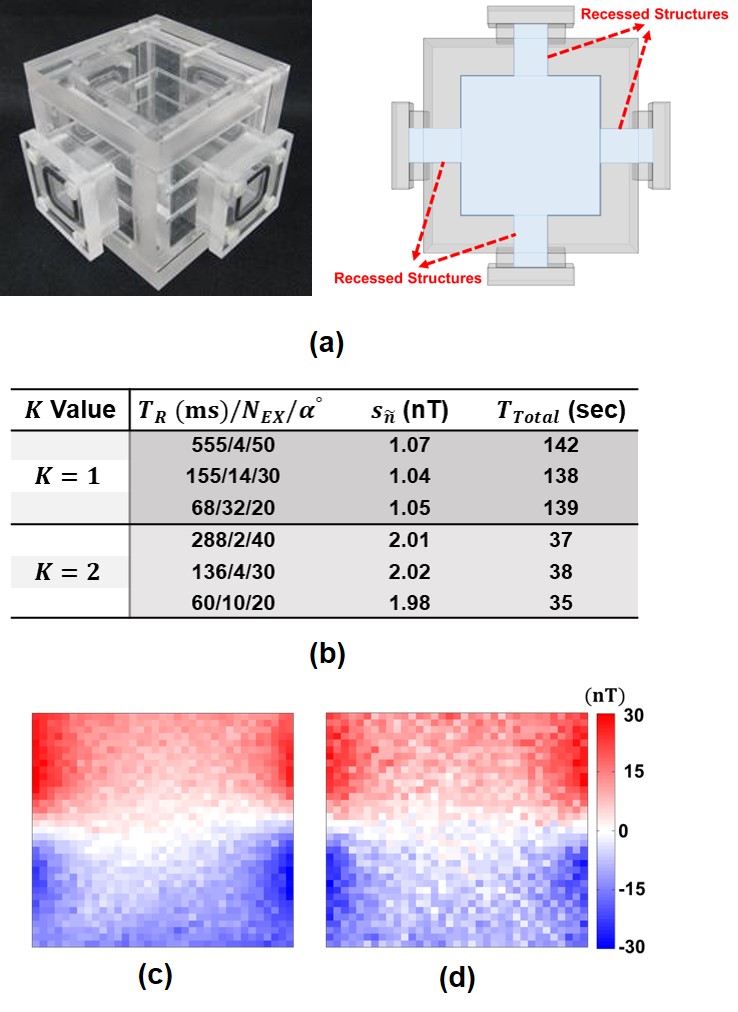
An imaging phantom with the dimensions of $$$80\times80\times80\:\text{mm}^3$$$ and four recessed structures (Fig.5(a)) is utilized to validate the analytical results of the proposed method experimentally. The ICNE-SPGE sequence parameters are given in Fig.1(b) for $$$K=0.5\:\text{and}\:K=1$$$. Using these parameters, the $$$\widetilde{B}_z$$$ distribution is acquired from the MRI complex signal. The estimated noise standard deviations of the $$$\widetilde{B}_z$$$ distribution ($$$s_{\widetilde{n}}$$$) using the method in12 are given in Fig.5(b). The measured $$$\widetilde{B}_z$$$ distributions using the two sets of sequence parameters $$$T_R/N_{EX}/\alpha=155/14/30\:(K=1)\:\text{and}\:T_R/N_{EX}/\alpha=136/4/30\:(K=0.5)$$$ are shown in Fig.5(c) and (d).
DISCUSSION & CONCLUSION
Fig.3 shows that the minimum acquisition time is achieved when $$$N_{EX}=N_{EX}^{max}$$$. However, utilizing an excessive $$$N_{EX}$$$ can cause spatial and temporal variations of the main magnetic field, a remarkable temperature increase due to eddy current heating of the radiofrequency shield, and temperature elevation induced around in the metallic prosthesis.13-16 Hence, instead of finding the minimum acquisition time, one may search for suboptimal points that provide similar acquisition times with smaller $$$N_{EX}$$$ and longer $$$T_R$$$ values for the same SNR level. Furthermore, using a lower number of $$$N_{EX}$$$ may provide a crucial benefit in the clinical application of current density and conductivity imaging. In MRCDI, a high $$$N_{EX}$$$ results in more electrical current exposure of the intended tissue. The results in Fig.5(b) for $$$K=1$$$ show that the estimated $$$s_{\widetilde{n}}$$$ of the three points with different parameter sets are close to each other in accordance with the results in Fig.3(a). Similarly, for the three local minimum points with $$$K=0.5$$$ in Fig.5(b) the estimated $$$s_{\widetilde{n}}$$$’s are close to each other and almost twice the estimated $$$s_{\widetilde{n}}$$$’s for the three points for $$$K=1$$$. Hence, the SNR estimated using the parameters sets for $$$K=1$$$ is almost twice the estimated SNR using the parameters for $$$K=0.5$$$. Therefore, the experimentally measured data validated the analytical results.Acknowledgements
This work is a part of the Ph.D. thesis study of Mehdi Sadighi. B. Murat Eyüboğlu is the thesis supervisor. Mert Şişman is a graduate student under the supervision of B. MuratEyüboğlu.
This study is funded by The Scientific and Technological Research Council of Turkey (TÜBİTAK) under Research Grant 116E157.
Experimental data were acquired using the facilities of UMRAM (National Magnetic Resonance Research Center), Bilkent University, Ankara, Turkey.
References
1. Limousin P, Krack P, Pollak P, Benazzouz A, Ardouin C, Hoffmann D, Benabid AL. Electrical stimulation of the subthalamic nucleus in advanced Parkinson's disease. N Engl J Med. 1998;339(16):1105-1111.
2. Miranda PC, Lomarev M, Hallett M. Modeling the current distribution during transcranial direct current stimulation. Clin Neurophysiol. 2006;117(7):1623-1629.
3. Wagner T, Fregni F, Fecteau S, Grodzinsky A, Zahn M, Pascual-Leone A. Transcranial direct current stimulation: a computer-based human model study. Neuroimage. 2007;35(3):1113-1124.
4. Neuling T, Wagner S, Wolters CH, Zaehle T, Herrmann CS. Finite-element model predicts current density distribution for clinical applications of tDCS and tACS. Frontiers in psychiatry. 2012;3(83):1-10.
5. Johnson MD, Lim HH, Netoff TI, Connolly AT, Johnson N, Roy A, Holt A, Lim KO, Carey JR, Vitek JL, et al. Neuromodulation for brain disorders: challenges and opportunities. IEEE Trans Biomed Eng. 2013;60(3):610-624.
6. Hömmen P, Storm JH, Höfner N, Körber R. Demonstration of full tensor current density imaging using ultra-low field MRI. Magn Reson Imaging. 2019;60:137-144.
7. Scott GC, Joy MLG, Armstrong RL, Henkelman RM. Sensitivity of Magnetic-Resonance Current-Density Imaging. J Magn Reson 1992;97(2):235-254.
8. Arpinar VE, Hamamura MJ, Degirmenci E, Muftuler LT. MREIT experiments with 200 µA injected currents: a feasibility study using two reconstruction algorithms, SMM and harmonic Bz. Phys Med Biol. 2012;57(13):4245-4261.
9. Göksu C, Scheffler K, Siebner HR, Thielscher A, Hanson LG. The stray magnetic fields in Magnetic Resonance Current Density Imaging (MRCDI). Physica Medica. 2019;59 :142-150.
10. Oh TI, Jeong WC, Kim JE, Sajib SZ, Kim HJ, Kwon O. Noise analysis in fast magnetic resonance electrical impedance tomography (MREIT) based on spoiled multi gradient echo (SPMGE) pulse sequence. Phys Med Biol. 2014;56(16):4723–4738.
11. Stanisz GJ, Odrobina EE, Pun J, Escaravage M, Graham SJ, Bronskill MJ, Henkelman RM. T1, T2 relaxation and magnetization transfer in tissue at 3T. Magn Reson Med: An Official Journal of the International Society for Magnetic Resonance in Medicine. 2005;54(3):507-512.
12. Sadleir R, Grant S, Zhang SU, Lee BI, Pyo HC, Oh SH, Park C, Woo EJ, Lee SY, Kwon O, et al. Noise analysis in magnetic resonance electrical impedance tomography at 3 and 11 T field strengths. Physiol Meas. 2005;26(5):875-884.
13. El-Sharkawy AM, Schar M, Bottomley P, Atalar E. Monitoring and correcting spatio-temporal variations of the MR. MAGMA. 2006;19(5):223-236.
14. Hidalgo‐Tobon SS. Theory of gradient coil design methods for magnetic resonance imaging. In: Concepts in Magnetic Resonance Part A. Vol 36A. 2010. p..223-242.
15. Zilberti L, Bottauscio O, Chiampi M, Hand J, Lopez HS, Brühl R, Crozier S. Numerical prediction of temperature elevation induced around metallic hip prostheses by traditional, split, and uniplanar gradient coils. Magn Reson Med. 2015;74(1):272-279.
16. Graf H, Steidle G, Schick F. Heating of metallic implants and instruments induced by gradient switching in a 1.5‐Tesla whole‐body unit. J Magn Reson Imaging: An Official Journal of the International Society for Magnetic Resonance in Medicine. 2007;26(5):1328-1333.
Figures