3767
Development of an online distortion measurement prototype
Lumeng Cui1, Johanna Grigo2, Gerald R. Moran3, and Niranjan Venugopal4
1Division of Biomedical Engineering, University of Saskatchewan, Saskatoon, SK, Canada, 2Universitätsklinikum Erlangen, Erlangen, Germany, 3Research Collaboration Manager, Siemens Healthcare Limited, Oakville, ON, Canada, 4Department of Radiology, University of Manitoba, Winnipeg, MB, Canada
1Division of Biomedical Engineering, University of Saskatchewan, Saskatoon, SK, Canada, 2Universitätsklinikum Erlangen, Erlangen, Germany, 3Research Collaboration Manager, Siemens Healthcare Limited, Oakville, ON, Canada, 4Department of Radiology, University of Manitoba, Winnipeg, MB, Canada
Synopsis
Magnetic Resonance Imaging (MRI) is increasingly essential in radiation therapy (RT) planning and so does the measurement of geometric distortion latent in MR imaging. In this work, we have developed a prototype that can accommodate any type of grid-like phantoms and provides an on-the-scanner software solution for the analysis of spatial distortion MR images. The prototype takes a prior CT scan and a new acquired MR dataset as inputs and generates a qualitative visualization and quantitative evaluation for the spatial distortion in the MRI volume. The prototype was assessed with two grid-like phantoms with good success.
Introduction
As Magnetic Resonance Imaging (MRI) is increasingly used in radiation therapy (RT) procedures, measuring MRI's geometric distortion has become more vital than usual. Even though MRI can provide superior soft-tissue contrast than Computed Tomography (CT), the former suffers spatial distortion which deteriorates with an increasing distance from the magnet iso-center, due to the nonlinearity of magnetic gradients1-3. Although vendor-supplied correction algorithms can help alleviate the spatial distortion, there is still a need to monitor any potential distortion that might jeopardize the safety and accuracy of the MRI imaging that is being incorporated into radiation treatment planning. In this regard, proper software and (grid-like) phantoms are indispensable for doing an accurate distortion measurement and long-term monitoring. However, most distortion analysis needs to be performed offline, which limits the quick and interactive tracking and measuring of the distortion. Therefore, in this work, we developed a novel online distortion measurement prototype that can potentially live in the scanner's ecosystem, allowing for an "on-the-fly" distortion assessment by the MR console or on a standalone analysis on offline Personal Computers (PC).Methods
The distortion measurement prototype was developed on the Syngo.via Frontier platform (Siemens Healthineers, Erlangen, Germany) and can be integrated into the Siemens MR's inline Syngo.via digital ecosystem or operate offline as standalone software available on a Windows system. The prototype requires a prior CT image of the phantom to be used as a gold standard reference image. Acquired MR images are compared against the gold standard reference, and the software computes the distortion as a function of distance from iso-center. The prototype's user interface and backend processing pipeline are described in Figure 1, and the methods for the extraction of grid-points are based on the approaches proposed by Stanescu et al.4. Two different types of distortion phantoms, containing orthogonal grids of rods, were used in this study to demonstrate the efficacy and versatility of the prototype. These phantoms include an anthropomorphic skull phantom (Model 603A, CIRS Inc, Norfolk, Virginia, USA) and a generic large field 2D phantom (Novel MR Distortion Phantom prototype, Siemens Healthineers, Erlangen, Germany). To summarize the distortion, the prototype uses the extracted grid-points of both CT and MR to provide not only an intuitive visual comparison but also a quantitative evaluation, including their calculated distortion deviations against the distance to iso-center with statistical information (i.e., minimum, maximum, and mean distortion).Results
Figures 2-3 show the distortion assessments produced by the developed prototype for the skull phantom and Siemens 2D large field phantom. Figures 2-3 a) show the results of the automatic rigid image registration displayed at the slice near the iso-center. The CT (blue) and MR (red) datasets are well matched. Figures 2-3 b) present the 3D rendering of the representations of the gridpoints' coordinate pairs (MR-magenta and CT-green) for each phantom, allowing for an overall visualization of the spatial distortion for users. For each phantom, Figures 2-3 c) and d) display the calculated coordinates which are positioned at the centers of the gridpoints of MR and CT image, respectively. Figures 2-3 c) and d) also exhibit the qualitative spatial distortion between the acquired MR compared to the reference CT. Figures 2-3 e) summarize a quantitative evaluation regarding the distortion measurement of MR for each phantom, including a distortion plot along with statistical information.Discussion
The software prototype requires, at minimum, a reference CT and a single MRI. By design, the software can analyze most types of grid-like phantoms as demonstrated in this work. This opens up the potential for users to 3D print their own phantom for custom use cases. The rigid image registration is the first step to ensure the accuracy of distortion measurement since a potential mis-registration between two modalities will bring additional spatial deviations. In the prototype, we perform a manual registration, followed by an auto-registration step, to minimize the spatial discrepancy. Otherwise, the auto-registration might prioritize the minimization of the spatial variation resulted from the geometric distortion. Once the proper registration is visually verified, the extraction method can effectively detect the gridpoints for either MR (Figures 2-3.c) or CT (Figures 2-3.d) in each phantom, despite differences in contrast between MR and CT. The distortion can then be inspected slice-by-slice in an orthogonal view or a perspective 3D view. Sometimes, the points might be misidentified due to imaging artifacts. This issue can be easily addressed by acquiring CT and MR images with more homogenous intensity, finer contrast, and higher resolution. Lastly, for the distortion plot, the 2D large field phantom suggests an inclining trend of increasing spatial distortion with increasing distance from the iso-center, which falls within our expectation. On the other hand, the skull phantom did not show a similar climbing trend because of the smaller field of view. In summary, accurate spatial distortion measurements, using our prototype, relies on high-quality images, which can be achieved using optimized CT and MR protocols.Conclusion
In this work, the developed novel online software prototype can provide automatic vivid visualization and quantitative evaluation of the spatial distortion for both small and large grid-like phantoms.Acknowledgements
The authors acknowledge Siemens Healthineers for their technical supports.References
- Chen L, Price Jr RA, Wang L, Li J, Qin L, McNeeley S, Ma CM, Freedman GM, Pollack A. MRI-based treatment planning for radiotherapy: dosimetric verification for prostate IMRT. International Journal of Radiation Oncology* Biology* Physics. 2004 Oct 1;60(2):636-47.
- Johnstone E, Wyatt JJ, Henry AM, Short SC, Sebag-Montefiore D, Murray L, Kelly CG, McCallum HM, Speight R. A systematic review of synthetic CT generation methodologies for use in MRI-only radiotherapy International Journal of Radiation Oncology* Biology* Physics.
- Mah D, Steckner M, Hanlon A, Freedman G, Milestone B, Mitra R, Shukla H, Movsas B, Horwitz E, Väisänen PP, Hanks GE. MRI simulation: effect of gradient distortions on three-dimensional prostate cancer plans. International Journal of Radiation Oncology* Biology* Physics. 2002 Jul 1;53(3):757-65.
- Stanescu T, Jans HS, Wachowicz K, Fallone BG. Investigation of a 3D system distortion correction method for MR images. Journal of applied clinical medical physics. 2010 Dec;11(1):200-16.
Figures
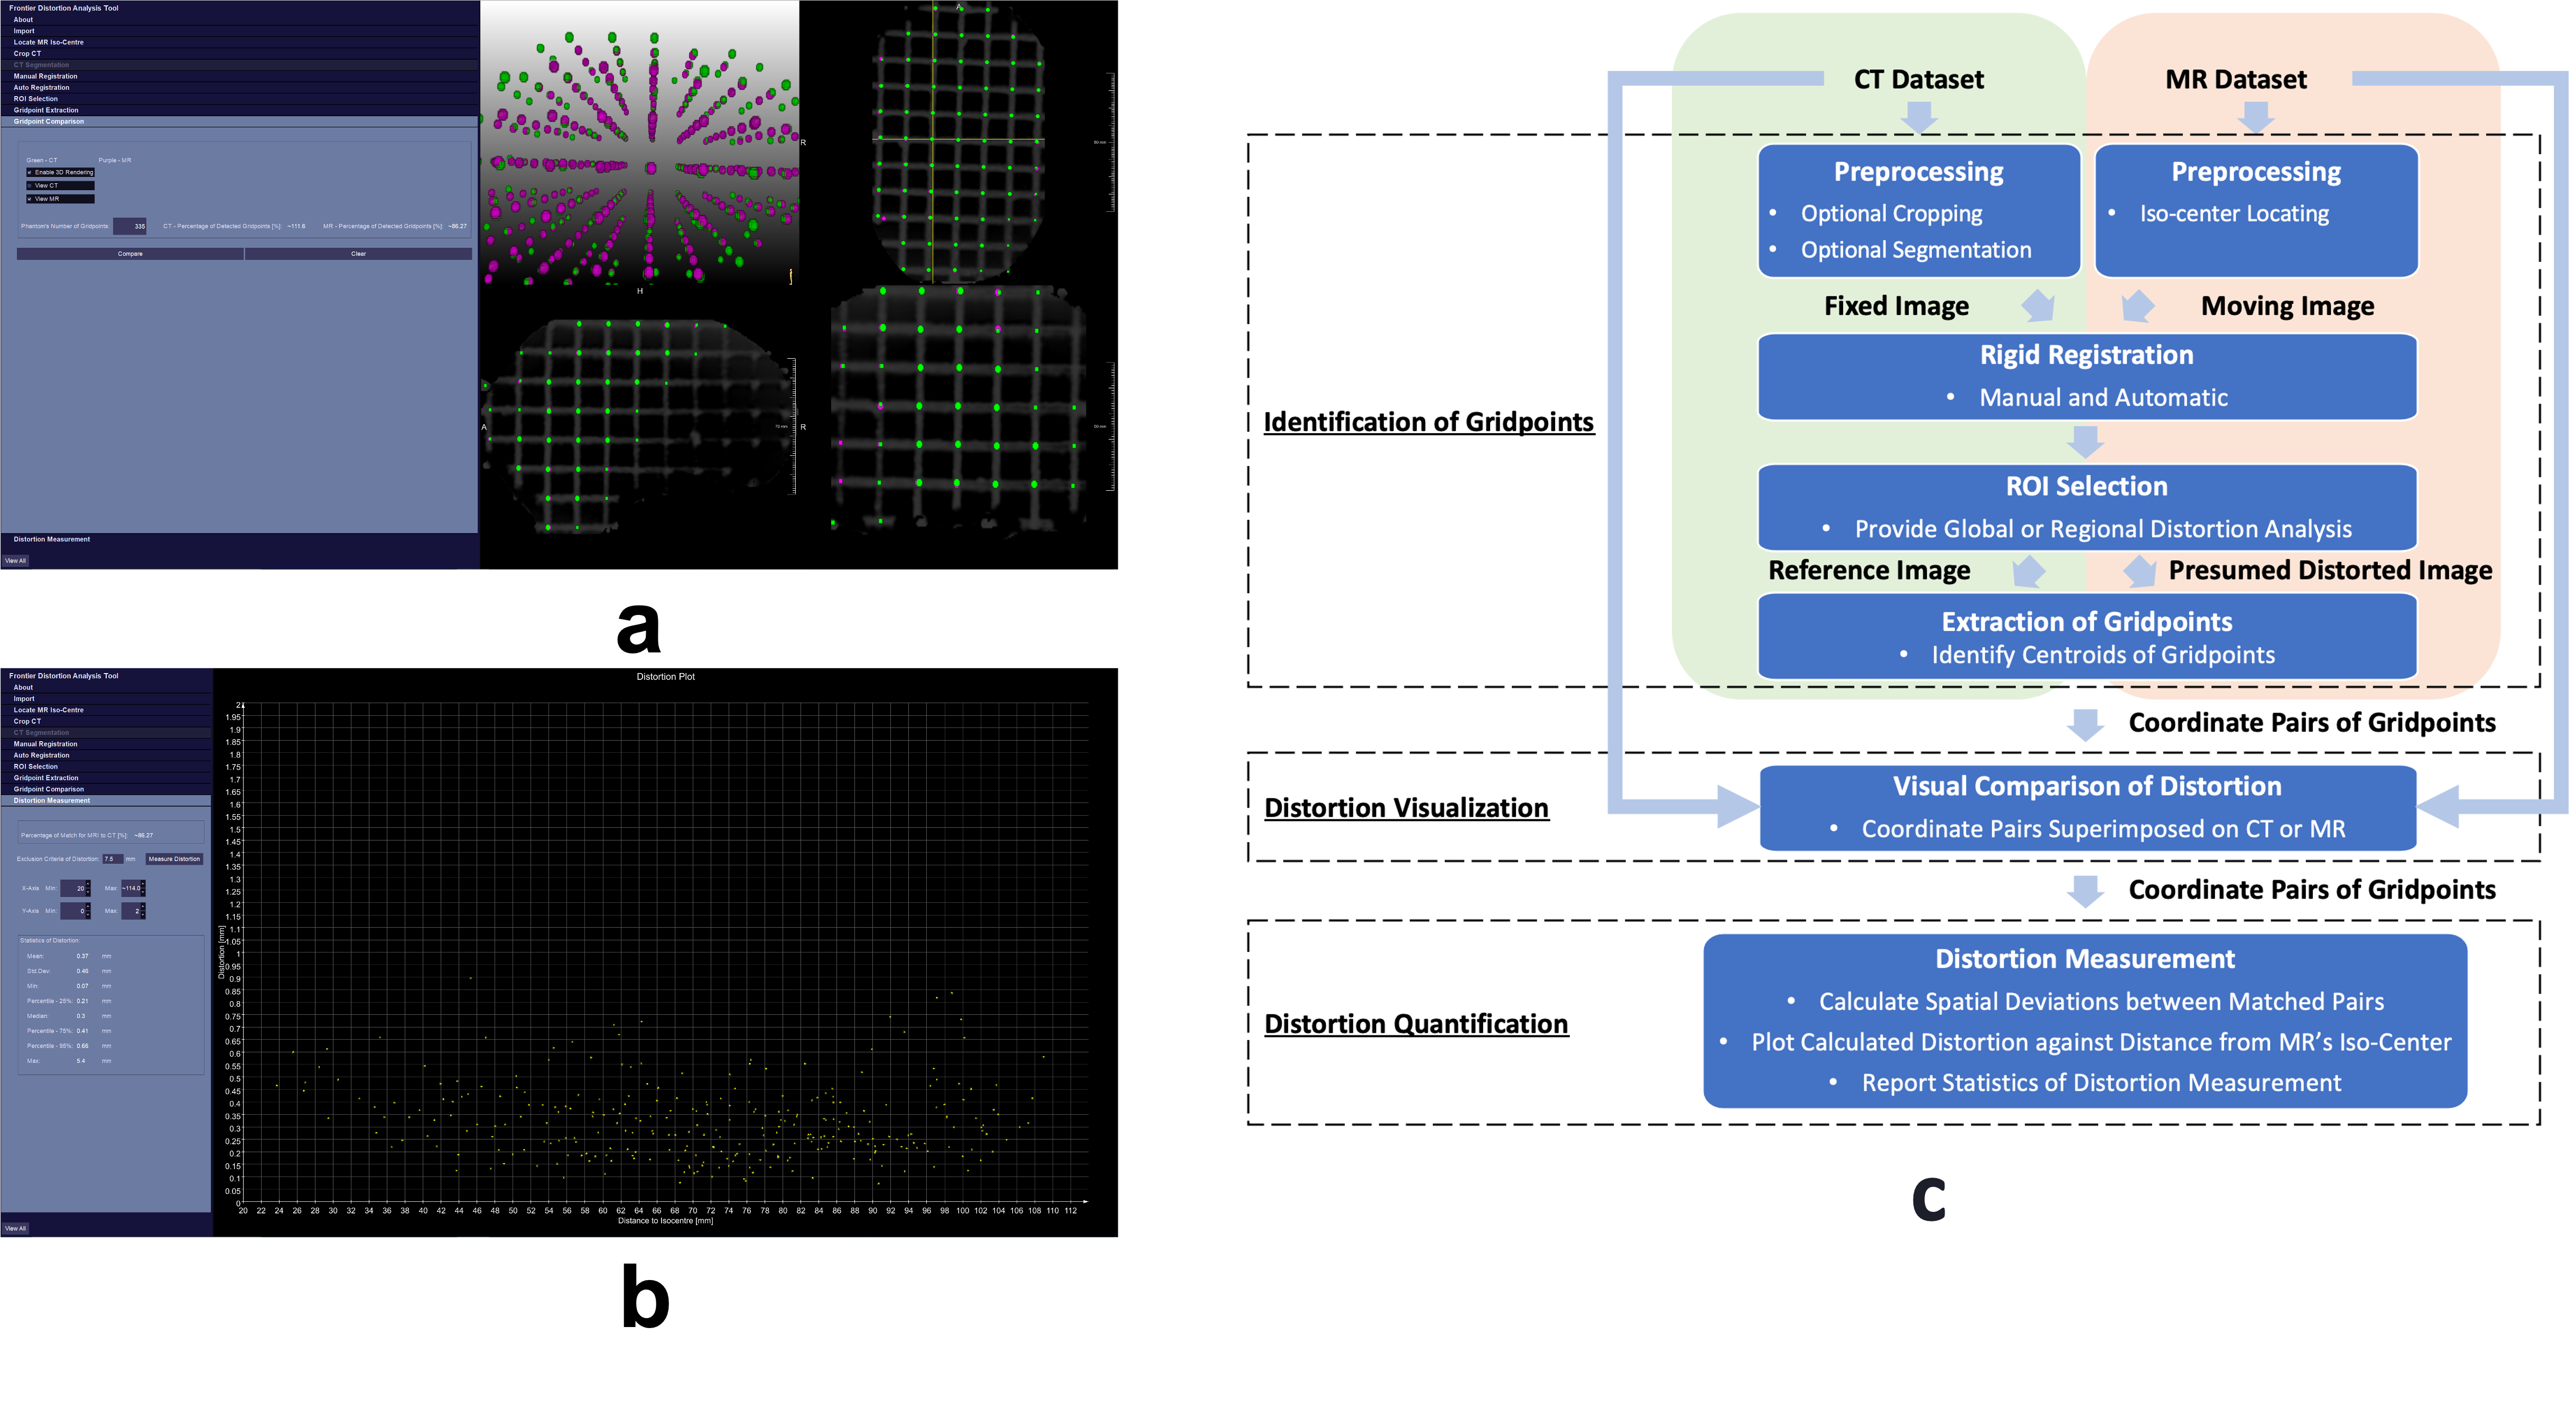
Figure 1. (a) User interface of the developed distortion measurement prototype with qualitative visualization; (b) user interface with quantitative evaluation; (c) backend pipeline of the developed distortion measurement prototype.
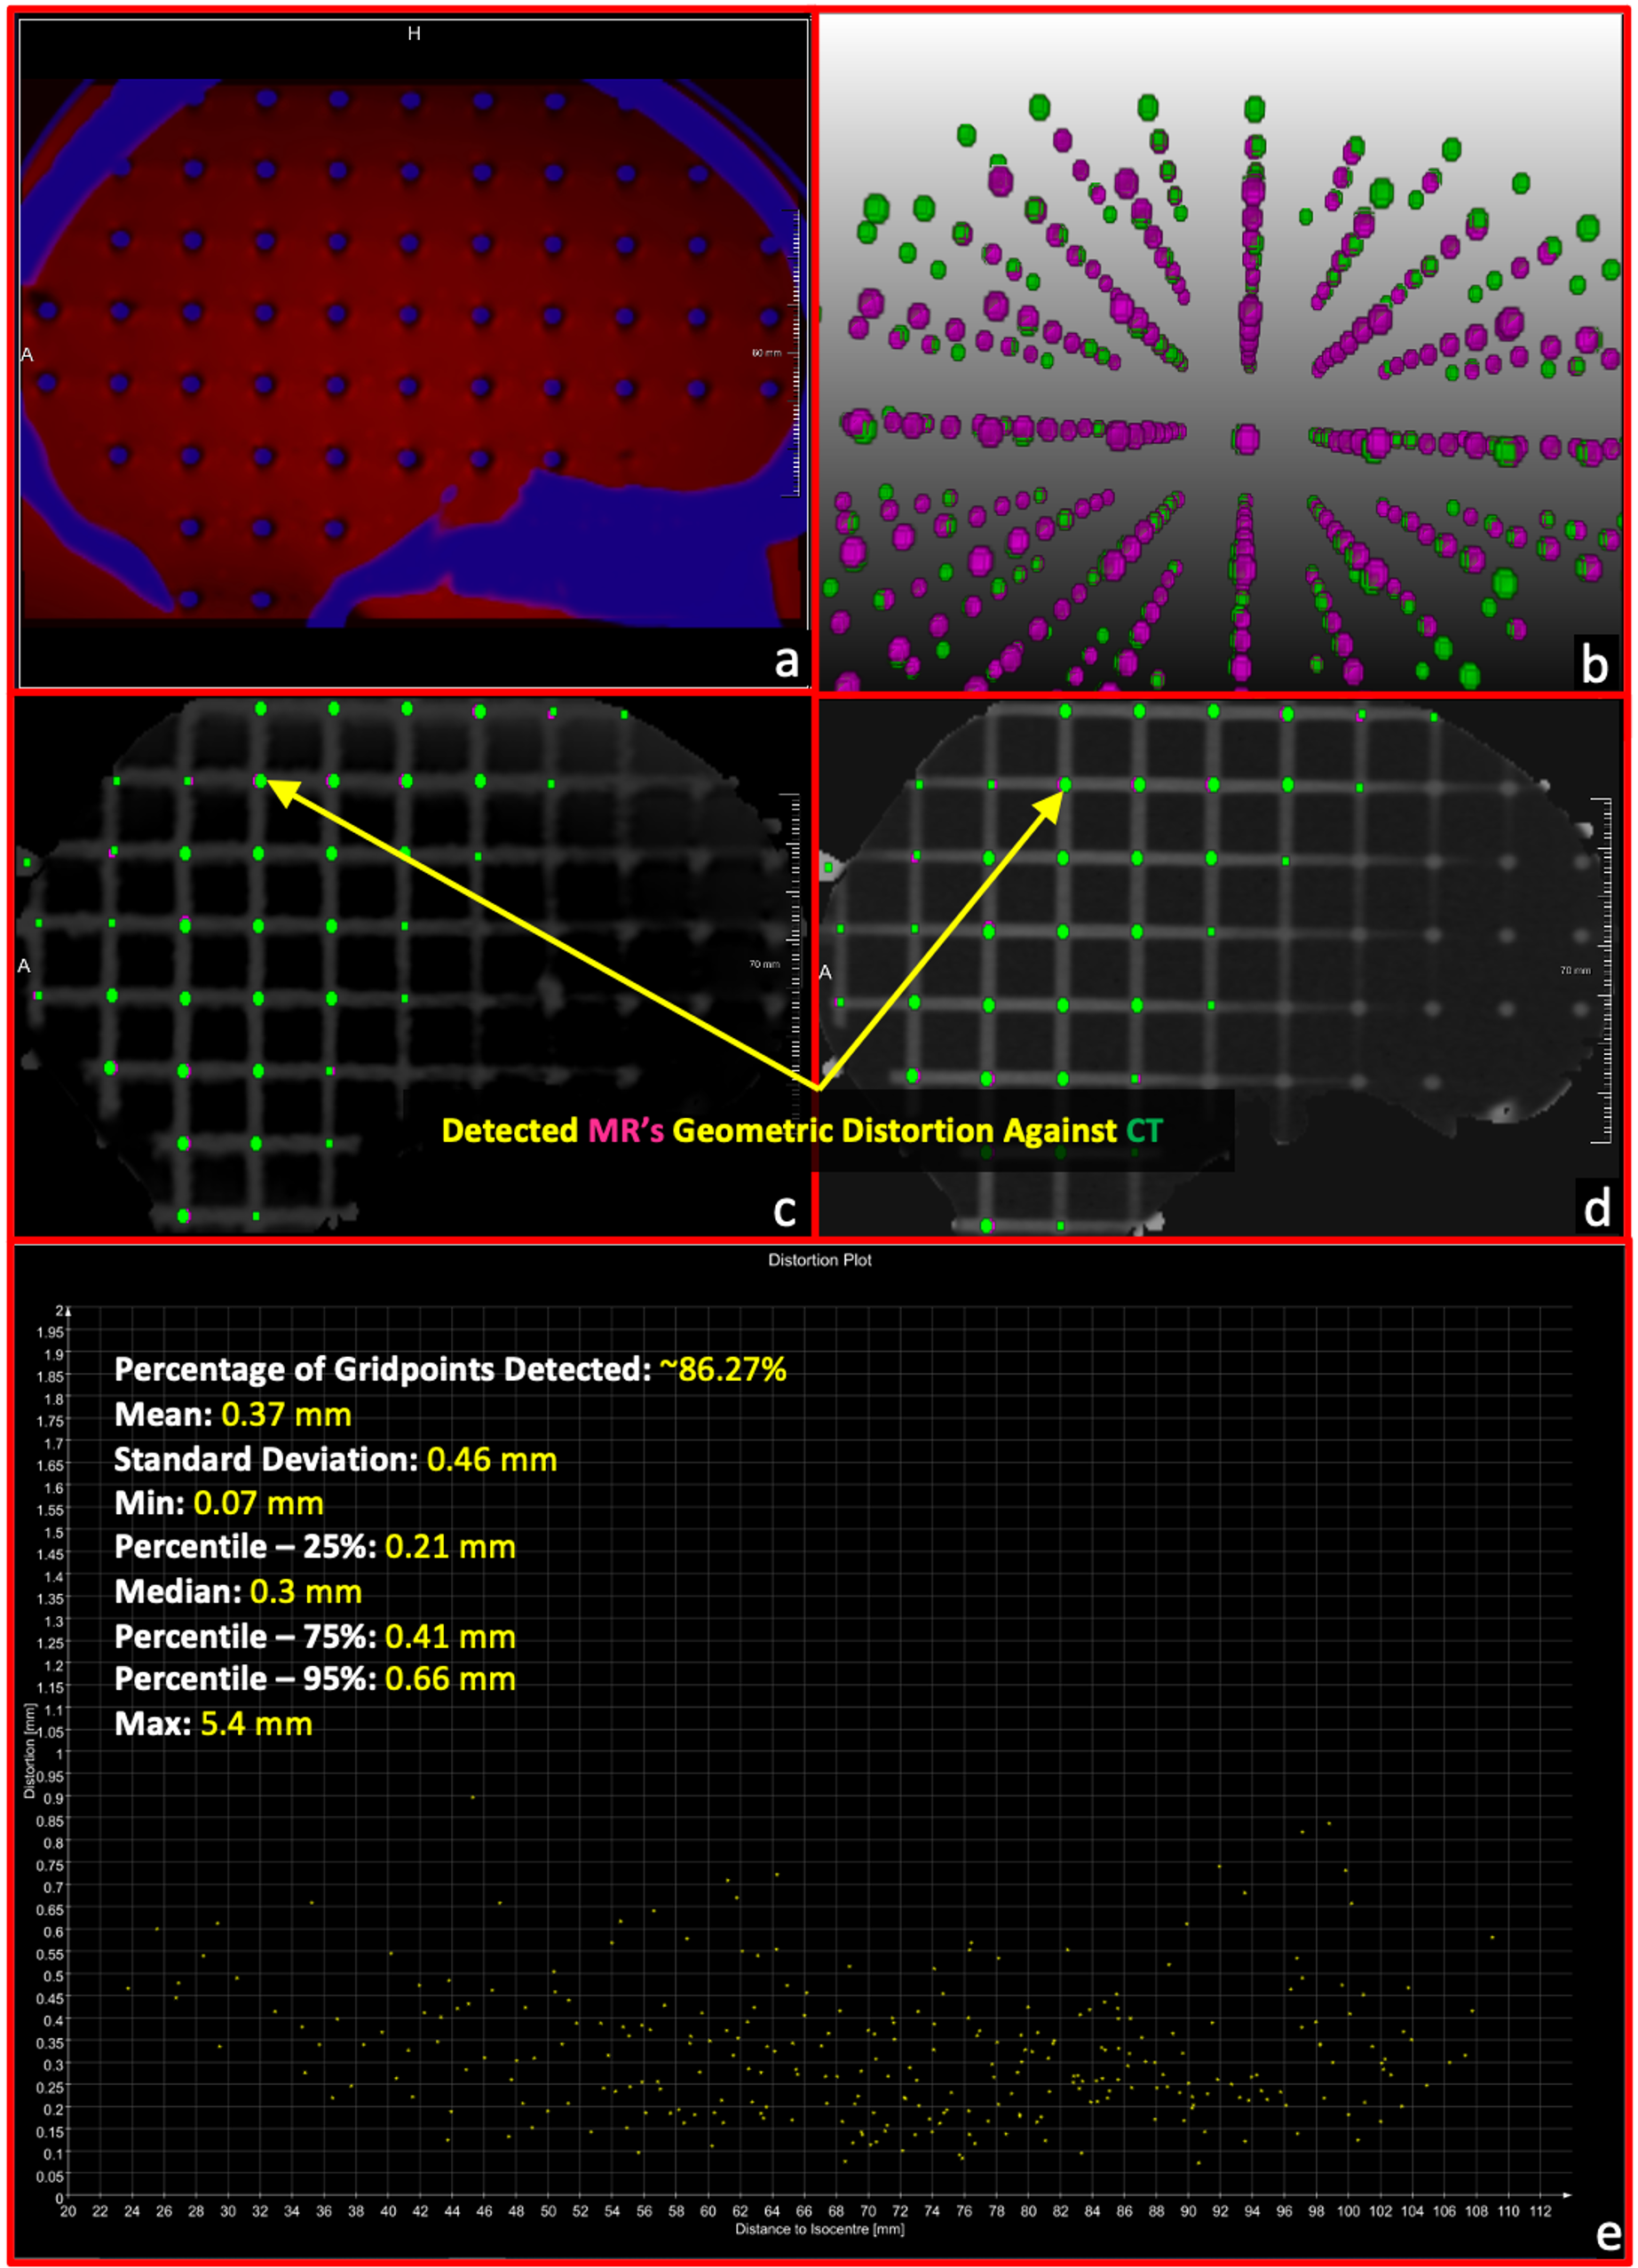
Figure 2. (a) Results of rigid registration displayed at the slice near the iso-center (red-MR and blue-CT), (b) 3D rendering of the representations of the gridpoints' coordinate pairs (MR-magenta and CT-green), (c) coordinate pairs superimposed on MR image, (d) coordinate pairs superimposed on CT image, and (e) distortion plot against the distance from the iso-center.
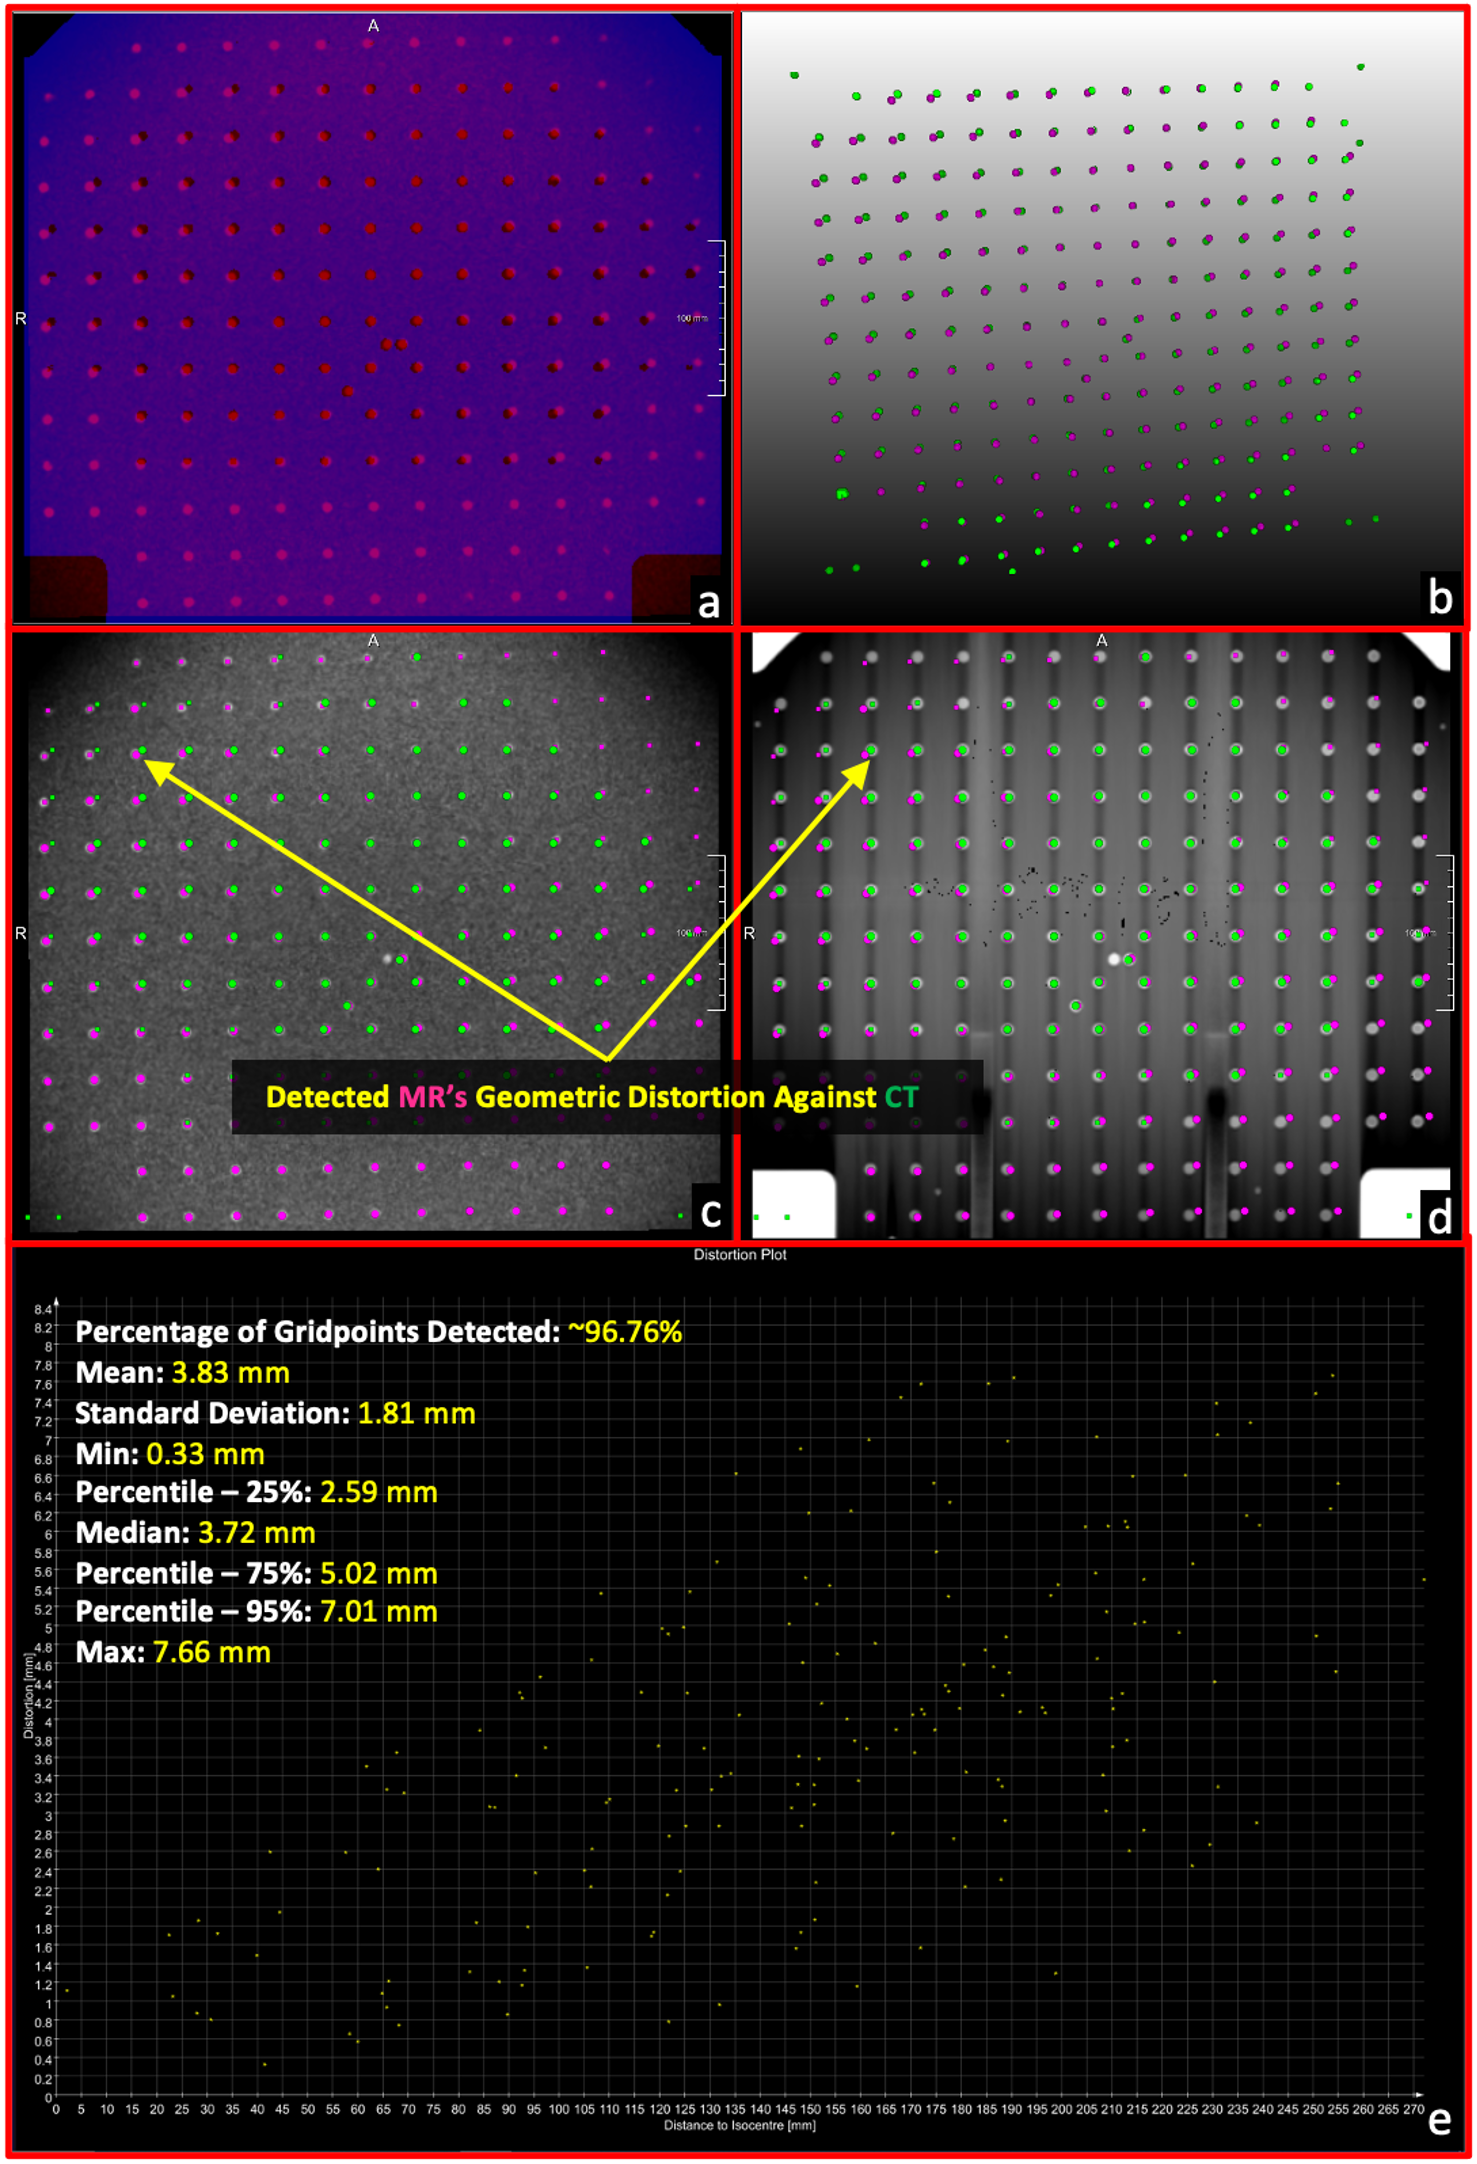
Figure 3. (a) Results of rigid registration displayed at the slice near the iso-center (red-MR and blue-CT), (b) 3D rendering of the representations of the gridpoints' coordinate pairs (MR-magenta and CT-green), (c) coordinate pairs superimposed on MR image, (d) coordinate pairs superimposed on CT image, and (e) distortion plot against the distance from the iso-center.