3766
Automating Reproducible Connectivity Processing Pipelines on High Performance Computing Machines1Neuroscience Program, University of Illinois at Urbana-Champaign, Urbana, IL, United States, 2Department of Bioengineering, University of Illinois at Urbana-Champaign, Urbana, IL, United States, 3Beckman Institute for Advanced Science and Technology, University of Illinois at Urbana-Champaign, Urbana, IL, United States, 4Decision Neuroscience Laboratory, University of Illinois at Urbana-Champaign, Urbana, IL, United States, 5Stephens Family Clinical Research Institute, Carle Foundation Hospital, Urbana, IL, United States
Synopsis
Automating pipelines open-source reproducible toolkit Docker containers for data quality control, processing, and analysis maximizes data value and minimizes time spent performing manual tests. Achieving high throughput with these pipelines requires more computational resources than a standard laboratory workstation, leading to migrating pipelines to high-performance computing systems. We created an open-source wrapper for higher security Singularity images required for resting-state functional connectivity workflows on high-performance computing systems, which extends function to report collection, network-based statistics, and versioning documentation. This pipeline was then tested with an existing aging and cognition data set for benchmarking and demonstration.
Introduction
Reproducible and standardized neuroimaging processing increases the value of research through clarity and specificity 1, but implementation of such processing remains an issue for many. Standards such as the Brain Imaging Data Structure (BIDS) allow for near plug-and-play compatibility with BIDS-compliant processing tools 2,3. Containerization facilitates incorporating these tools for in a standardized manner. Increasingly large datasets demand more substantial computing resources than standard laboratory workstations. High performance computing (HPC) systems are better suited for processing with high throughput, with pipelines in place optimizing automation of workflow from the scanner to the statistics. These pipelines provide data quality metrics at major stages of processing and minimize delay of decisions on more advanced statistical analysis. Recent advances in software virtualization have led to the creation of tools that permit open-source software to be safely containerized and run in HPC environments 4. In this work, we develop, apply, and disseminate containerized pipeline for automatically and reproducibly processing neuroimaging data in an HPC environment. We demonstrate the utility of this tool by applying it to data collected from an aging study.Methods
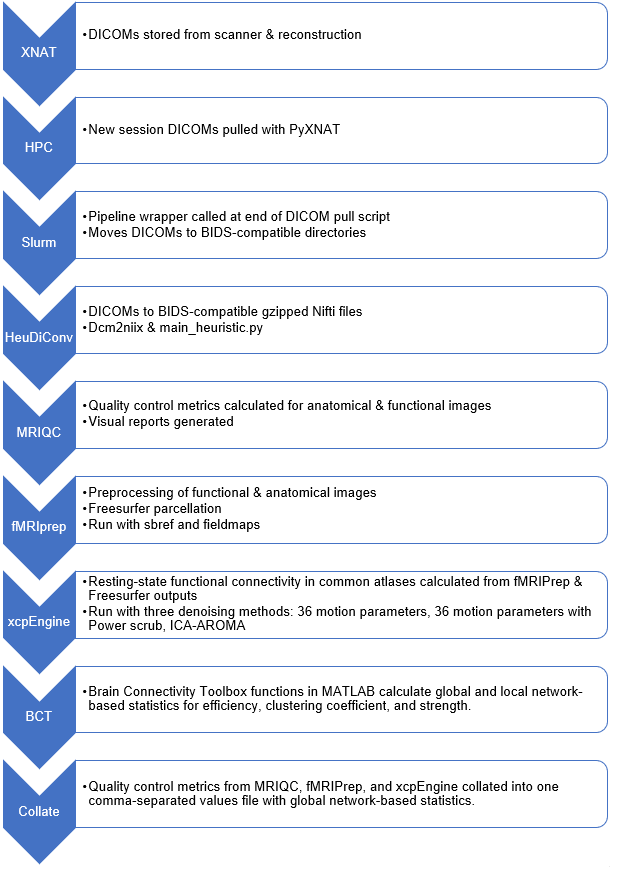
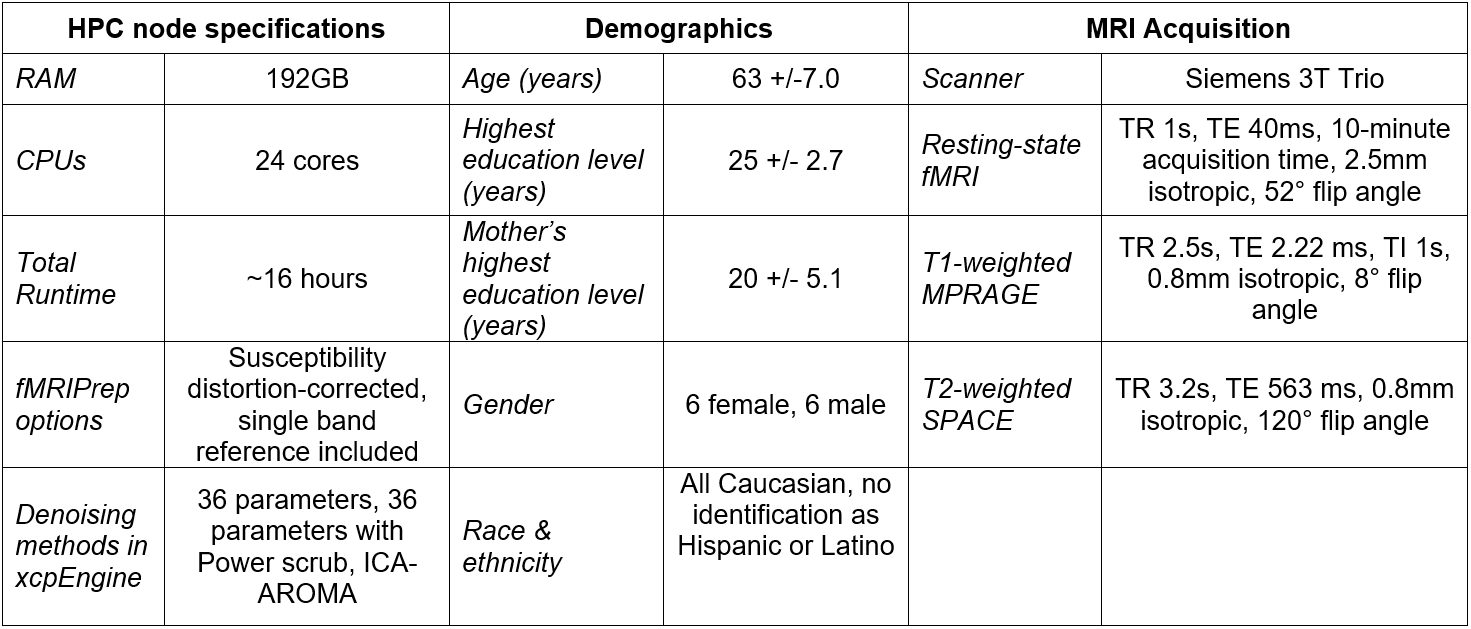
To investigate the efficacy of HPC workflows for reproducibly processing large-scale neuroimaging datasets, we combined open-source neuroimaging tools 5-13 into an automated, containerized pipeline, and deployed this pipeline in our Bright 9 (Bright Computing Inc., Amsterdam, Netherlands) HPC environment using Singularity 14 and Slurm 15 (see Figure 1 for dataflow).Initial testing and development of images was performed in Docker on a development workstation 16. Functioning containers were then converted to HPC-compatible Singularity containers and tested in the overall pipeline 14. To detect and minimize points of failure, we tested this pipeline during development using data from a cross-sectional pilot study of n = 12 older adults with 10-minute resting-state functional magnetic resonance imaging scans. Using three denoising designs in xcpEngine for resting-state functional connectivity (RSFC) processing 9,17,18, network-based statistics 19,20 were calculated in three atlases: AAL116 21, Desikan-Killiany 22, and Power 264 23.
Results
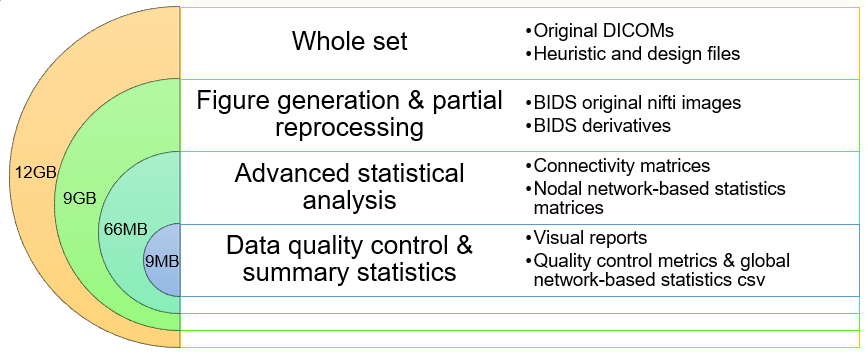
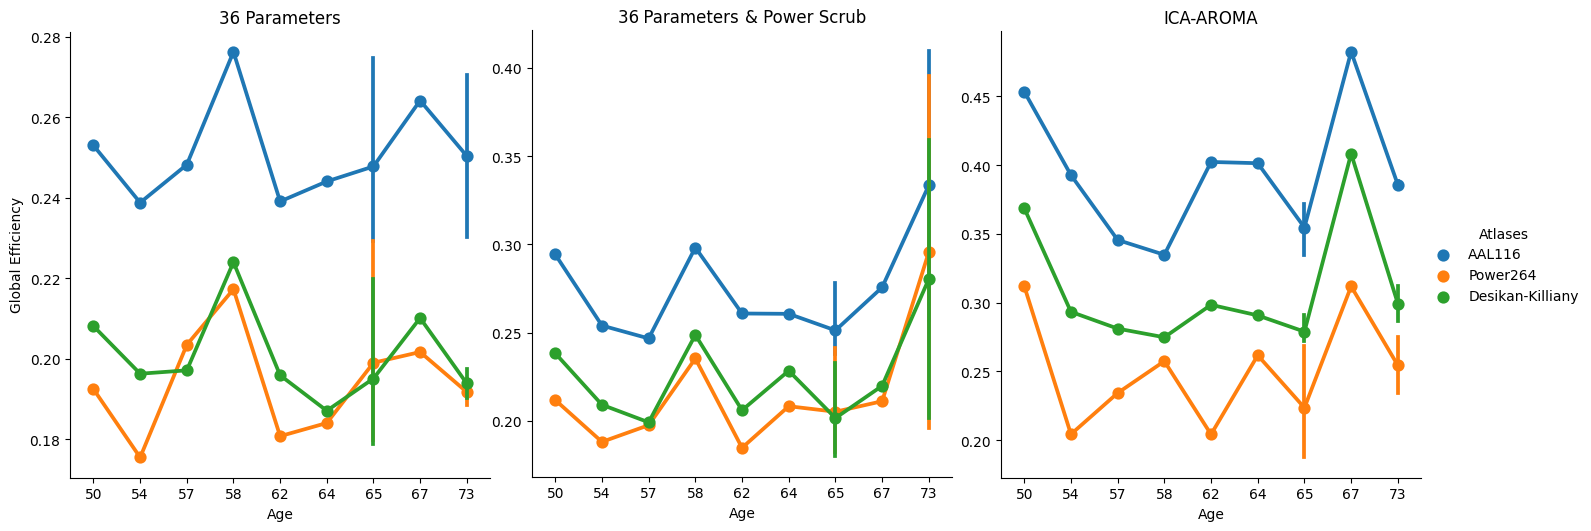
One problem for maintaining this pipeline workflow is the potential for compatibility issues when any developer makes updates to their container. Differences between Docker and Singularity in file system interactions also introduce errors that must be addressed through either bash shell scripting of core utility commands or through containerized Singularity images for Python and open-source programs. Run-times for major steps of the pipeline are recorded to a text file for estimating time needed to run similar data through the pipeline in the future and are provided in Figure 2 for the example data set along with cluster specifications. Managing data presentation to the end user follows a similar underlying principle. Files are pushed to server storage under directories that contain the level of detail necessary for each major level of analysis as follows (see Figure 3 for details of each level).Differences in parcellation according to atlas topology have influence over network-based measures24, such as global efficiency shown to decline in older adults25. Figure 4 shows this general trend as the size of nodes defined in an atlas decreases from AAL116 to the cortex-only Desikan-Killiany to the more highly parcellated Power264 functional atlas, showing functional agreement with node-size effects on network-based measures in structural connectivity24. However, we find strong agreement in global network measures, regardless of the parcellation for the comparison with age.
Discussion
This work demonstrates that a neuroimaging data can be automatically, reproducibly, and interpretably processed using containerized workflows in a short time-period. Using our pipeline, we showed several functional connectivity matrices can be generated and a variety of motion-robust processing approaches can be chosen to achieve state-of-the-art analyses. The processing and analysis tools used herein with BIDS-compatible data facilitate this automation, especially for non-neuroimaging experts. With this, we can see comparisons between global network measures and variables such as age can be examined directly from the produced outputs. Further, combinations of noise-robust approaches and parcellation schemes can be compared for global network measures.Centrally collecting visual reports and quality control metrics from major processing steps with summary statistics of connectivity, such as network-based statistics, as part of the pipeline allows for easier documentation and importation to study management systems such as Research Electronic Data Capture (REDCap)26,27. As the tools used for the pipeline constantly undergo development, the pipeline also requires a continuous development cycle to remain robust and up to the BIDS standard. Versioning of deployed pipelines is critical for data documentation, project management, and expedient re-analysis as tools improve in functionality or robustness.
Conclusion
Efficiency and replicability of workflows greatly improves through adopting naming standards such as BIDS and adapting BIDS apps for HPC environments. Our containerized, automated, and reproducible pipeline is in continuous development and can be accessed through GitHub at github.com/mrfil/pipeline-hpc. With extensive, automated processing in place, researchers can efficiently assess QC measures on data and can focus on asking higher level questions about their neuroimaging data, rather than spending time on basic analysis steps. This pipeline framework can also serve diffusion-weighted imaging analysis and other BIDS-compatible workflows.Acknowledgements
The development of this pipeline and the computing infrastructure upon which it runs was the result of collaboration between many faculty, research associates, graduate students, and staff of the Biomedical Imaging Center and Information Technology Services at the Beckman Institute for Advanced Science and Technology at the University of Illinois at Urbana-Champaign. We extend our gratitude to all participants of the CU’s Got Brains study. This work was funded by a grant from the Beckman Institute for Advanced Science and Technology and the Interdisciplinary Health Sciences Institute at the University of Illinois at Urbana-Champaign.References
1. Poldrack RA, Baker CI, Durnez J, Gorgolewski KJ, Matthews PM, Munafo MR, Nichols TE, Poline JB, Vul E, Yarkoni T. Scanning the horizon: towards transparent and reproducible neuroimaging research. Nature reviews Neuroscience 2017;18(2):115-126.
2. Gorgolewski KJ, Auer T, Calhoun VD, Craddock RC, Das S, Duff EP, Flandin G, Ghosh SS, Glatard T, Halchenko YO, Handwerker DA, Hanke M, Keator D, Li X, Michael Z, Maumet C, Nichols BN, Nichols TE, Pellman J, Poline JB, Rokem A, Schaefer G, Sochat V, Triplett W, Turner JA, Varoquaux G, Poldrack RA. The brain imaging data structure, a format for organizing and describing outputs of neuroimaging experiments. Scientific data 2016;3:160044.
3. Gorgolewski KJ, Alfaro-Almagro F, Auer T, Bellec P, Capota M, Chakravarty MM, Churchill NW, Cohen AL, Craddock RC, Devenyi GA, Eklund A, Esteban O, Flandin G, Ghosh SS, Guntupalli JS, Jenkinson M, Keshavan A, Kiar G, Liem F, Raamana PR, Raffelt D, Steele CJ, Quirion PO, Smith RE, Strother SC, Varoquaux G, Wang Y, Yarkoni T, Poldrack RA. BIDS apps: Improving ease of use, accessibility, and reproducibility of neuroimaging data analysis methods. PLoS computational biology 2017;13(3):e1005209.
4. Combe TM, A.; Di Pietro, R. To Docker or not to Docker: A security perspective. IEEE Cloud Computing 2016;3(5):54-62.
5. Esteban O, Blair RW, Nielson DM, Varada JC, Marrett S, Thomas AG, Poldrack RA, Gorgolewski KJ. Crowdsourced MRI quality metrics and expert quality annotations for training of humans and machines. Scientific data 2019;6(1):30.
6. Li X, Morgan PS, Ashburner J, Smith J, Rorden C. The first step for neuroimaging data analysis: DICOM to NIfTI conversion. Journal of neuroscience methods 2016;264:47-56.
7. Schwartz Y, Barbot A, Thyreau B, Frouin V, Varoquaux G, Siram A, Marcus DS, Poline JB. PyXNAT: XNAT in Python. Frontiers in neuroinformatics 2012;6:12.
8. Esteban O, Markiewicz CJ, Blair RW, Moodie CA, Isik AI, Erramuzpe A, Kent JD, Goncalves M, DuPre E, Snyder M, Oya H, Ghosh SS, Wright J, Durnez J, Poldrack RA, Gorgolewski KJ. fMRIPrep: a robust preprocessing pipeline for functional MRI. Nature methods 2019;16(1):111-116.
9. Ciric R, Wolf DH, Power JD, Roalf DR, Baum GL, Ruparel K, Shinohara RT, Elliott MA, Eickhoff SB, Davatzikos C, Gur RC, Gur RE, Bassett DS, Satterthwaite TD. Benchmarking of participant-level confound regression strategies for the control of motion artifact in studies of functional connectivity. NeuroImage 2017;154:174-187.
10. Abraham A, Pedregosa F, Eickenberg M, Gervais P, Mueller A, Kossaifi J, Gramfort A, Thirion B, Varoquaux G. Machine learning for neuroimaging with scikit-learn. Frontiers in neuroinformatics 2014;8:14.
11. Gorgolewski K, Burns CD, Madison C, Clark D, Halchenko YO, Waskom ML, Ghosh SS. Nipype: a flexible, lightweight and extensible neuroimaging data processing framework in python. Frontiers in neuroinformatics 2011;5:13.
12. Tustison NJ, Avants BB, Cook PA, Zheng Y, Egan A, Yushkevich PA, Gee JC. N4ITK: improved N3 bias correction. IEEE transactions on medical imaging 2010;29(6):1310-1320.
13. Zhang Y, Brady M, Smith S. Segmentation of brain MR images through a hidden Markov random field model and the expectation-maximization algorithm. IEEE transactions on medical imaging 2001;20(1):45-57.
14. Kurtzer GM, Sochat V, Bauer MW. Singularity: Scientific containers for mobility of compute. PloS one 2017;12(5):e0177459.
15. Yoo ABJ, M.A.; Grondona, M. Slurm: Simple linux utility for resource management. Workship on Job Scheduling Strategies for Parallel Processing: Springer; 2003. p 44-60.
16. Merkel D. Docker: lightweight linux containers for consistent development and deployment. Linux Journal 2014;2014(239):2.
17. Power JD, Mitra A, Laumann TO, Snyder AZ, Schlaggar BL, Petersen SE. Methods to detect, characterize, and remove motion artifact in resting state fMRI. NeuroImage 2014;84:320-341.
18. Pruim RHR, Mennes M, van Rooij D, Llera A, Buitelaar JK, Beckmann CF. ICA-AROMA: A robust ICA-based strategy for removing motion artifacts from fMRI data. NeuroImage 2015;112:267-277.
19. Rubinov M, Sporns O. Complex network measures of brain connectivity: uses and interpretations. NeuroImage 2010;52(3):1059-1069.
20. Bullmore E, Sporns O. Complex brain networks: graph theoretical analysis of structural and functional systems. Nature Reviews Neuroscience 2009;10(3):186-198.
21. Tzourio-Mazoyer N, Landeau B, Papathanassiou D, Crivello F, Etard O, Delcroix N, Mazoyer B, Joliot M. Automated anatomical labeling of activations in SPM using a macroscopic anatomical parcellation of the MNI MRI single-subject brain. NeuroImage 2002;15(1):273-289.
22. Desikan RS, Segonne F, Fischl B, Quinn BT, Dickerson BC, Blacker D, Buckner RL, Dale AM, Maguire RP, Hyman BT, Albert MS, Killiany RJ. An automated labeling system for subdividing the human cerebral cortex on MRI scans into gyral based regions of interest. NeuroImage 2006;31(3):968-980.
23. Power JD, Cohen AL, Nelson SM, Wig GS, Barnes KA, Church JA, Vogel AC, Laumann TO, Miezin FM, Schlaggar BL, Petersen SE. Functional network organization of the human brain. Neuron 2011;72(4):665-678.
24. Zalesky A, Fornito A, Harding IH, Cocchi L, Yucel M, Pantelis C, Bullmore ET. Whole-brain anatomical networks: does the choice of nodes matter? NeuroImage 2010;50(3):970-983.
25. Achard S, Bullmore E. Efficiency and cost of economical brain functional networks. PLoS computational biology 2007;3(2):e17.
26. Harris PA, Taylor R, Thielke R, Payne J, Gonzalez N, Conde JG, Research electronic data capture (REDCap) – A metadata-driven methodology and workflow process for providing translational research informatics support. Journal of Biomedical Informatics 2009 Apr;42(2):377-81.
27. Harris PA, Taylor R, Minor BL, Elliott V, Fernandez M, O'Neal L, McLeod L, Delacqua G, Delacqua F, Kirby J, Duda SN, REDCap Consortium. The REDCap consortium: Building an international community of software partners. Journal of Biomedical Informatics 2019;95:103208
Figures