3765
UKRIN Kidney Analysis Toolbox (UKAT): A Framework for Harmonized Quantitative Renal MRI Analysis1Sir Peter Mansfield Imaging Centre, University of Nottingham, Nottingham, United Kingdom, 2Great Ormond Street Institute of Child Health, University College London, London, United Kingdom, 3Department of Infection, Immunity and Cardiovascular Disease, University of Sheffield, Sheffield, United Kingdom, 4Department of Radiology, University of Cambridge, Cambridge, United Kingdom, 5Department of Radiology, Addenbrooke’s Hospital, Cambridge, United Kingdom, 6Neuroradiological Academic Unit, UCL Queen Square Institute of Neurology, University College London, London, United Kingdom, 7Dementia Research Centre, UCL Queen Square Institute of Neurology, University College London, London, United Kingdom, 8Wellcome Centre for Human Neuroimaging, UCL Queen Square Institute of Neurology, University College London, London, United Kingdom
Synopsis
Multicentre validation studies are key to the clinical translation of renal MRI and as such, the development of harmonised, cross vendor protocols is crucial. To process data acquired from these protocols, the UK Renal Imaging Network Kidney Analysis Toolbox (UKAT) has been developed. This open-source, vendor agnostic and easy to use Python package can be used for image registration, field mapping, relaxometry and diffusion mapping. UKATs combination of robust software, documented methodological decisions and easy to follow tutorials means we envisage this as a useful tool for the renal and abdominal imaging community.
Introduction
The potential of renal MRI biomarkers for characterisation of disease is increasingly recognised. However for clinical translation to be realised, multicentre validation studies must be undertaken1. The UK Renal Imaging Network – MRI Acquisition and Processing Standardisation (UKRIN-MAPS) project aims to develop harmonised acquisition and analysis protocols across vendors (GE, Philips, Siemens)2,3. Vendors and some diagnostic companies provide tools to calculate quantitative maps for certain sequences, but these methods are typically closed-source and are a potential cause of variability in multi-vendor studies. In this work, we outline an open-source Python toolbox, UKAT (UKRIN Kidney Analysis Toolbox)4 developed within UKRIN-MAPS for processing renal MRI data generated from harmonized UKRIN acquisition protocols. The protocols align with renal consensus papers1, but UKAT has the flexibility to be applied to other quantitative acquisition protocols and areas of the anatomy. This modular, fully documented, and tested toolbox can be downloaded from https://github.com/UKRIN-MAPS/ukat.Software Specifications
Robust methods and reliable, well documented and open software are key to standardisation of image analysis. UKAT is built with these aims in mind.Language and licensing: Written in Python, a freely available language, UKAT avoids the licencing costs associated with other languages popular in the MRI community and provides an accessible and easily extensible codebase to encourage collaboration.
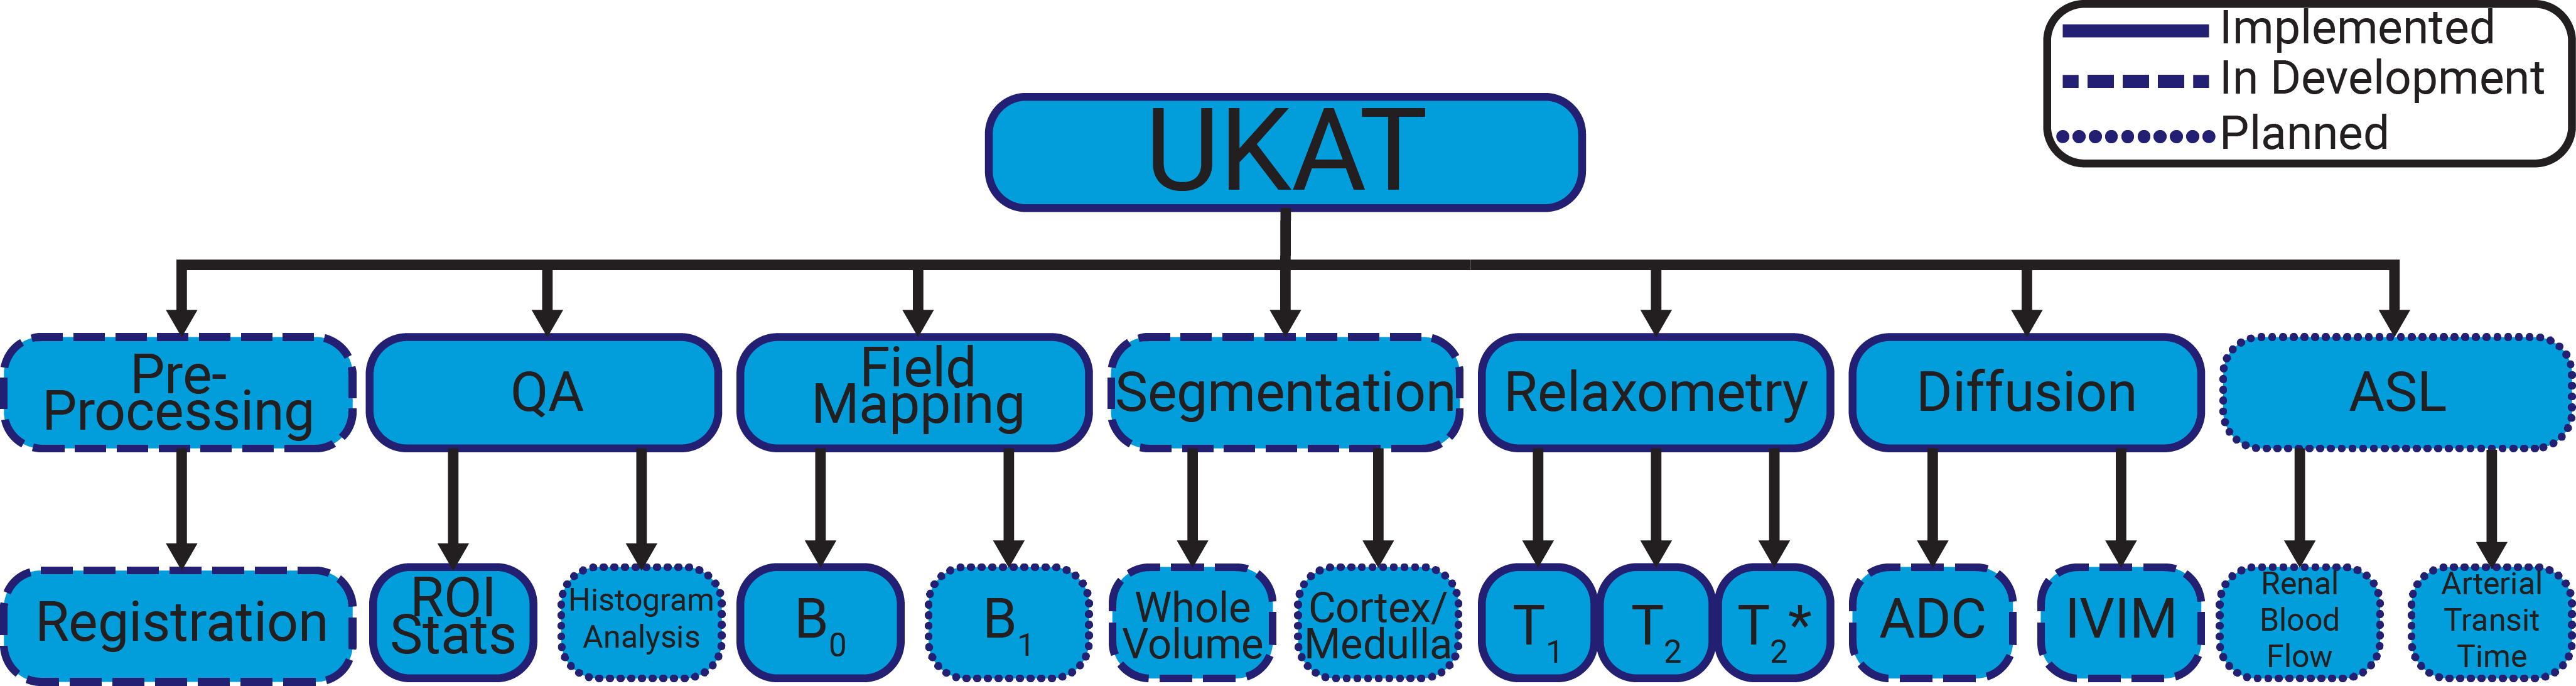
Functionality: UKAT covers all steps in the processing of quantitative renal MRI data, from image registration and tissue segmentation to quantitative map calculations. An overview of the software is shown in Figure 1. Although designed primarily for application to the kidney, many of the methods implemented can be applied to other areas of anatomy. Potential pitfalls when applying analysis methods to other areas are highlighted—for instance if a significant proportion of the image contains voxels of short T2* (e.g. when applied to the liver of patients with iron overload) the software flags that the user should consider a fitting method that is more accurate at short T2* values but computationally more intensive.
Documentation and tutorials: To aid adoption, for each analysis pipeline, a comprehensive Jupyter Notebook tutorial and example data for all core UKAT features is provided. To provide confidence in the software and increase reproducibility, the methodological decisions are documented. Where multiple analysis approaches have been compared, all practicable methods remain options in the software.
Unit testing: Automated continuous integration routines are implemented to ensure rigorous testing upon modifications to the codebase and to ensure compatibility and consistency between releases.
Software Features
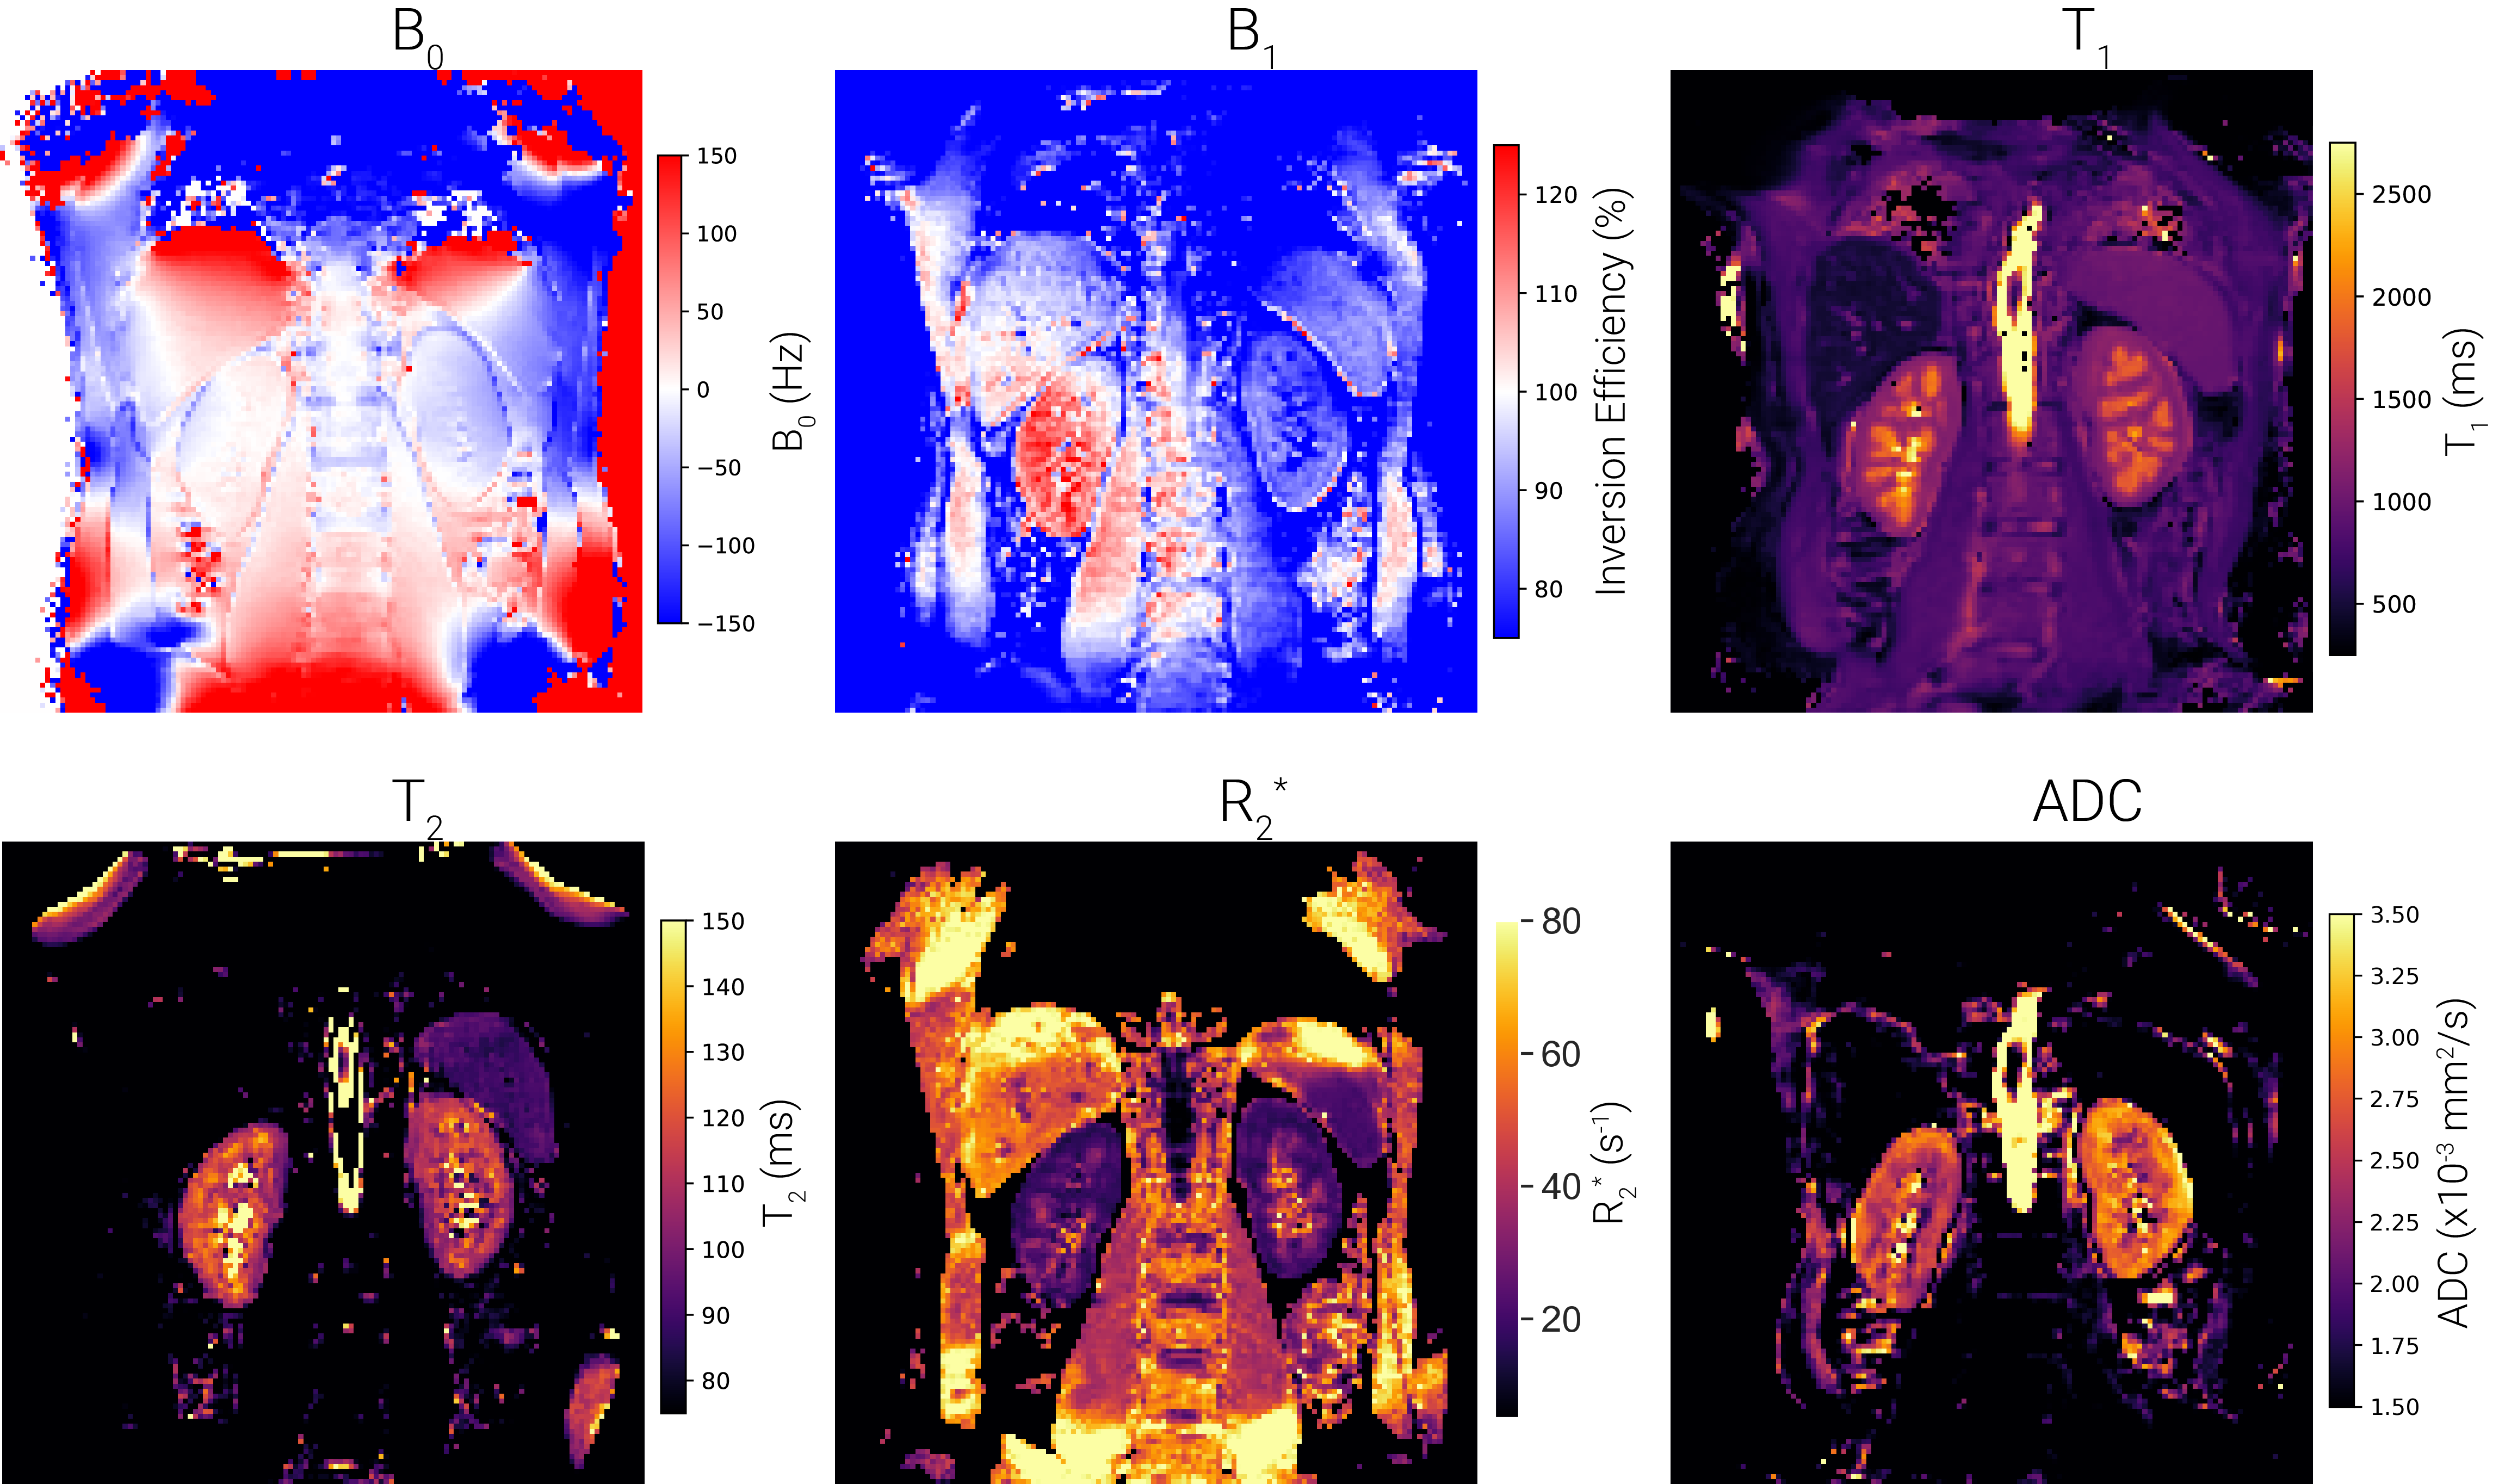
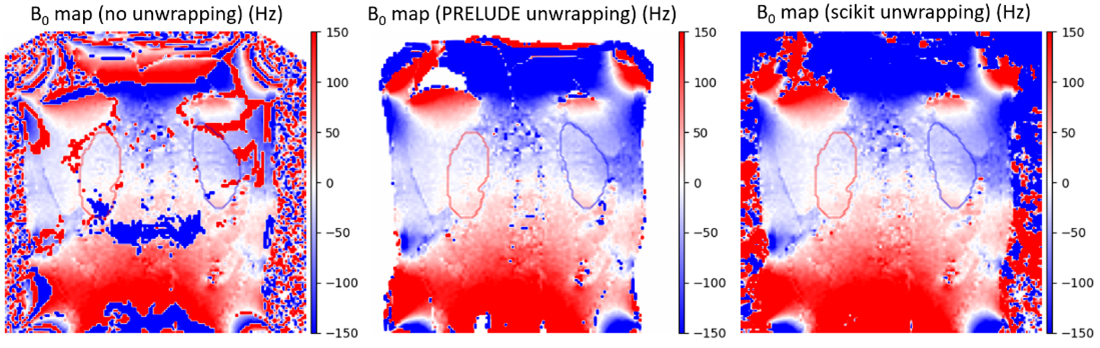
Methods currently implemented in UKAT include B0-mapping, T1-mapping, T2-mapping, T2*/R2*-mapping and mapping of diffusion metrics. Examples of quantitative images generated using the UKRIN protocol and UKAT are shown in Figure 2.Dual-echo B0 mapping has been implemented after a comparison between gold standard FSL Prelude5 and scikit-image’s6 phase unwrapping tools. It was found that scikit-image’s performance was comparable to Prelude’s when comparing B0 offset across the kidneys within a subject and thus, in the interests of minimising dependencies and maximising operating system compatibility, scikit-image’s unwrapping was chosen (Figure 3).
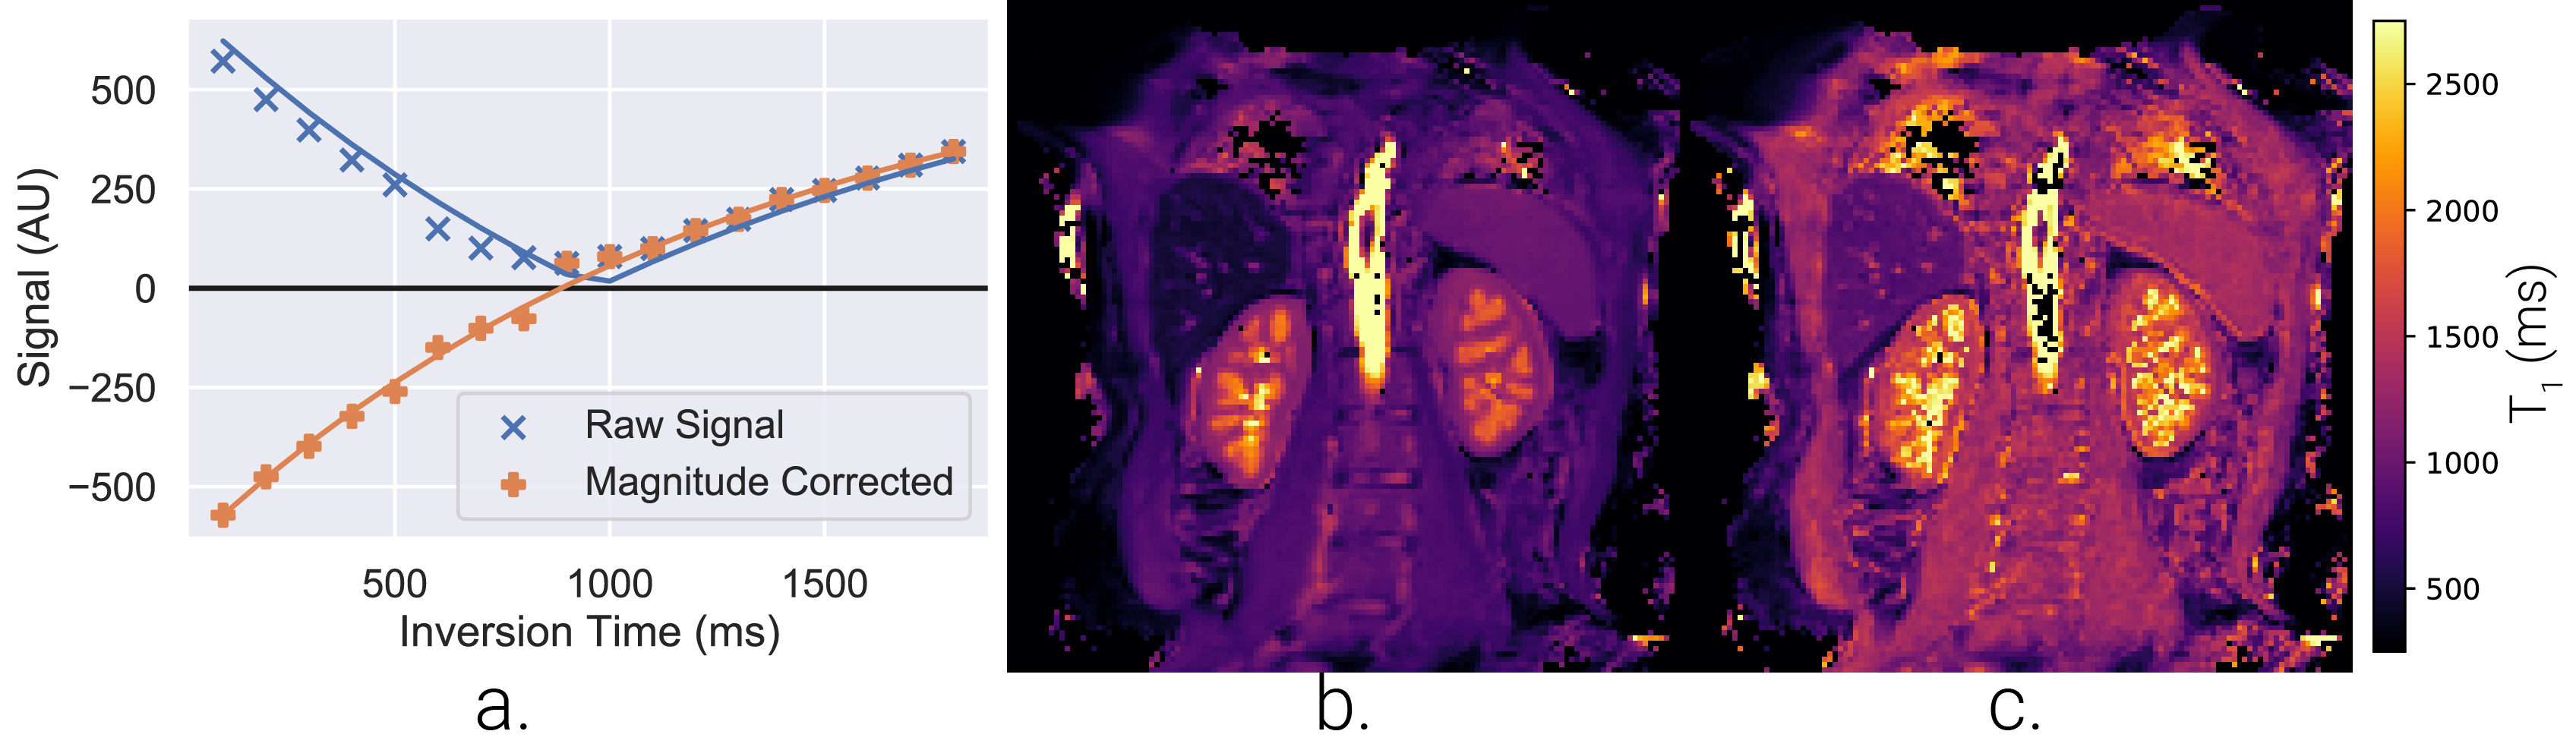
T1-mapping, from inversion-recovery images, has been implemented with a two- and three-parameter fit. If phase data are available, they can be used to correct the magnitude of the inversion recovery signal to increase dynamic range7 (Figure 4).
T2-mapping can be carried out with a basic two parameter exponential or with an additional baseline offset term to model very long T2 components.
T2*/R2*-mapping can be performed using either a weighted linear model or a two-parameter exponential model. The former is quick to calculate and accurate within the kidneys, however for tissues with short T2* the two-parameter exponential model is more robust.
ADC and IVIM analysis of DWI data are performed by using a streamlined interface to Dipy8. This simplifies the complexities of diffusion models and parameter choices, many of which are specific to renal imaging.
Ongoing UKAT development focuses on image processing aspects of the quantitative renal MRI analysis pipeline:
Automated whole kidney segmentation is in development and will draw on previously published machine learning methods9.
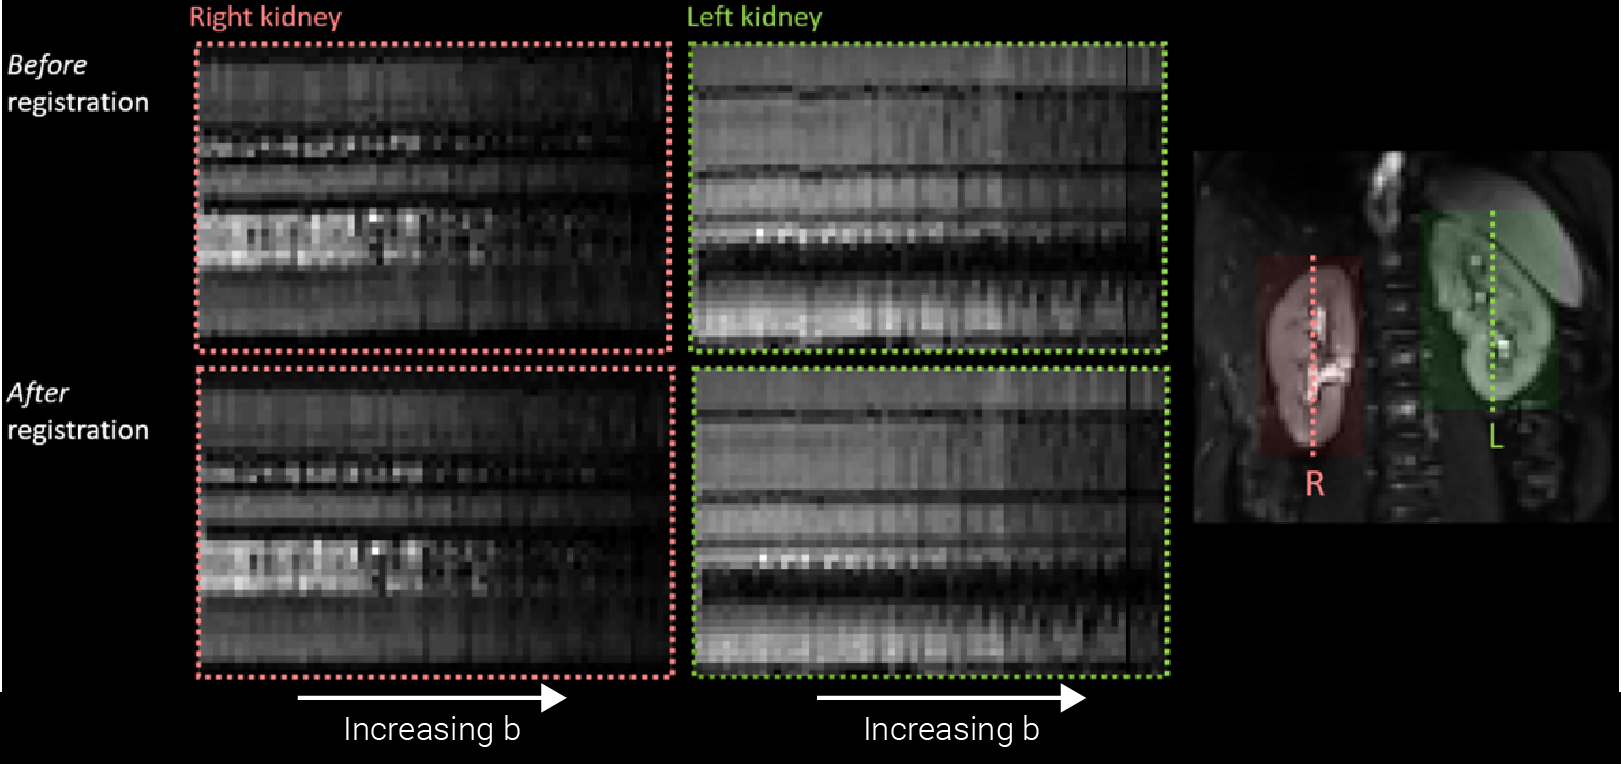
Image registration modules are in development to compensate for residual kidney motion during non-breathhold scans (Figure 5)
Future UKAT development will include automated cortical-medullary segmentation, processing pipelines for ASL and registration between sequences, we anticipate these features being released by the end of 2021.
Summary
UKAT is a flexible and vendor-agnostic framework for analysis of quantitative renal MRI data. This toolbox, built with a modular architecture and software engineering best practices at its core, can be used to build comprehensive Python pipelines or as the basis of a plugin for a DICOM image processing interface. UKAT has been developed for UKRIN-MAPS, although we envision this toolbox to be broadly useful for the renal MRI community and beyond.UKAT can be downloaded from https://github.com/UKRIN-MAPS/ukat
Acknowledgements
This work is funded by MRC Partnership grant MR/R02264X/1.References
1. Mendichovszky, I. et al. Technical recommendations for clinical translation of renal MRI: a consensus project of the Cooperation in Science and Technology Action PARENCHIMA. Magn. Reson. Mater. Phys. Biol. Med. 33, 131–140 (2020).
2. Charlotte E Buchanan et al. Travelling kidneys: Multicentre multivendor variability of renal BOLD and T1 mapping – preliminary results. in Proc. Intl. Soc. Mag. Reson. Med. 28 vol. 28 2636 (2020).
3. Fabio Nery et al. Travelling kidneys: Multicentre multivendor variability of renal diffusion-weighted imaging – preliminary results. in Proc. Intl. Soc. Mag. Reson. Med. 28 vol. 28 0945 (2020).
4. Nery, F., Daniel, A., Sousa, J. & Buchanan, C. UKRIN Kidney Analysis Toolbox. (UK Renal Imaging Network, 2020).
5. Smith, S. M. et al. Advances in functional and structural MR image analysis and implementation as FSL. NeuroImage 23, S208–S219 (2004).
6. Walt, S. van der et al. scikit-image: image processing in Python. PeerJ 2, e453 (2014).
7. Szumowski, J. et al. Signal polarity restoration in a 3D inversion recovery sequence used with delayed gadolinium-enhanced magnetic resonance imaging of cartilage (dGEMRIC). J. Magn. Reson. Imaging 36, 1248–1255 (2012).
8. Garyfallidis, E. et al. Dipy, a library for the analysis of diffusion MRI data. Front. Neuroinformatics 8, (2014).
9. Daniel, A. et al. Automated Renal Segmentation in Healthy and Chronic Kidney Disease Subjects Using A Convolutional Neural Network. in Proc. Intl. Soc. Mag. Reson. Med. 28 (2020).
Figures