3758
Lesion simulation software LESIM: a robust and flexible tool for realistic simulation of white matter lesions
Merlin M. Weeda1, Alexandra de Sitter1, Iman Brouwer1, Mitchell M. de Boer1, Rick J. van Tuijl1, Petra J.W. Pouwels1, Frederik Barkhof1,2, and Hugo Vrenken1
1Radiology and Nuclear Medicine, Amsterdam UMC - Location VUmc, Amsterdam, Netherlands, 2Institutes of Neurology and Healthcare Engineering UCL, London, United Kingdom
1Radiology and Nuclear Medicine, Amsterdam UMC - Location VUmc, Amsterdam, Netherlands, 2Institutes of Neurology and Healthcare Engineering UCL, London, United Kingdom
Synopsis
Multiple sclerosis(MS) is characterized by white matter(WM) lesions and grey matter(GM) atrophy in the central nervous system. Software to measure GM atrophy is severely hindered by the presence of lesions. In order to facilitate development of accurate GM segmentation software in the presence of WM lesions, we present a novel, robust, flexible and open-source lesion simulation tool: LESIM. Initial analysis with 25 LESIM lesion simulated images shows natural-looking lesions in the correct locations, with correct signal-to-noise ratio and intensity compared to the rest of the image. Analysis with FSL-SIENAX confirms that GM segmentation is affected in HCs with simulated lesions.
Background
In multiple sclerosis (MS), the most obvious pathological brain changes are white matter (WM) lesions (1) and grey matter (GM) atrophy (2), and there is a need to clarify the relation between the two (3). However, many image analysis methods that quantify GM atrophy exhibit impaired performance in the presence of WM lesions (4, 5). To allow objective investigations of the effects of WM lesions on image analysis methods and facilitate the development of segmentation methods that are robust to the presence of WM lesions, we here present a novel lesion simulation method (LESIM).Methods
The LESIM software simulates lesions from a subject with MS into a 3D T1-weighted (3DT1) images of a healthy control (HC). In our study, we used manually delineated lesions from an expert rater (experience>10 years) (6). MR imaging was performed on five subjects with early relapsing-remitting MS and five healthy controls on a 3T whole-body MR scanner (GE Discovery MR750) with an 8-channel phased-array head coil. The protocol included a 3D T1-weighted fast spoiled gradient echo sequence (FSPGR with TR/TE/TI =8.2/3.2/450 ms and resolution 1.0x1.0x1.0 mm) and a 3D T2-weighted fluid attenuated inversion recovery sequence (FLAIR with TR/TE/TI =8000/130/2338 ms at resolution 1.0x1.0x1.2 mm).The LESIM pipeline consists of five steps and as input, a 3DT1 HC scan and a 3DT1 patient scan is needed, as well as the patient’s lesion mask in FLAIR or T1 space. It makes use of FSL version 5.0.10(7), FreeSurfer version 6.0.0 (8, 9), LEsion Automated Preprocessing (LEAP) (10) and Elastix version 4.7 (11).
- Step 1 consists of pre-processing of the patient image, containing neck removal, brain extraction, bias field correction, removing lesions smaller than 5 voxels and registering the FLAIR lesion mask to T1. Next, lesions are filled with LEAP and the T1 patient image is normalized for the mean signal intensity of the normal appearing white matter (NAWM).
- Step 2 consists of pre-processing of the HC image (as was done for the patient image in step 1) and initial non-linear registration of the patient image to the HC image.
- Step 3 consists of registration of the patient image to the HC image using Elastix, containing whole brain non-linear registration, transformation of the patient lesion and WM masks, transformation of the processed and normalized T1 patient image, and creating the lesion mask and simulate uncorrected lesions in the HC image.
- Step 4 performs intensity and noise correction on the transformed images to correct for different signal intensities and different signal-to-noise ratios between patient and HC images.
- Step 5 creates a border for transition between the HC WM matter and the simulated lesion, and finally places the corrected simulated lesions with border in the processed HC image, resulting in a HC T1 image with simulated lesions.
Results
Visual inspection showed that LESIM simulates natural-looking lesions in the correct locations (Figure 1, 2), and with the correct signal-to-noise ratio and intensity compared to the rest of the image (Figure 3). Total GM volumes obtained from FSL-SIENAX were increased after lesion segmentation (Figure 4), as would be expected based on the literature. The influence of lesions was clearly visible in the GM partial volume estimate (PVE) maps, which showed a dramatic increase of GM in regions with simulated lesions compared to GM-PVE maps of HC without simulated lesions (Figure 5).Discussion
LESIM is a new, robust and flexible tool for reliable WM MS lesion simulation. In contrast to alternative approaches, it takes actual lesions from real patient images as its sources. The registration steps, the correction for noise and intensity differences, and the smooth transition from the edges of the lesions to the surrounding tissue results in realistic lesions in HC images. Moreover, the simulated WM lesions have the expected effect on GM segmentation using FSL-SIENAX.Our software could be used to study the effect of MS WM lesions on image segmentation and registration in MS, without the confounding effects of brain atrophy and other changes that occur concurrently with lesions in the brains of people with MS. In addition, the approach could be extended to other modalities such as FLAIR, or to other diseases or pathological conditions such as age-related WM hyperintensities.
Acknowledgements
This work was supported by the Dutch MS Research Foundation, grant number 14-876. AdS was supported by a research grant from Teva. FB is supported by the NIHR biomedical research centre at UCLH.References
- Lucchinetti C, Bruck W, Parisi J, Scheithauer B, Rodriguez M, Lassmann H. Heterogeneity of multiple sclerosis lesions: implications for the pathogenesis of demyelination. Ann Neurol. 2000;47(6):707-17.
- Bergsland N, Horakova D, Dwyer MG, Dolezal O, Seidl ZK, Vaneckova M, et al. Subcortical and cortical gray matter atrophy in a large sample of patients with clinically isolated syndrome and early relapsing-remitting multiple sclerosis. AJNR Am J Neuroradiol. 2012;33(8):1573-8.
- Steenwijk MD, Daams M, Pouwels PJ, L JB, Tewarie PK, Geurts JJ, et al. Unraveling the relationship between regional gray matter atrophy and pathology in connected white matter tracts in long-standing multiple sclerosis. Hum Brain Mapp. 2015;36(5):1796-807.
- Gonzalez-Villa S, Valverde S, Cabezas M, Pareto D, Vilanova JC, Ramio-Torrenta L, et al. Evaluating the effect of multiple sclerosis lesions on automatic brain structure segmentation. Neuroimage Clin. 2017;15:228-38.
- Sdika M, Pelletier D. Nonrigid registration of multiple sclerosis brain images using lesion inpainting for morphometry or lesion mapping. Hum Brain Mapp. 2009;30(4):1060-7.
- Weeda MM, Brouwer I, de Vos ML, de Vries MS, Barkhof F, Pouwels PJW, et al. Comparing lesion segmentation methods in multiple sclerosis: Input from one manually delineated subject is sufficient for accurate lesion segmentation. Neuroimage Clin. 2019;24:102074.
- Smith SM, Jenkinson M, Woolrich MW, Beckmann CF, Behrens TE, Johansen-Berg H, et al. Advances in functional and structural MR image analysis and implementation as FSL. Neuroimage. 2004;23 Suppl 1:S208-19.
- Dale AM, Fischl B, Sereno MI. Cortical surface-based analysis. I. Segmentation and surface reconstruction. Neuroimage. 1999;9(2):179-94.
- Fischl B, Sereno MI, Dale AM. Cortical surface-based analysis. II: Inflation, flattening, and a surface-based coordinate system. Neuroimage. 1999;9(2):195-207.
- Chard DT, Jackson JS, Miller DH, Wheeler-Kingshott CA. Reducing the impact of white matter lesions on automated measures of brain gray and white matter volumes. J Magn Reson Imaging. 2010;32(1):223-8.
- Klein S, Staring M, Murphy K, Viergever MA, Pluim JP. elastix: a toolbox for intensity-based medical image registration. IEEE Trans Med Imaging. 2010;29(1):196-205.
- Smith SM, Zhang Y, Jenkinson M, Chen J, Matthews PM, Federico A, et al. Accurate, robust, and automated longitudinal and cross-sectional brain change analysis. Neuroimage. 2002;17(1):479-89.
Figures
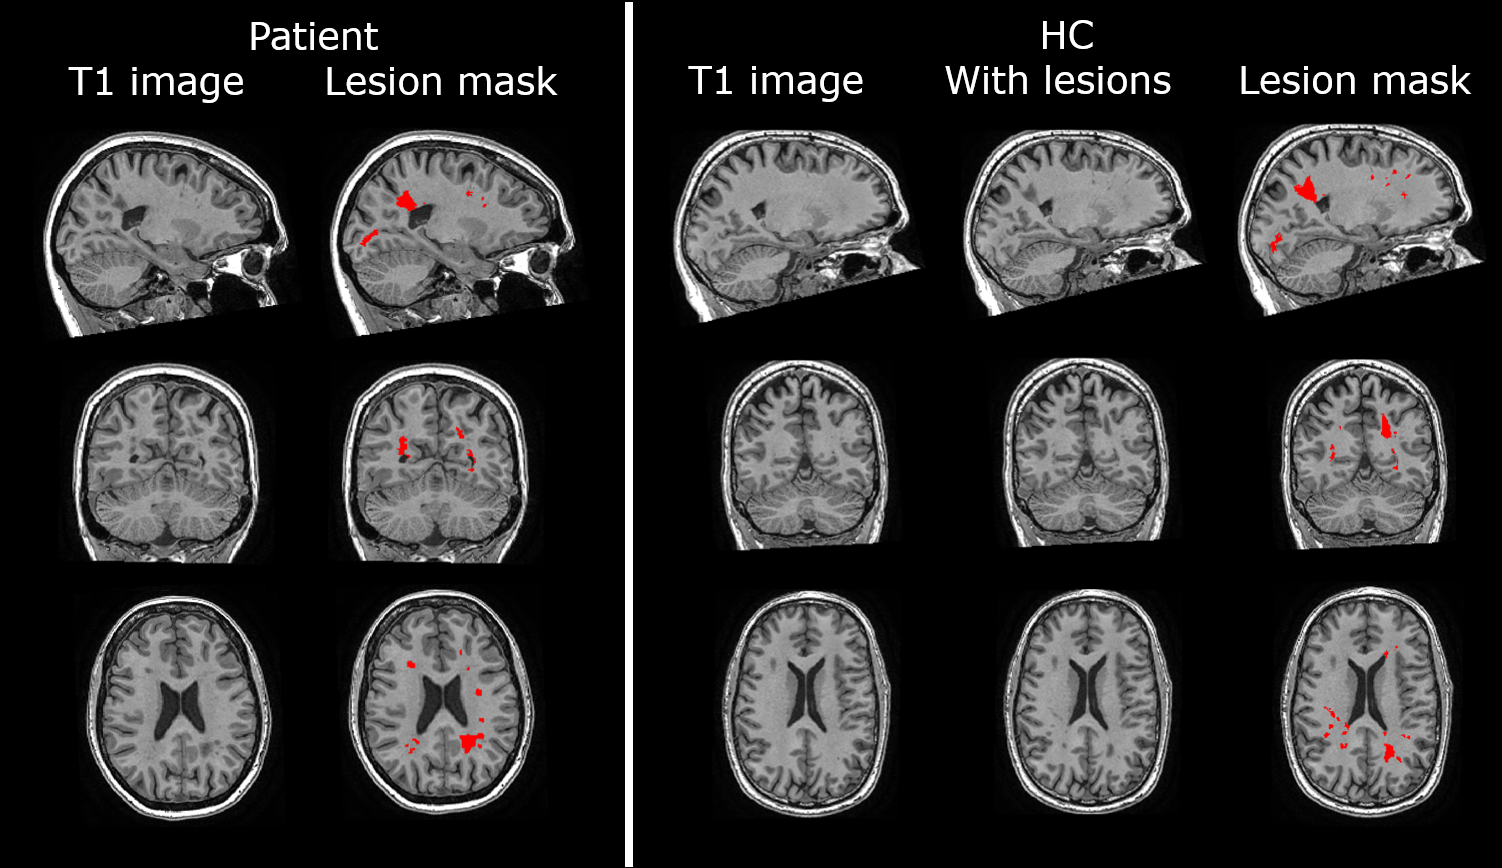
Figure 1. Image of patient and healthy control (HC) with
simulated lesions of patient. Left panel, from left to right: native 3DT1
patient image; and native image with the transformed lesion mask (red). Right
panel, from left to right: native 3DT1 HC image; HC image with simulated
lesions; and HC image with the simulated lesion mask (red).
Note that the lesion mask of the patient was manually
outlined on a FLAIR image and transformed to the T1 image with nearest neighbor
interpolation. GM folds (as visible in top left corner of HC axial slice) are
not segmented as lesions.
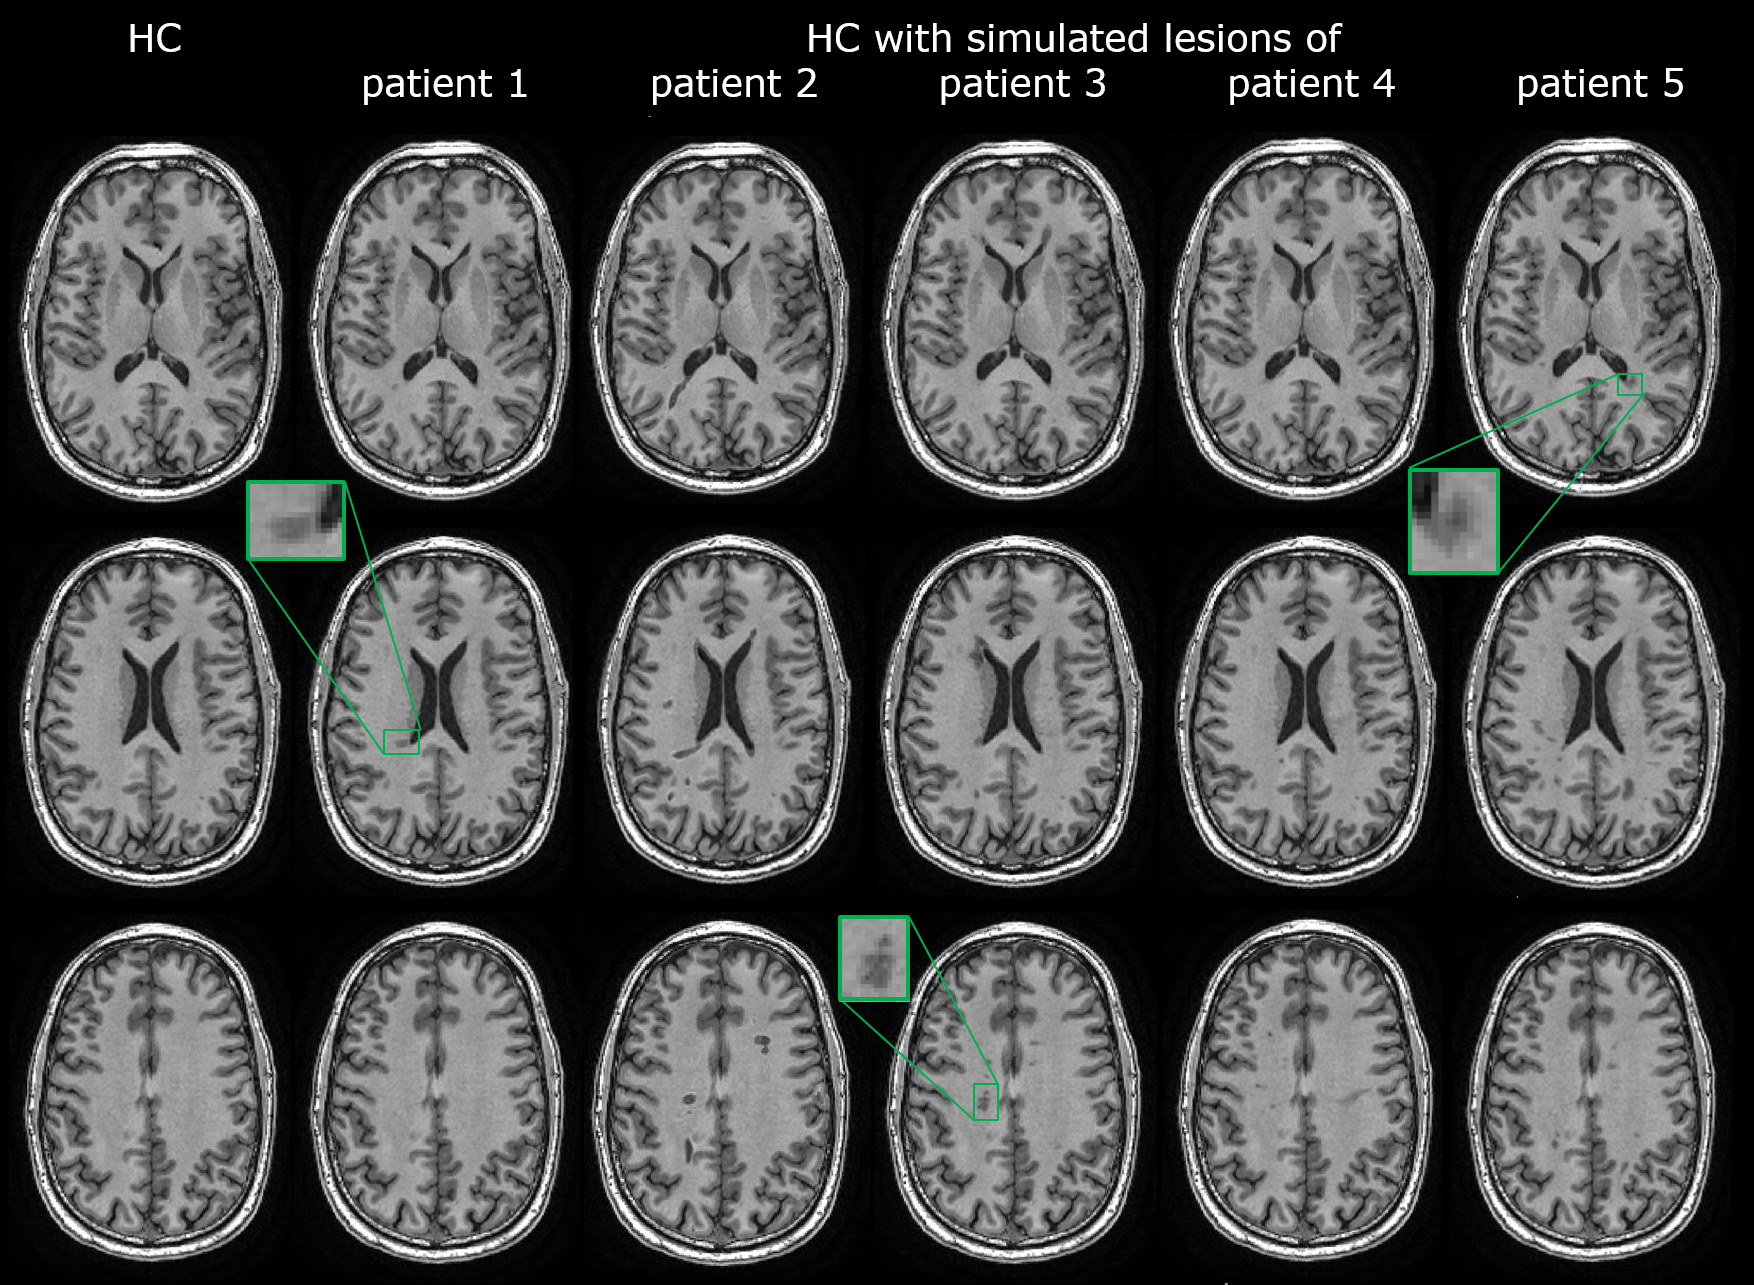
Figure 2. Axial slices of native 3DT1 healthy control
(HC) image (left); and the same image with simulated lesions from five
different patients (patient 1-5). Boxes show several lesions in more detail.
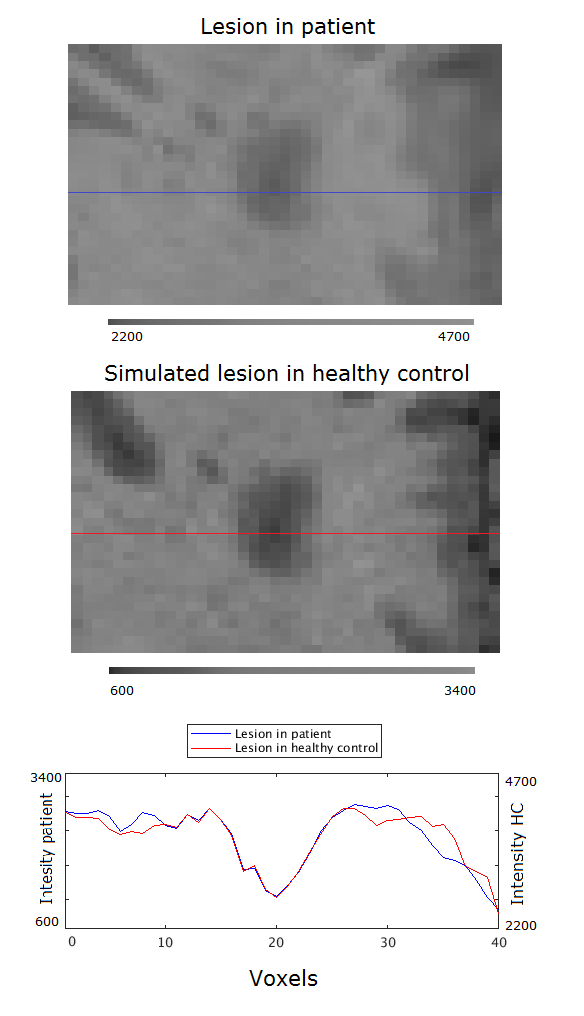
Figure 3. Intensity plot of the intersection of a
patient lesion (blue) and a simulated lesion (red) with surrounding tissue.
Note the intensity axes are different for the patient lesion and simulated
lesion.
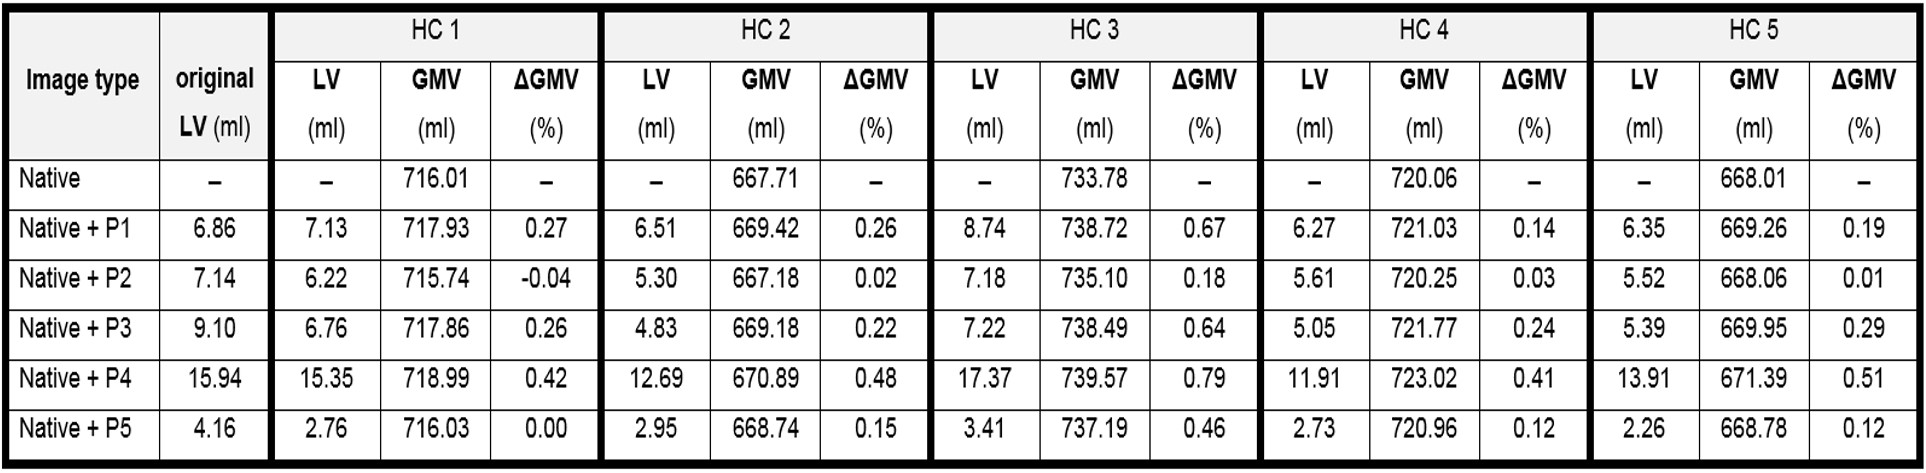
Figure 4. Original lesion volumes (LV) from the five patients
(P1-P5), and the simulated LVs from the five patients in the five healthy
controls (HC). The total grey matter volume (GMV) measured in the native HC
image and in the HC image with simulated lesions is shown both as a volume and
as a percentage change (ΔGMV), indicating the effect of the lesions on the GM
segmentation software FSL-SIENAX.
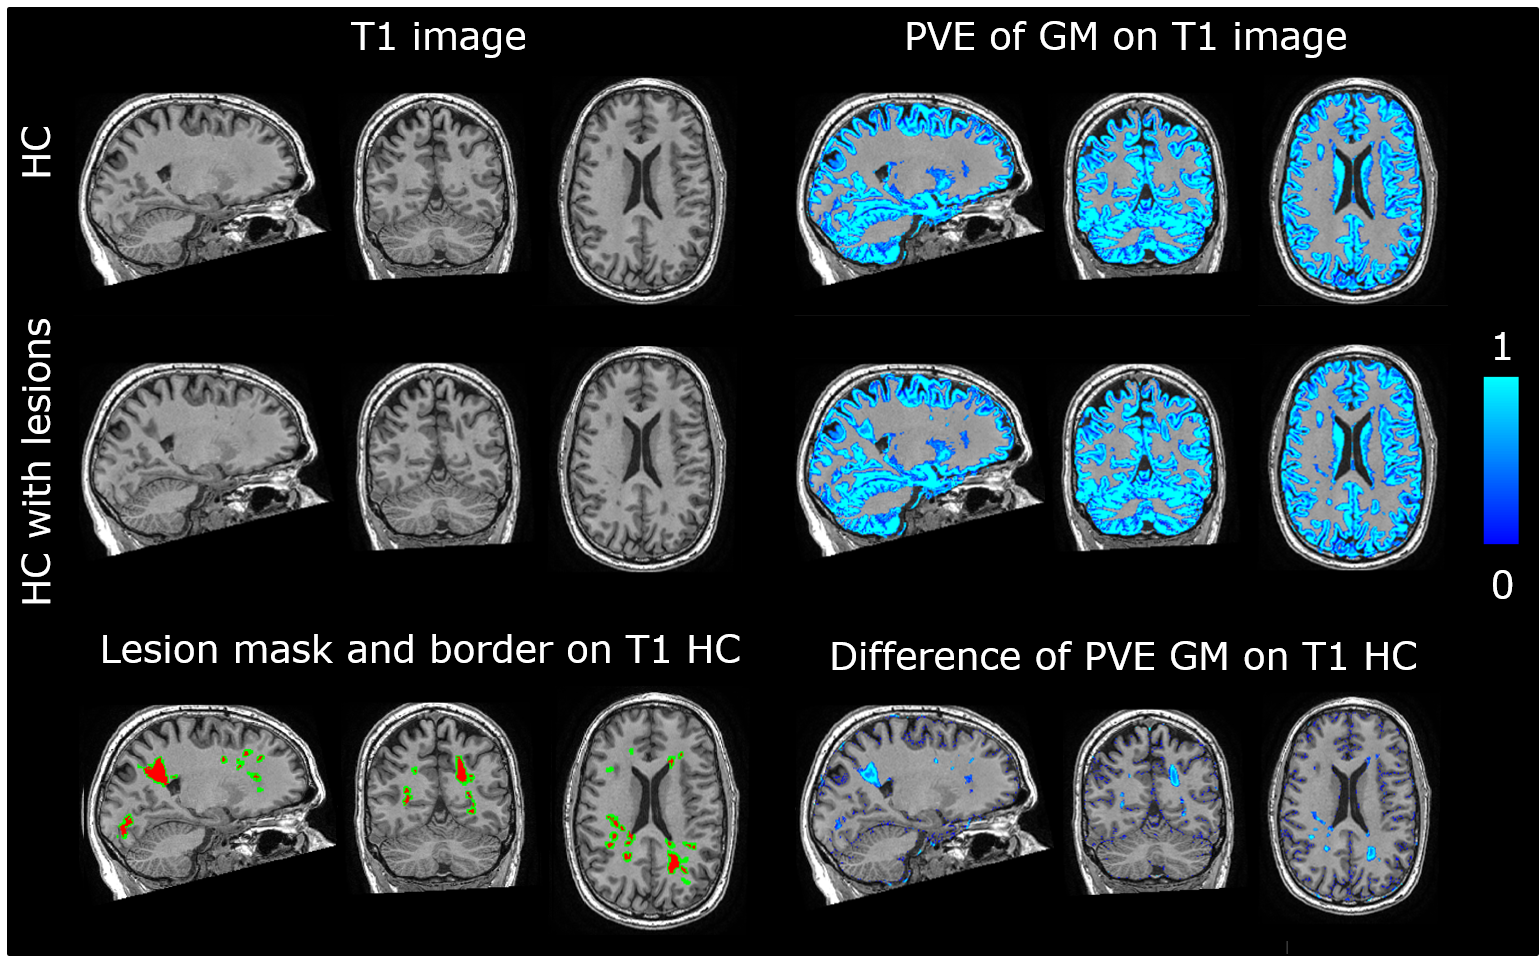
Figure 5. Effect of simulated lesions on partial volume
estimation (PVE) of the grey matter (GM) with FSL-SIENAX.
Top left: native 3DT1 HC image and lesion simulated HC
image. Bottom left: lesion simulated lesion mask (red) with borders (green).
Top right: GM PVE image of native 3DT1 HC image and lesion simulated HC image
(scale: 0-1). Bottom right: difference between the native and lesion simulated
GM PVE images, showing overlap with the lesion mask and borders.
Note that GM folds (as visible in top left corner of HC
axial slice) are not segmented as lesions.