3751
Automatic 3D PC-MRI atlas-based segmentation of the aorta
Diana M. Marin-Castrillon1, Arnaud Boucher1, Siyu Lin1, Chloe Bernard2, Marie-Catherine Morgant1,2, Alexandre Cochet1,3, Alain Lalande 1,3, Benoit Presles 1, and Olivier Bouchot 1,2
1ImViA Laboratory, University of Burgundy, Dijon, France, 2Department of Cardio-Vascular and Thoracic Surgery, University Hospital of Dijon, Dijon, France, 3Department of Medical Imaging, University Hospital of Dijon, Dijon, France
1ImViA Laboratory, University of Burgundy, Dijon, France, 2Department of Cardio-Vascular and Thoracic Surgery, University Hospital of Dijon, Dijon, France, 3Department of Medical Imaging, University Hospital of Dijon, Dijon, France
Synopsis
Analysis of aorta hemodynamics is useful in the evaluation of aortic diseases. 4D PC-MRI provides information of flow velocity in the aorta and automatic segmentation is one of the biggest challenges. We propose a fully 3D automatic segmentation of the aorta in systole using a multi-atlas approach. Evaluation on 16 patients provided an average performance of 29.55±24.33 mm and 0.859 ±0.024 for Hausdorff distance and Dice score respectively. With the proposed method, the automatic segmentation of the thoracic aorta that can be obtained from 4D PC-MRI is close enough to the manual one to be used in future studies.
Introduction
Analysis and evaluation of aorta hemodynamics is important because it allows the physician to identify flow patterns, biomechanical parameters such as wall shear stress (WSS) and to custom the treatment. Indeed, aorta diseases such as aneurysms or coarctations can modify in different ways the tissue characteristics and the blood flow through this artery. Currently, image modalities such as 4D Phase Contrast Magnetic Resonance Imaging (4D PC-MRI) are used to determine flow velocities in the aorta, however, it is mainly used for research purposes1. Therefore, for the use of 4D PC-MRI in clinical practice, it is important to standardize analysis techniques and one of the biggest challenges is the automatic segmentation of vessels due to the image quality. In this work, we present a fully automatic multi-atlas segmentation approach using 3D PC-MRI by considering the systolic phase.Methods
For this study, 16 patients underwent free-breathing 4D PC-MRI acquisitions, generating for each one 25 volumes to cover the cardiac cycle with a spatial resolution of 2x2x2 mm3 and a temporal resolution of 24.28 to 52.04 ms according to the patient. The labeled images for the atlas were created by segmenting manually the aorta in a 3D volume corresponding to the systolic phase. The subclavian, carotid, and branchiocephalic arteries were excluded due to their low visibility in the 3D PC-MRI images. To automatically segment a target image (fixed image) with an image from the atlas (moving image), the latter is register first by performing an intensity-based affine registration using the mutual information as similarity measure and then, a B-spline intensity-based registration to retrieve local deformations using the normalized correlation coefficient (NCC) as similarity measure. The final control point grid spacing was set to 24x24x16 mm in the x, y, and z axis respectively. In both registration processes, a multi-resolution strategy was applied. Lastly, the resulting transformations (affine + B-spline) were applied to the corresponding manual segmentation providing an automatic segmentation of the target image. This registration strategy was repeated with all the images in the atlas and a majority voting (MV) process was used to obtain the final target segmentation by assigning to each voxel the label that is most repeated. To quantify the performance of our method, we use two classical metrics, the Hausdorff distance (in mm) and the Dice index, but also a 3D Hausdorff distance map in order to highlight errors distribution. To compute the average performance a leave-one-patient-out strategy was carried out, along with an atlas selection process to determine the compromise between the best average performance and the less number of masks for MV. For the atlas selection step, the NCC between the target image and the warped images were calculated and sorted to apply MV adding the masks one by one in ascending order of similarity (Figure 1).Results
To analyze the performance of the proposed method both globally and locally and identify the region of the aorta with the most important errors, we divided the aorta into three regions, ascending aorta (AAO), descending thoracic aorta (DTAO), and proximal abdominal aorta (PAAO). The best performance was reached with ten masks and the average global Hausdorff distance and Dice index were 29.55±24.33 mm and 0.86±0.024 respectively. Nonetheless, by computing them locally the performance increases for the AAO (14.39±6.37 mm and 0.87±0.043) and the DTAO (8.31±2.11 mm and 0.88±0.03) compared to results obtained for the PAAO (37.94±24.9 and 0.719±0.19). Figure 2 shows the patients with the highest and lowest performance.Discussion
We can observe a degradation of the performance segmentation of PAAO which is related to the image quality because this area is far from the center of the phase-array thoracic coil and in consequence, there is a decrease in the signal to noise ratio. With atlas selection, we found that the number of masks required to obtain the best average performance was ten but using more masks the average performance decreases, affecting in greater proportion the Hausdorff distance. However, the increase in error was more associated to the PAAO and this may be related to the fact that majority voting gives the same relevance to all the images and increasing the number of masks also increases variations in this area with questionable segmentation as explained above.Conclusion
Our 3D PC-MRI atlas-based aorta segmentation provides accurate automatic segmentations of the ascending and descending thoracic aorta compared to those generated manually. In future works the automatic segmentations obtained could be used for the hemodynamics analysis of this artery and for a subsequent propagation of 3D to 4D segmentation to obtain the aorta shape through the cardiac cycle.Acknowledgements
The authors would like to thank the University Hospital of Dijon for providing the 4D PC-MRI used in this work and those that will be provided in the future. Professor Olivier Bouchot is also thanked for his help with manual segmentations and medical knowledge.References
1. Stankovic Z, Allen BD, Garcia J, Jarvis KB, Markl M. 4D PC flow. Cardiovascular. 2014;4(2):173-192. doi:10.3978/j.issn.2223-3652.2014.01.02Figures
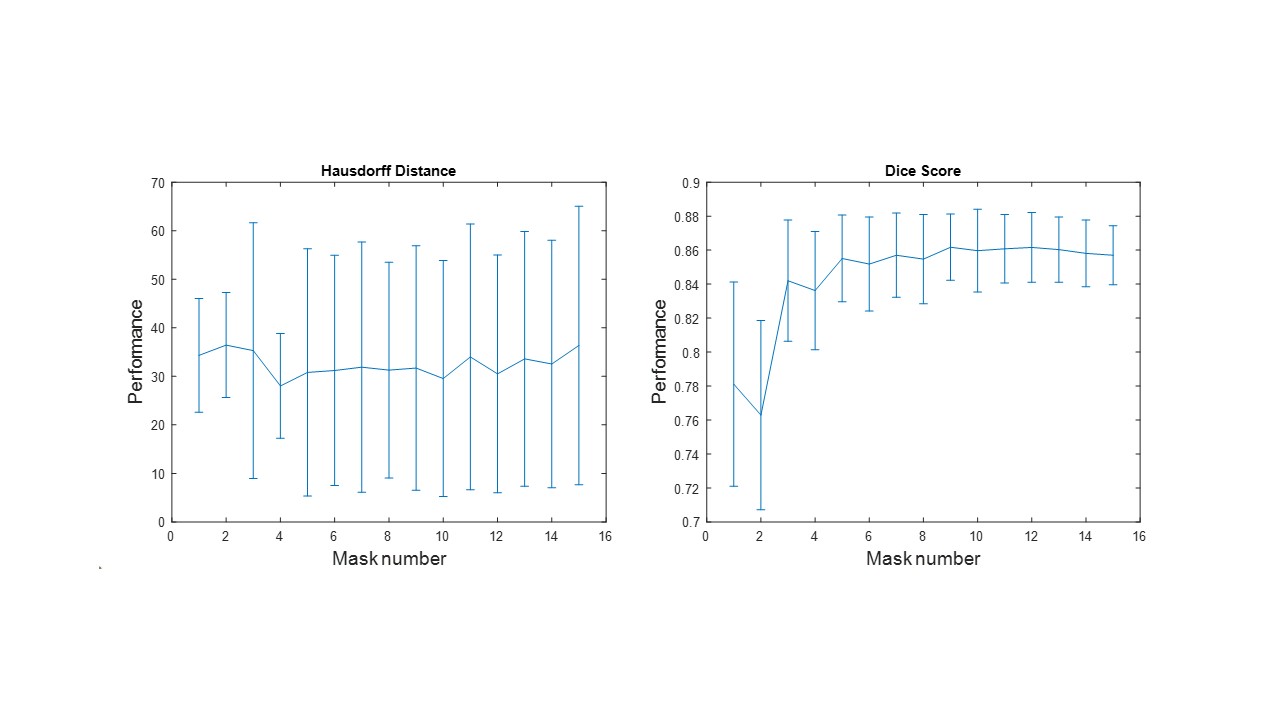
Figure
1. Average performance of the method during the
atlas selection process with respect to the normalized
correlation coefficient
metric. The similarities obtained between the target image and the warped
images are ordered from the highest to the lowest, to perform the majority
voting process with the best mask and add one by one the next best ones until
all the images in the atlas are used.
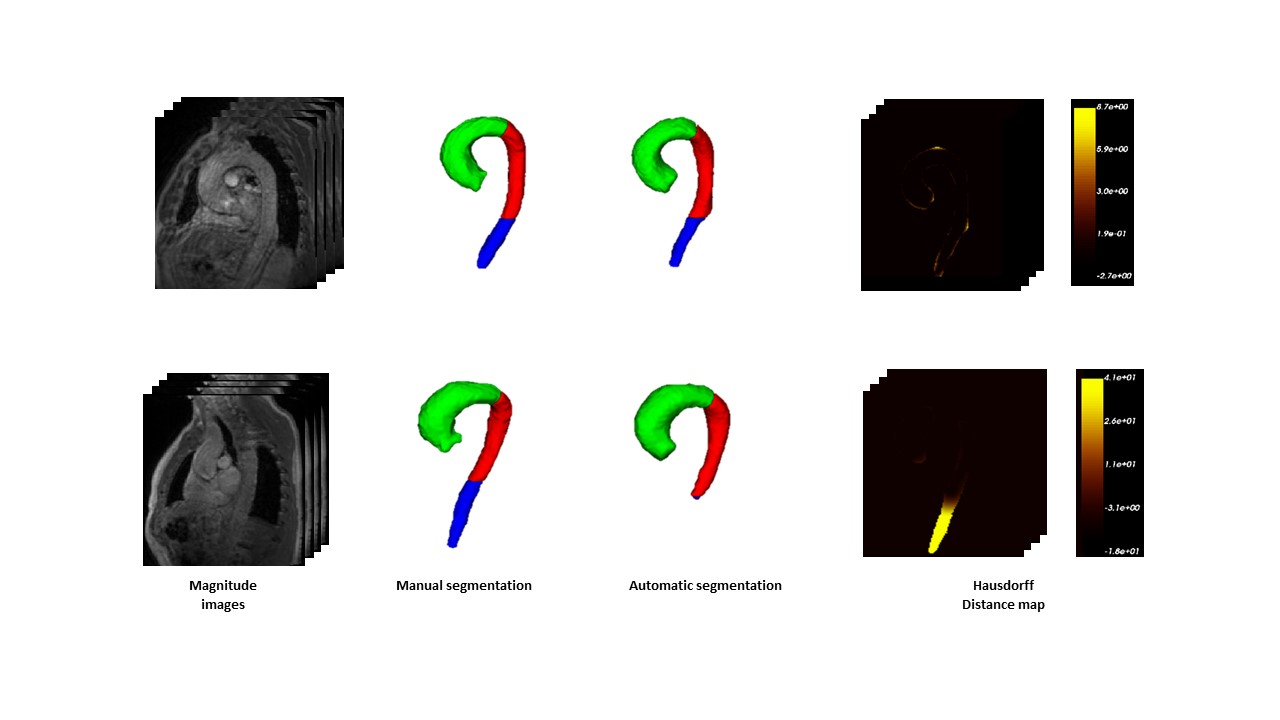
Figure 2. Cases with the highest
(top) and the lowest
(bottom) performance. Hausdorff
map is represented as a heat map in which the regions with intense yellows
represent high errors and dark or black represent errors close to or equal to
zero.