3749
Brain Tumor Characterization and Assessment using Automatic Detection of Extracellular pH Change1Graduate School of Biomedical Sciences, Tokushima University, Tokushima-city, Japan, 2School of Health Sciences, Tokushima University, Tokushima-city, Japan, 3Healthcare Business Unit, Hitachi, Ltd., Tokyo, Japan
Synopsis
In this study, we attempted to characterize brain tumors by combining quantitative parameter mapping and deep-learning-based semantic segmentation. T1, concentration of contrast media (CM), and pHe maps were calculated after the image dataset was obtained. The contrast-enhanced area was then automatically detected using a deep-learning-based semantic segmentation algorithm. The segmented mask was set as the region of interest on these calculated maps. The statistical significance of differences in brain tumors was evaluated to determine whether changes in the mean T1, CM, and pHe were malignancy-dependent.
Introduction & Purpose
We have previously developed extracellular pH (pHe) mapping and demonstrated that the pHe value is decreased because of tumor malignancy [1]. Calculation of the pHe uses quantitative parameter mapping (QPM), which can simultaneously obtain several quantitative maps of T1, T2, and quantitative susceptibility mapping (QSM) [2]. In this study, we attempted to characterize brain tumors using a combination of QPM and a deep-learning-based semantic segmentation algorithm.Our purpose was to automatically characterize tumor malignancy using QPM both before and after injection of contrast media (CM).
Materials & Methods
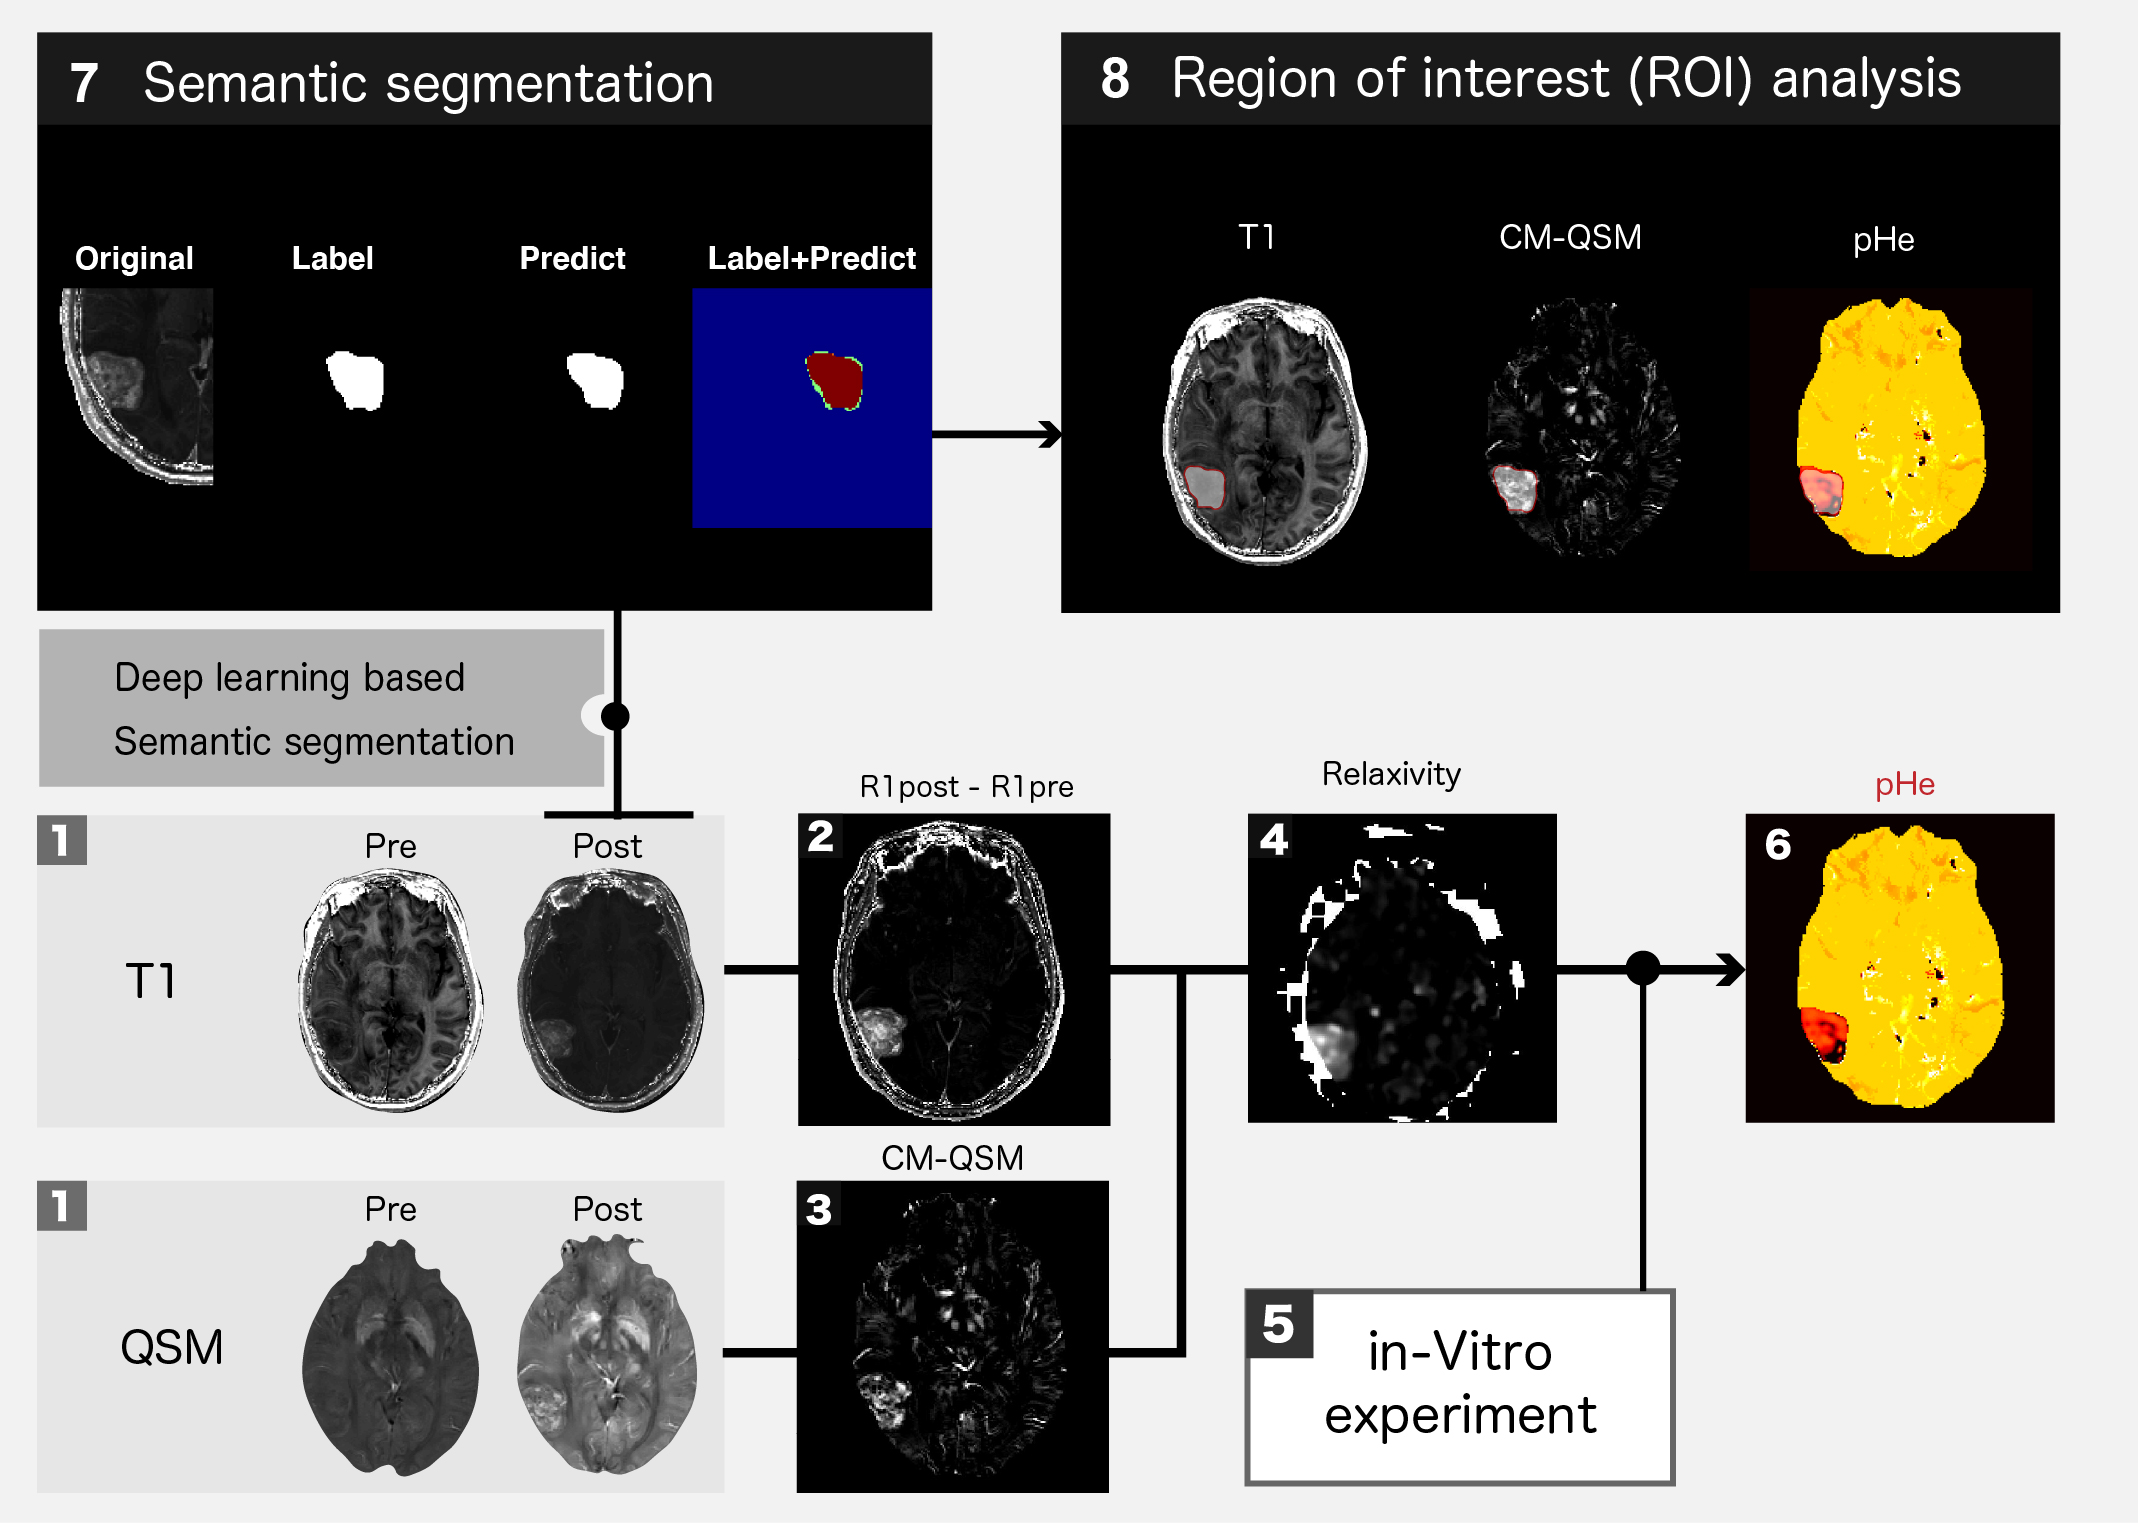
The studies were approved by the local institutional review board and performed on nine patients with brain tumors. All MRI data were obtained on a 3T MRI system (Hitachi, Ltd.) using QPM both before and after injection of contrast media (Gd-BTDO3A; Gadovist ®). The QPM imaging parameters were echo time, 4.6–32.3 ms (five echoes); field of view, 24 cm; matrix size, 256 × 256; and slice thickness, 2 mm. Then, T1, concentration of CM, relaxivity, and pHe were calculated as shown in an eight-step procedure (see numbers 1–6 in Fig.1).1. T1 and QSM both before and after injection were calculated from the QPM image dataset [3].
2. Subtracted map of R1 (R1sub) was calculated from the T1 map both before and after injection:
$${ R1 }_{ sub }\quad =\quad \frac { 1 }{ { T1 }_{ post } } \quad -\quad \frac { 1 }{ { T1 }_{ pre } } $$
3. CM map of Gd-BTDO3A was calculated from the QSM map both before and after injection:
$$CM\quad =\quad \frac { { QSM }_{ post }\quad -\quad { QSM }_{ pre } }{ { \chi }_{ Gd-BTDO3A } } \times { mol }_{ Gd-BTDO3A }$$
4. Relaxivity r1 of brain diseases was calculated from CM and R1sub:
$$r1=\frac { { R1 }_{ sub } }{ CM } $$
Then, a Gaussian filter was applied to the calculated relaxivity map (σ = 1).
5. The relaxivity-pH curve was obtained by performing a phantom study using linear regression analysis of different concentrations of Gd-BTDO3A at each pH value.
6. pHe map was calculated from the relaxivity map by applying the relaxivity-pH curve:
$${ { pHe }\quad =\quad 6.57-log10\left( \frac { r1-4.48 }{ 5.20-r1 } \right) }^{ n }$$
The contrast-enhanced area was then automatically detected using a deep-learning-based semantic segmentation algorithm as follows (see numbers 7–8 in Fig.1):
7a. Training labels were generated by drawing a mask on the contrast-enhanced region of the T1w obtained by QPM and other spoiled gradient echo pulse sequence.
7b. Semantic segmentation was then performed after data augmentation. (Framework: Tensor Coflow, Network: 2D U-net, training data: ~16000, validation data: ~300).
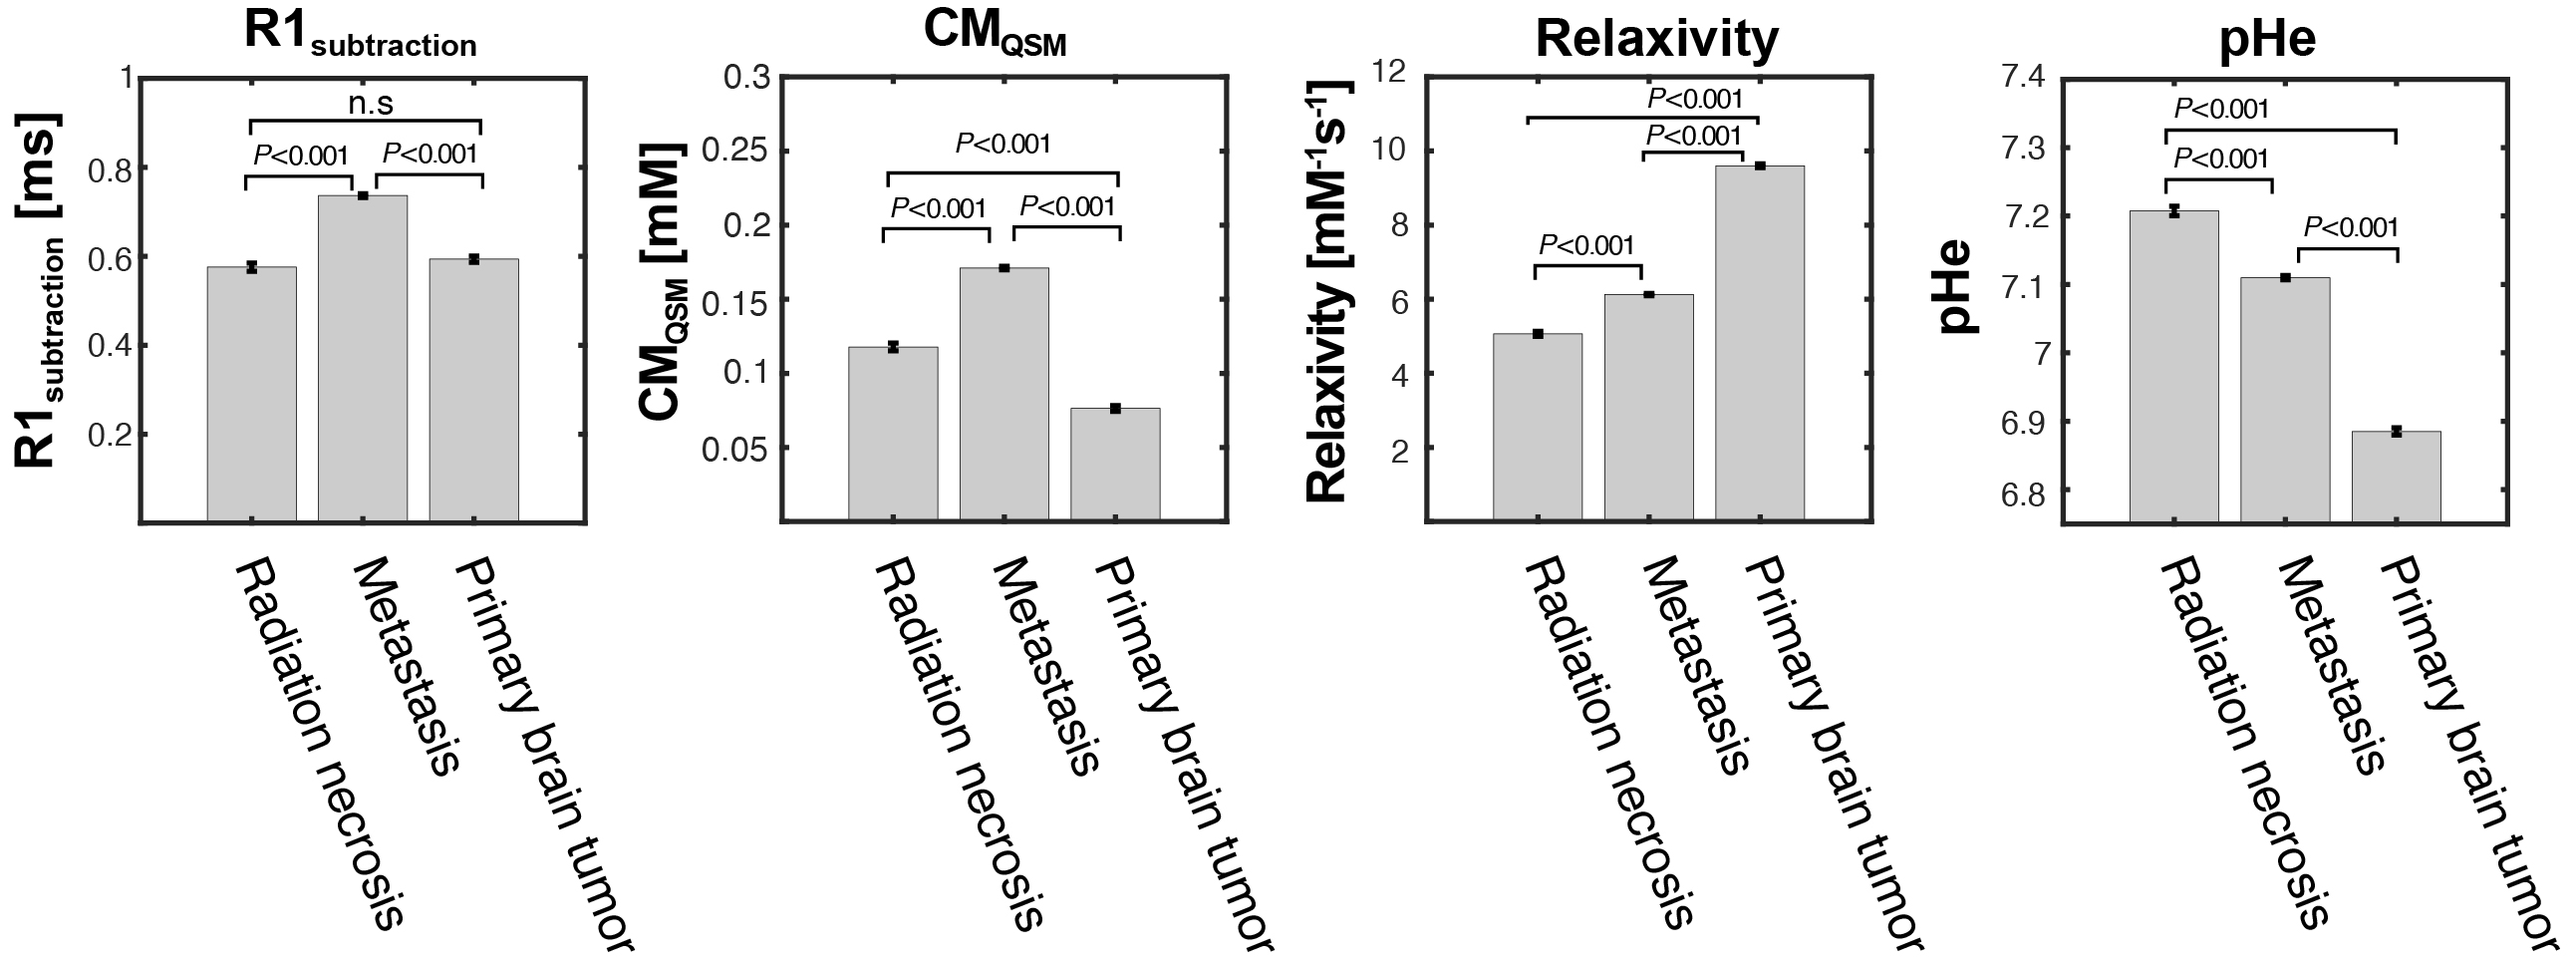
8. Image segmentation on the contrast-enhanced region was performed on the T1, CM, and pHe maps. After performing the process outlined in steps 1–8, the segmented mask was set as the region of interest (ROI) on these calculated maps. Initially, the statistical significance of differences in the brain tumors was evaluated to determine whether changes in the mean T1, CM, and pHe were dependent on malignancy among groups. Then, the relationship between the mean values of these calculated maps on the ROI was plotted to confirm whether tumor characterization is available or not.
Results & Discussions
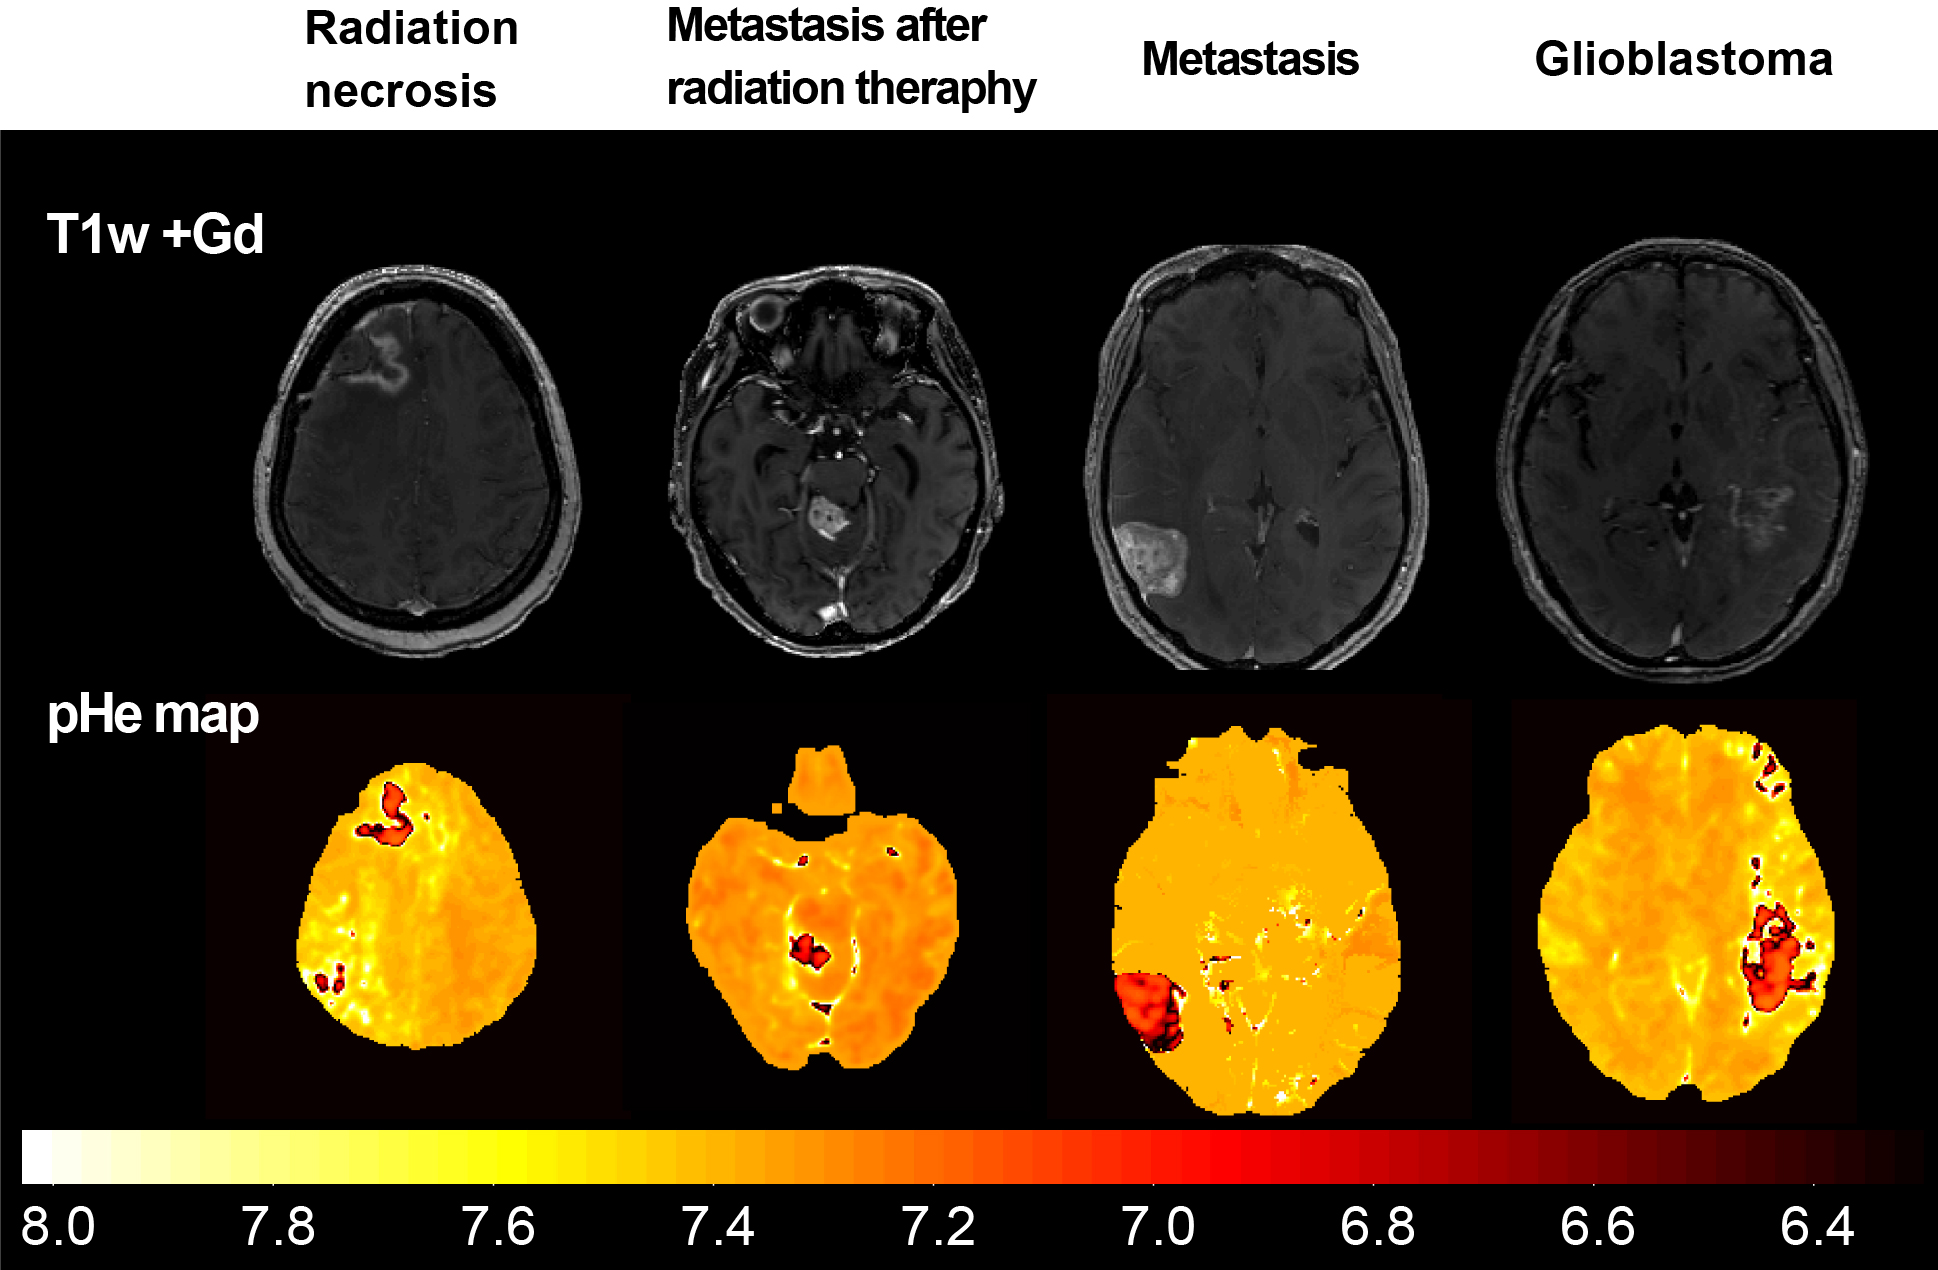
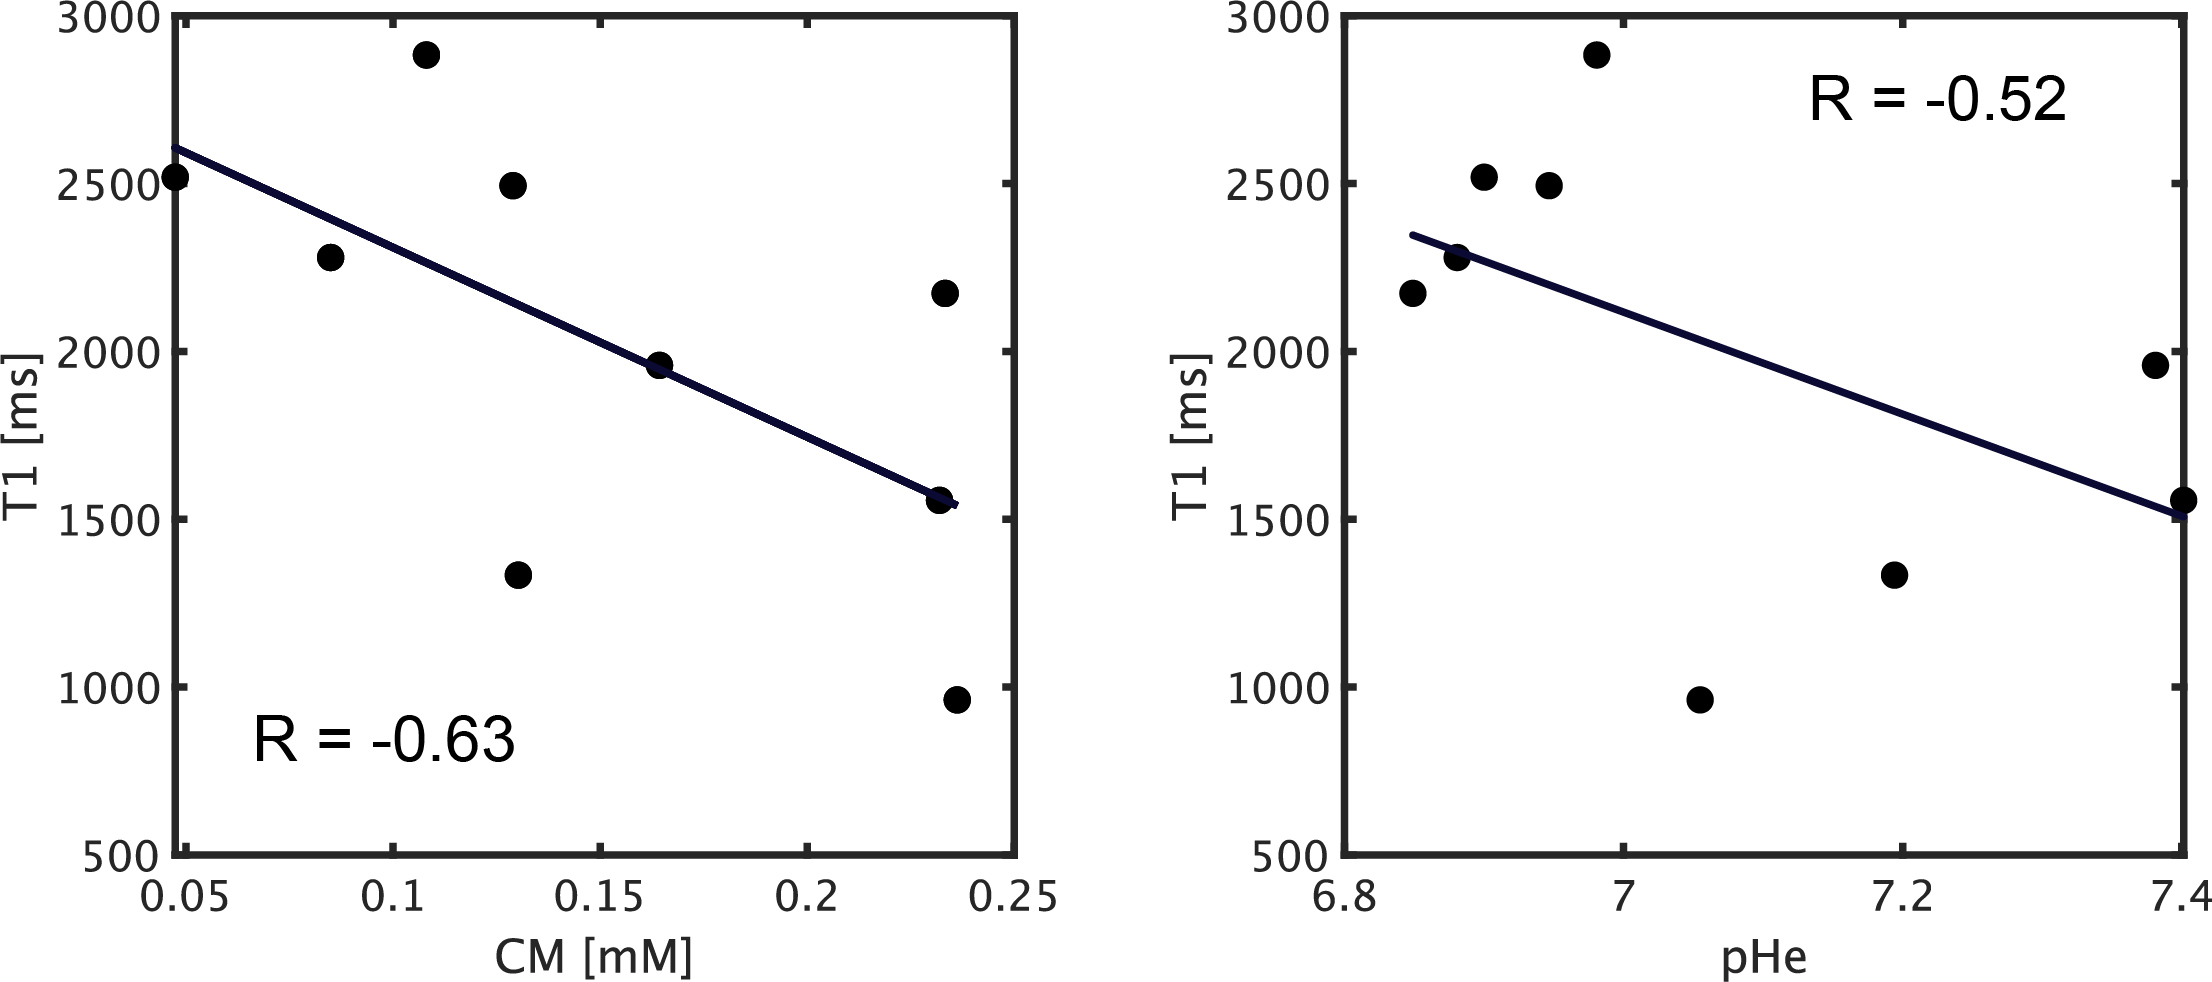
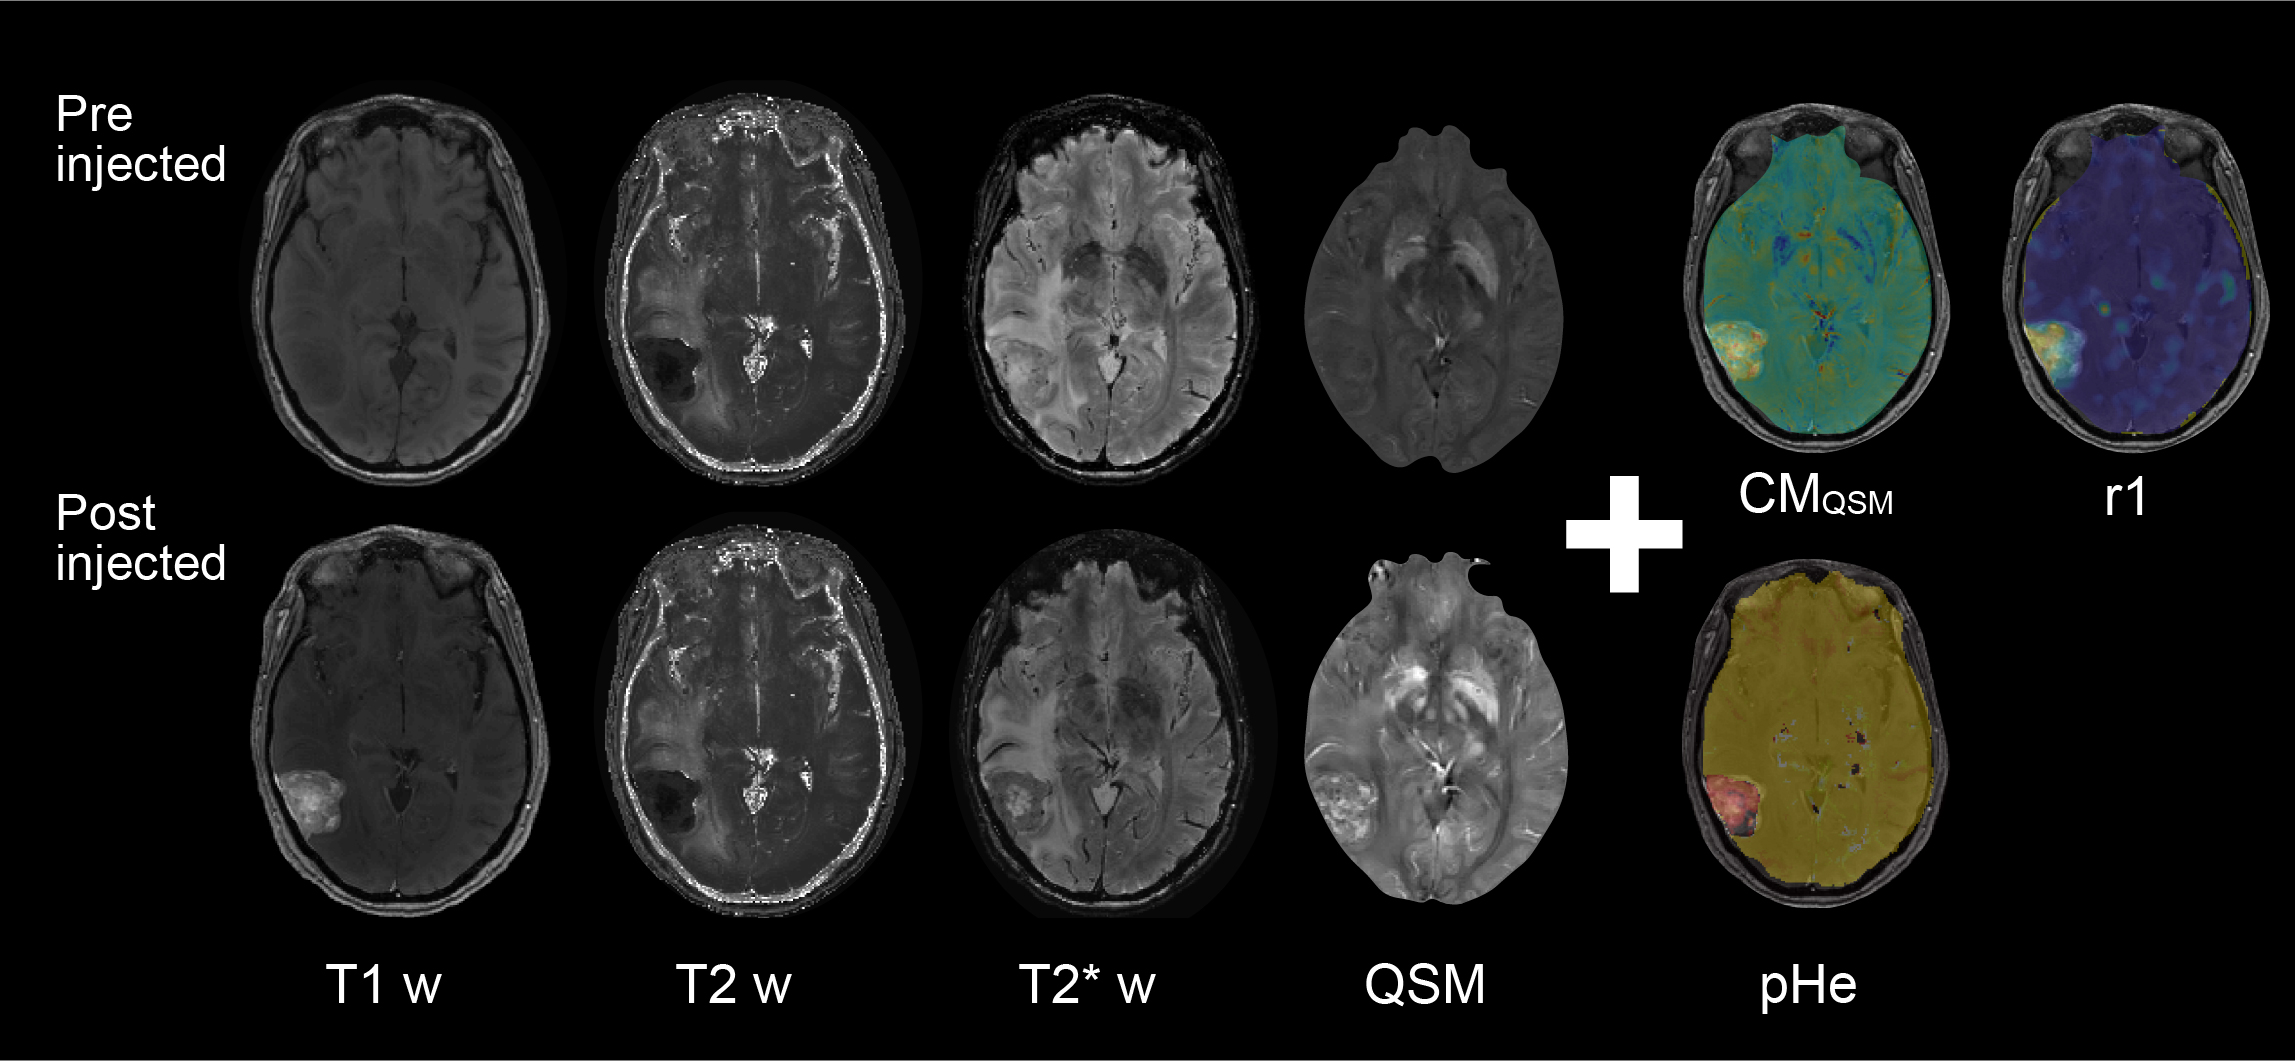
The training loss and dice coefficient in the learning procedure were 0.15 and 0.85, respectively. For the pHe, the primary brain tumor group exhibited a lower mean value than other brain diseases, as shown in Fig.2 (P < 0.001). Moreover, the metastasis group exhibited a significant decrease compared to radiation necrosis (P < 0.001). In addition, the synthetic T1w post contrast derived from QPM and the pHe maps are shown in Fig.3. The mean T1 values were plotted against CM and pHe, indicating a moderate correlation of -0.63 and -0.52, respectively (see Fig.4).Our results show that the mean values of T1, CM, and pHe were dependent on tumor malignancy, indicating that our approach presents a potential marker for tumor characterization.The developed method is advantageous because the conventional weighted images that are used in the diagnosis of brain tumors can be obtained (see Fig.5).
Conclusion
In conclusion, we have demonstrated that the characterization of the tumor environment can be achieved using combined simultaneous measurement of T1, CM, and pHe.
Acknowledgements
This work was supported by JSPS KAKENHI Grant Number JP20K16759.References
[1] Matsumoto Y, et al, Proceedings of ISMRM 2020;28:4983.
[2] Taniguchi Y, et al. Proceedings of ISMRM. 2018; 5630.
[3] Sato R, et al. Magn Reson Med Sci, 2017
Figures