3743
Reproducibility of White Matter Parcellation on Multi-Acquisition Diffusion Weighted Imaging1BioMedIA, Department of Computing, Imperial College London, London, United Kingdom, 2Division of Anaesthesia, Department of Medicine, University of Cambridge, Cambridge, United Kingdom, 3MRC Cognition and Brain Sciences Unit, University of Cambridge, Cambridge, United Kingdom
Synopsis
The comparison of TractSeg and JHU atlas-based white matter parcellation on DWI showed the impact of different acquisition schemes on both region volumes and variation in diffusion metrics. TractSeg defined fibre bundles more accurately, but volumes varied for different DWI parameters. The atlas-based segmentation of fibre tracts was more robust to acquisition differences, but showed higher variation in diffusion metrics suggesting a less precise differentiation of white and grey matter.
Introduction
White matter (WM) parcellation is commonly performed to estimate water diffusion properties in brain regions. This allows the comparison of WM integrity between different cohorts, which makes it a viable tool for clinical neuroscience.1 However, the quality of parcellation may vary with the diffusion weighted imaging (DWI) protocol. Understanding the impact of different acquisition schemes is particularly important for the joint analysis of data from retrospective multi-centre studies with different scanning protocols. This study compares the impact of DWI parameters on WM parcellation yielded by a standard registration-based or predictive model-driven approach.Methods
Sixteen healthy volunteers (nine female, seven male, age = 25.8 ± 5.4 years) repeatedly underwent DWI with identical acquisition parameters (Siemens Trio 3T, TR = 8000 ms, TE = 93 ms, voxels: 2x2x2 mm3), but varying number of b-values. A total of 60 diffusion-sensitised volumes were evenly distributed across one to four shells. The acquisition schemes included four shells with each 15 directions (15x4): b = 300, 600, 900, 1200 s/mm2, three shells with each 20 directions (20x3): b = 400, 800, 1200 s/mm2, two shells with each 30 directions (30x2): b = 600, 1200 s/mm2 and a single shell with 60 directions (60x1): b = 1200 s/mm2. For each DWI scan 13 non-diffusion weighted volumes (b0) were evenly acquired between volumes with different diffusion-sensitisation (single-shell: all b0 collected at the beginning).DWI processing included: Denoising via MPPCA2, Gibbs ringing removal3,4 eddy current and head motion correction5, and bias-field correction.6 Fractional anisotropy (FA) and mean diffusivity (MD) maps were calculated with weighted least-squares tensor fitting.7 FA maps were non-linearly registered8 to the JHU-ICBM FA atlas.9 Its fibre tract probability maps were backprojected to native space (linear interpolation) and thresholded at 25% to compute weighted means of FA and MD maps for all 20 regions of interest (ROIs). Artefact corrected DWI scans were also segmented in native space with TractSeg.10 These probabilistic segmentation maps were thresholded at 50% to calculate weighted means of FA and MD for 69 ROIs. The commissure anterior (ROI #4) and both fornices (ROI #20 & #21) were excluded due to incomplete segmentations. Region volumes were estimated after binarising the thresholded segmentations.
Both segmentation methods were examined separately. Differences in FA or MD or tract volumes were assessed region-wise (Friedman tests). P-values for each metric were corrected for false discovery rate (FDR; Benjamini-Hochberg, family-wise error rate: 0.05). Coefficients of variation (CV) were calculated as the ratio of standard deviation ($$$\sigma$$$) and mean ($$$\mu$$$) of the regional observations ($$$CV=\sigma/\mu\times100\%$$$). The CVs were computed for each ROI for individual and combined datasets with different acquisition schemes. Regional CVs were compared across atlases but within schemes (different number of ROIs: Mann-Whitney-U tests and FDR correction). To test whether variation is higher in the combined dataset (all schemes), its regional CVs were compared against single scheme datasets (Wilcoxon signed-rank tests and FDR correction).
Results
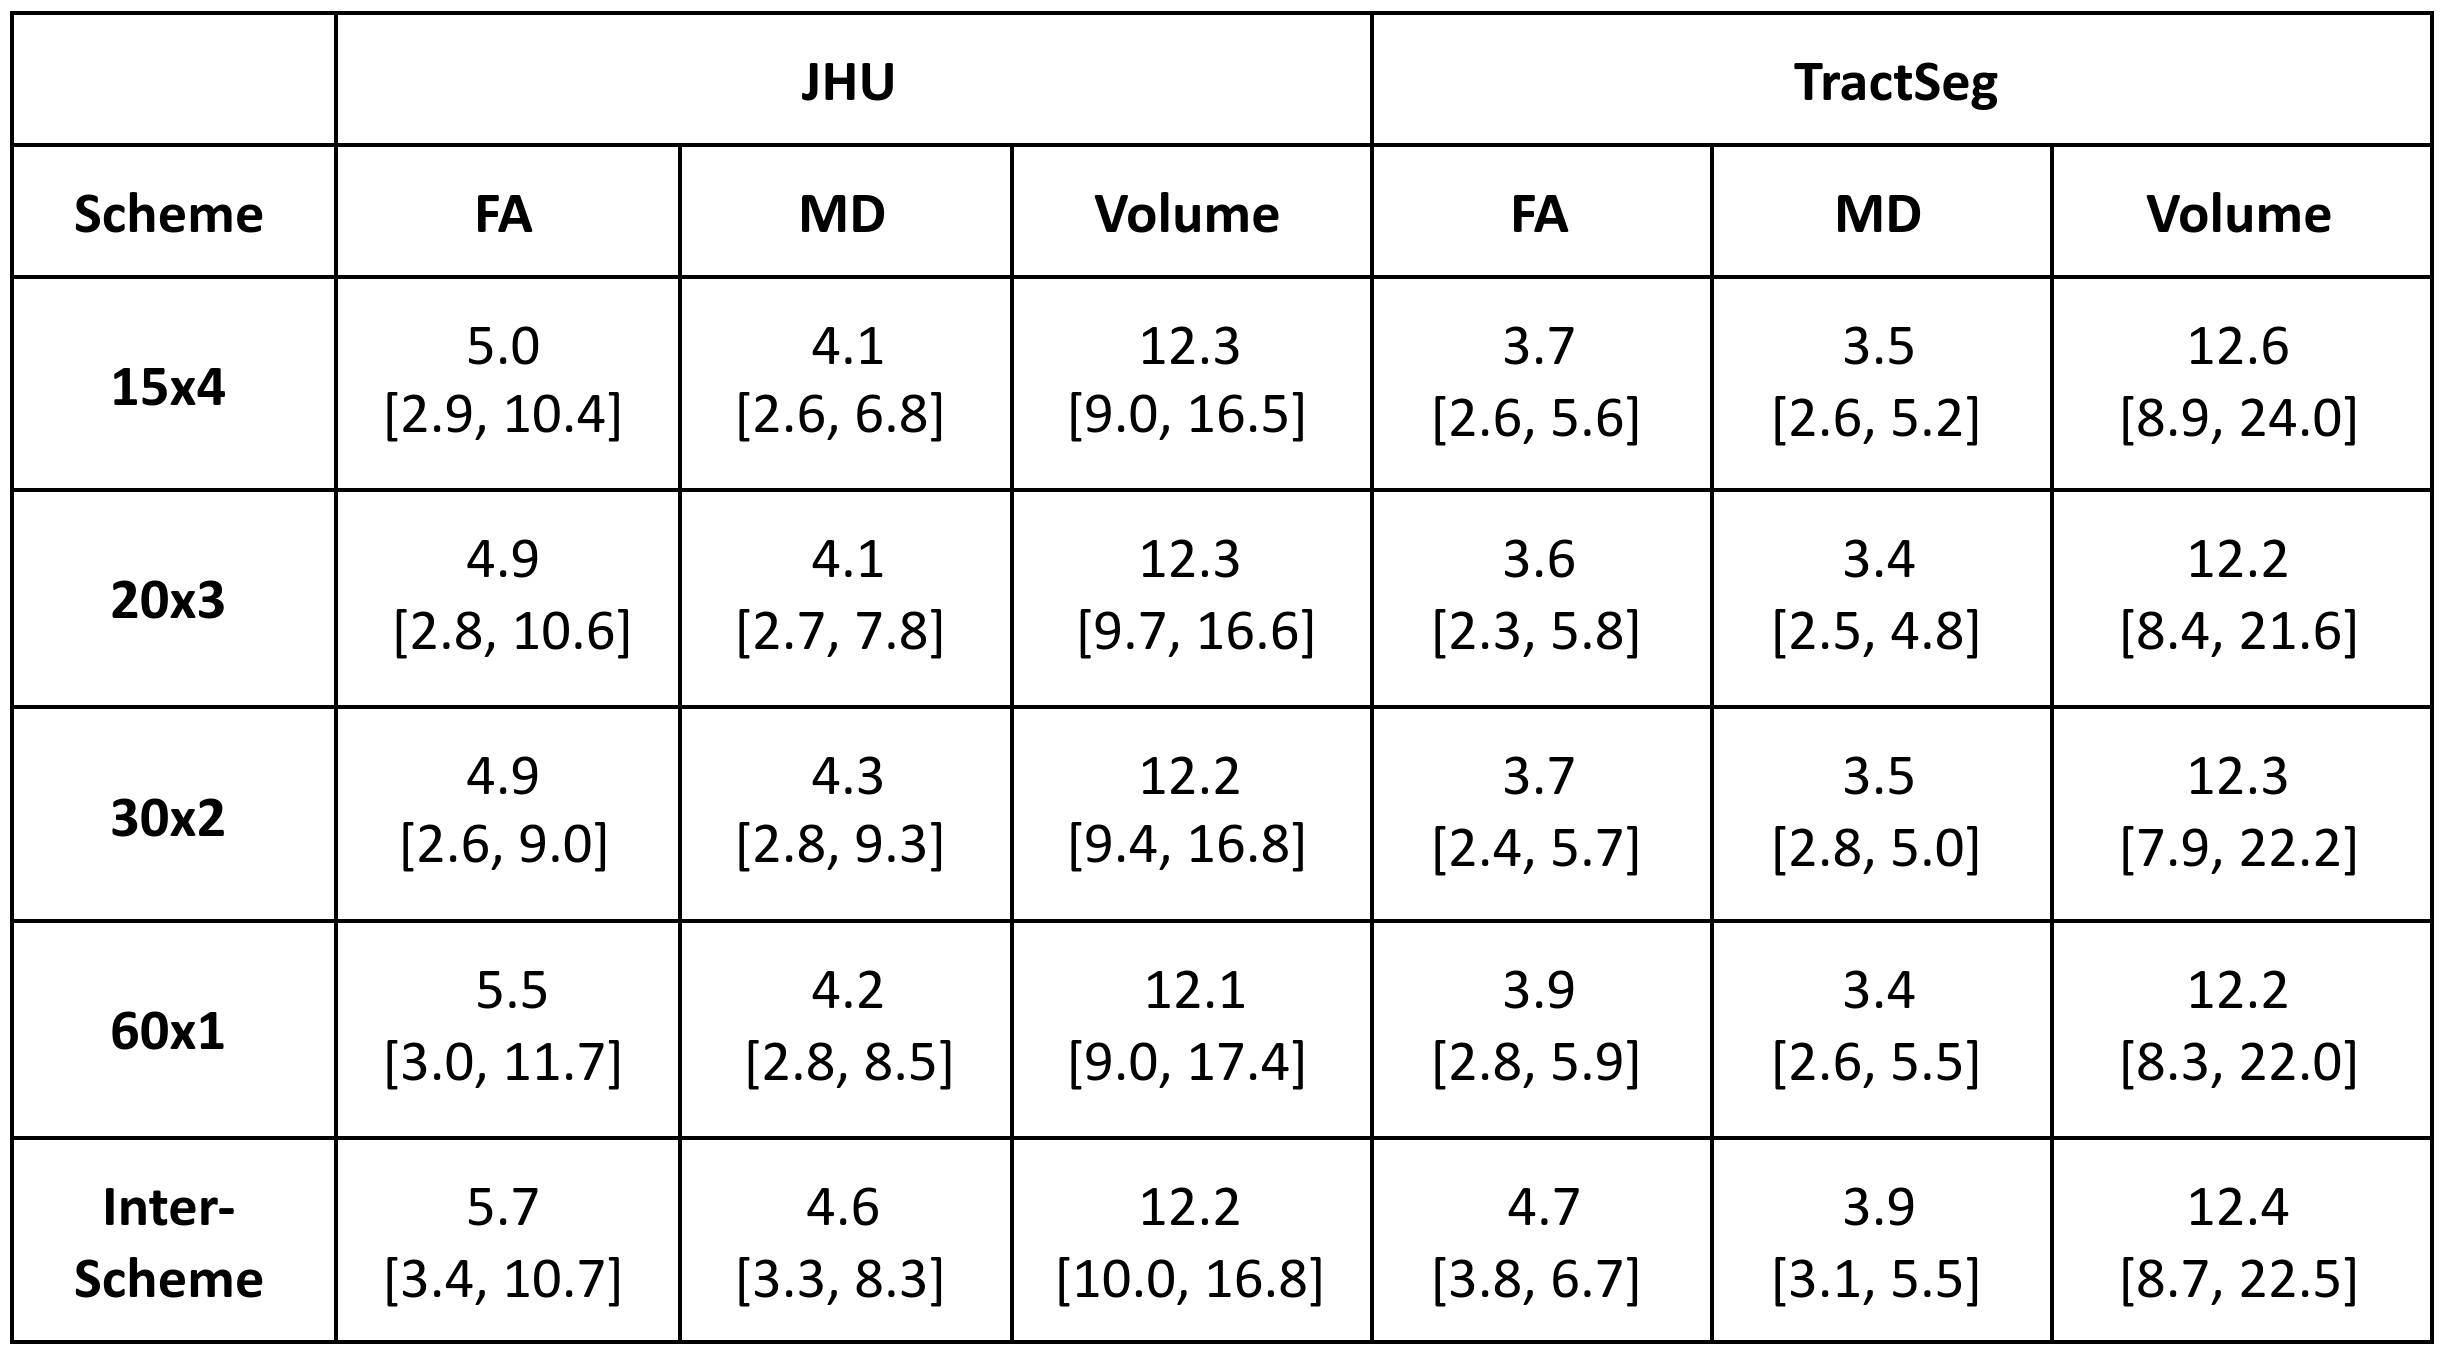
All JHU and TractSeg ROIs examined showed highly significant differences in both FA and MD across the acquisition schemes (all Friedman tests: pFDR < 0.0001). While JHU tracts demonstrated consistent tract volumes for the different protocols (all Friedman tests: pFDR > 0.3977), almost all volumes derived from TractSeg parcellations revealed significant differences between the four schemes (most Friedman tests: pFDR < 0.01). The volumes of the left superior longitudinal fascicle III (ROI #39) and left thalamo-precentral tract (ROI #50) were significantly different across schemes, but had higher p-values than most other ROIs. The exception was the left striato-precentral fibre tract volume (ROI #64) which was statistically indistinguishable (Friedman: pFDR = 0.0540). Figure 1 shows three representative examples. For all four schemes FA (Mann-Whitney-U: pFDR < 0.0046) and MD (Mann-Whitney-U: pFDR < 0.0121) showed significantly higher variation in JHU than in TractSeg ROIs (Table 1). No significant differences in volume variation were found between the atlases (Mann-Whitney-U: pFDR > 0.4962), however, TractSeg showed higher maximum CV values (Table 1). The variation of FA and MD in the combined dataset (inter-scheme) was significantly higher than in single DWI schemes for both atlases (most Wilcoxon tests: pFDR < 0.0001). Only single-shell FA (60x1) had similar CVs for JHU than the combined dataset (Wilcoxon: pFDR = 0.0897).Discussion & Conclusion
The registration-based segmentations were consistent for DWI scans collected with different numbers of shells. In contrast, WM fibre bundle volumes of TractSeg varied for different DWI acquisition schemes. TractSeg parcellations are predicted by a neural network, which may be more precise in distinguishing WM from grey matter than a registration approach. This was underlined by lower variation of regional diffusion observed in TractSeg than in JHU ROIs as the latter may include more grey matter voxels within WM fibre tract segmentations. Predictive models are, however, sensitive to domain shifts11, which is why TractSeg may fail for DWI protocols that are vastly different from the training data (Human Connectome Project12: 270 directions, b =1000, 2000, 3000 s/mm2).Acknowledgements
No acknowledgement found.References
1. Alexander, Andrew L., et al. "Diffusion tensor imaging of the brain." Neurotherapeutics 4.3 (2007): 316-329.
2. Veraart, Jelle, Els Fieremans, and Dmitry S. Novikov. "Diffusion MRI noise mapping using random matrix theory." Magnetic resonance in medicine 76.5 (2016): 1582-1593.
3. Kellner, Elias, et al. "Gibbs‐ringing artifact removal based on local subvoxel‐shifts." Magnetic resonance in medicine 76.5 (2016): 1574-1581.
4. Neto Henriques, Rafael. Advanced Methods for Diffusion MRI Data Analysis and their Application to the Healthy Ageing Brain. Diss. University of Cambridge, 2018.
5. Andersson, Jesper LR, and Stamatios N. Sotiropoulos. "An integrated approach to correction for off-resonance effects and subject movement in diffusion MR imaging." Neuroimage 125 (2016): 1063-1078.
6. Jeurissen, Ben, et al. "Multi-tissue constrained spherical deconvolution for improved analysis of multi-shell diffusion MRI data." NeuroImage 103 (2014): 411-426.
7. Smith, Stephen M., et al. "Advances in functional and structural MR image analysis and implementation as FSL." Neuroimage 23 (2004): S208-S219.
8. Avants, Brian B., Nick Tustison, and Gang Song. "Advanced normalization tools (ANTS)." Insight j 2.365 (2009): 1-35.
9. Mori, Susumu, et al. MRI atlas of human white matter. Elsevier, 2005.
10. Wasserthal, Jakob, Peter Neher, and Klaus H. Maier-Hein. "TractSeg-Fast and accurate white matter tract segmentation." NeuroImage 183 (2018): 239-253.
11. Daume III, Hal, and Daniel Marcu. "Domain adaptation for statistical classifiers." Journal of artificial Intelligence research 26 (2006): 101-126.
12. Van Essen, David C., et al. "The Human Connectome Project: a data acquisition perspective." Neuroimage 62.4 (2012): 2222-2231.
Figures
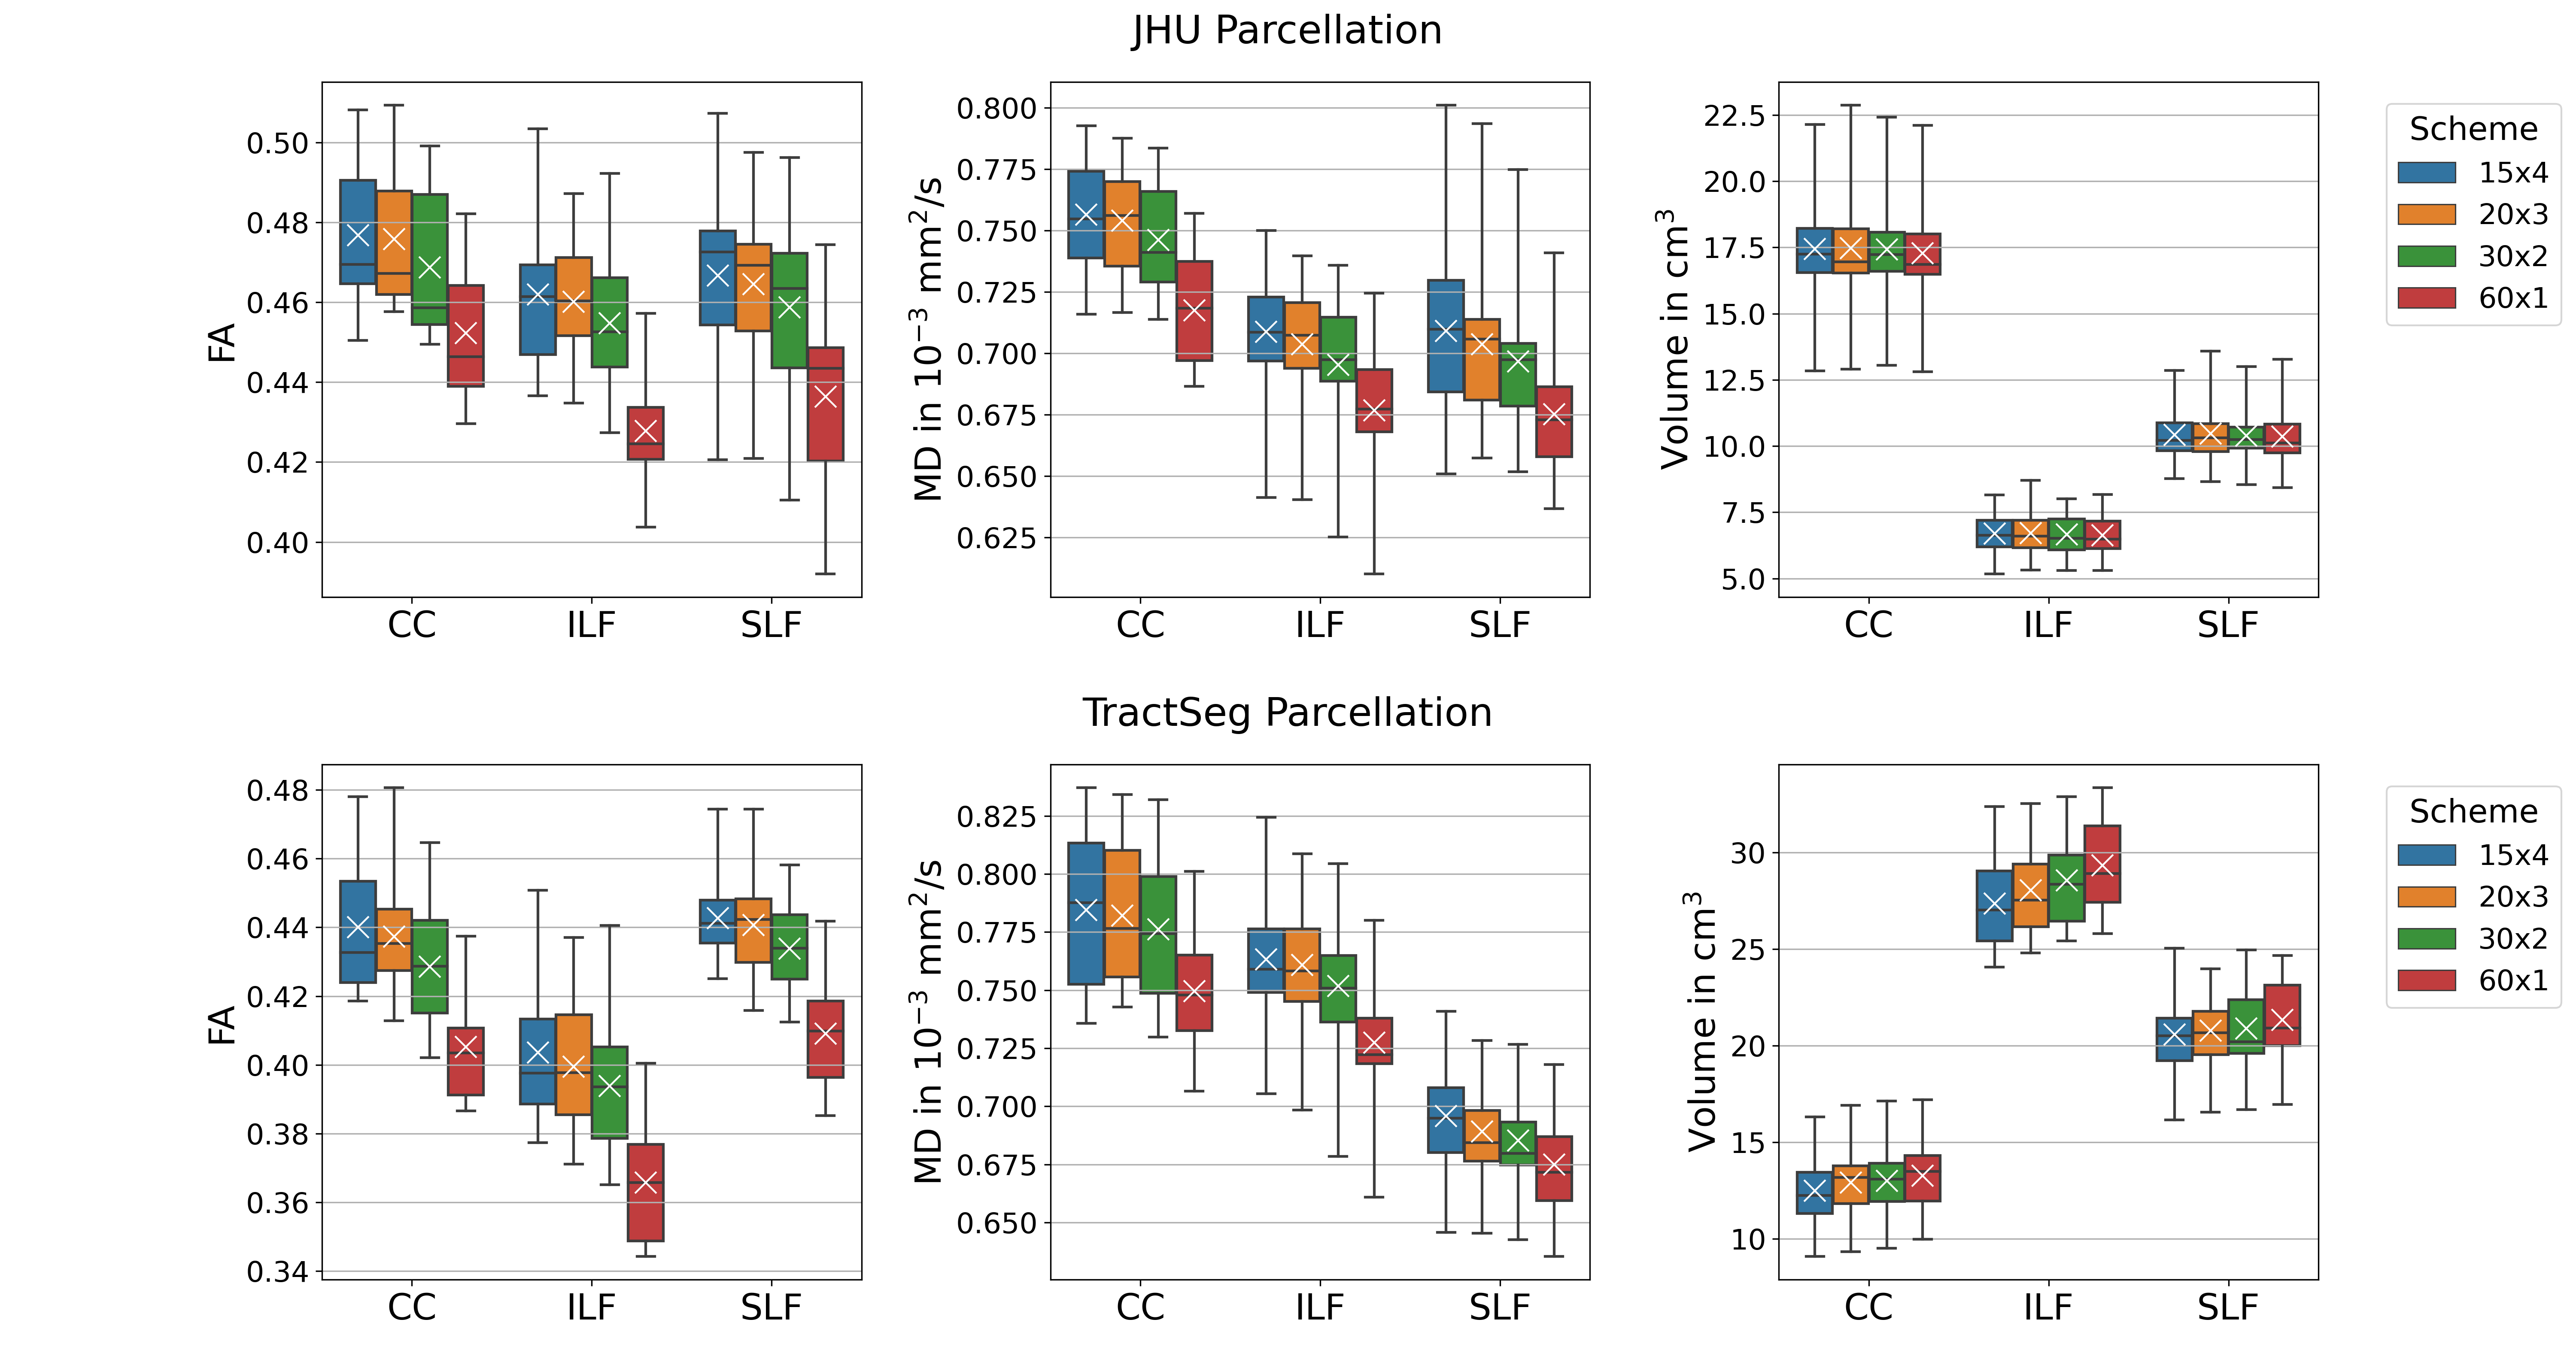
Figure 1. Variation in WM Parcellations. JHU: Forceps minor (CC, ROI #9), left inferior longitudinal fascicle (ILF, ROI #12) and superior longitudinal fascicle (SLF, ROI #14); TractSeg: Rostrum (CC, ROI#5), left inferior longitudinal fascicle (ILF, ROI #26) and superior longitudinal fascicle III (SLF, ROI #39). FA and MD were lowest for single-shell acquisition (60x1). Volumes were consistent for JHU, but varied for TractSeg. Note: Atlases do not exactly segment the same volumes.