3740
Algorithm for Automated Identification of Spectral Characteristics1Siemens Medical Solutions USA, Inc., Rochester, MN, United States, 2Siemens Healthcare GmbH, Erlangen, Germany
Synopsis
Automated identification of proton spectral characteristics has potential utility in accurate spectral fat saturation, improving dynamic shim routines, and optimizing bandwidth of radiofrequency pulses used in multi-slice or multi-band excitation. In this work, we present an algorithm for automated identification of fat and water proton spectral characteristics and evaluate its performance in 30 proton spectra from breast (number of subjects: n=20), ankle (n=11), and knee (n=9) anatomical regions.
Introduction
Automated identification of proton spectral characteristics has potential utility in accurate spectral fat saturation, improving dynamic shim routines, and optimizing bandwidth of radiofrequency pulses used in multi-slice or multi-band excitation (1–5). Spectral characteristics such as water and fat proton peak frequency, full width at half-maximum (or spectral widths) of water and (main) fat peaks could be used to optimize MR imaging and/or saturation preparation. In this work, we present an algorithm for automated identification of fat and water proton spectral characteristics and evaluate its performance in 30 proton spectra from breast (number of subjects: n=20), ankle (n=11), and knee (n=9) anatomical regions.Methods
ImagingMR Imaging was performed on 30 subjects at 3T (MAGNETOM Skyra, Siemens Healthcare, Erlangen, Germany) under the guidelines of an institutional review board. A prototype software program was used to read frequency adjustment information in the form of an xml file from the scanner and write an ascii file with the spectral frequency and amplitude information. 30 different spectra were generated from the 30 subjects imaged. 20 spectra were from the breast region, 11 from the ankle region, and 9 from the knee region.
Algorithm for Automated Identification of Spectral Characteristics
Flowchart of the proposed algorithm for automated identification of spectral characteristics is shown in Figure 1. Important aspects of the algorithm are summarized below:
1. Filter the spectrum to remove spurious peaks from noise.
2. Identify the local maxima with amplitude greater than 10% of the global maximum.
3. Identify the peak with highest frequency in the spectrum as the water peak.
4. Convert frequency data in Hz to ppm.
5. Identify the global maxima between −3.5pmm ± 0.5ppm from water peak as the main fat peak.
6. Identify the global minima between water and fat peaks as the “junction” frequency.
7. Determine characteristics of water and fat proton spectra using the peak and junction frequency information.
The 30 spectra saved in the ascii files were processed using a prototype implementation of the proposed algorithm in MATLAB, and the spectral characteristics (water and fat peak frequency and “junction” frequency) were determined.
Results
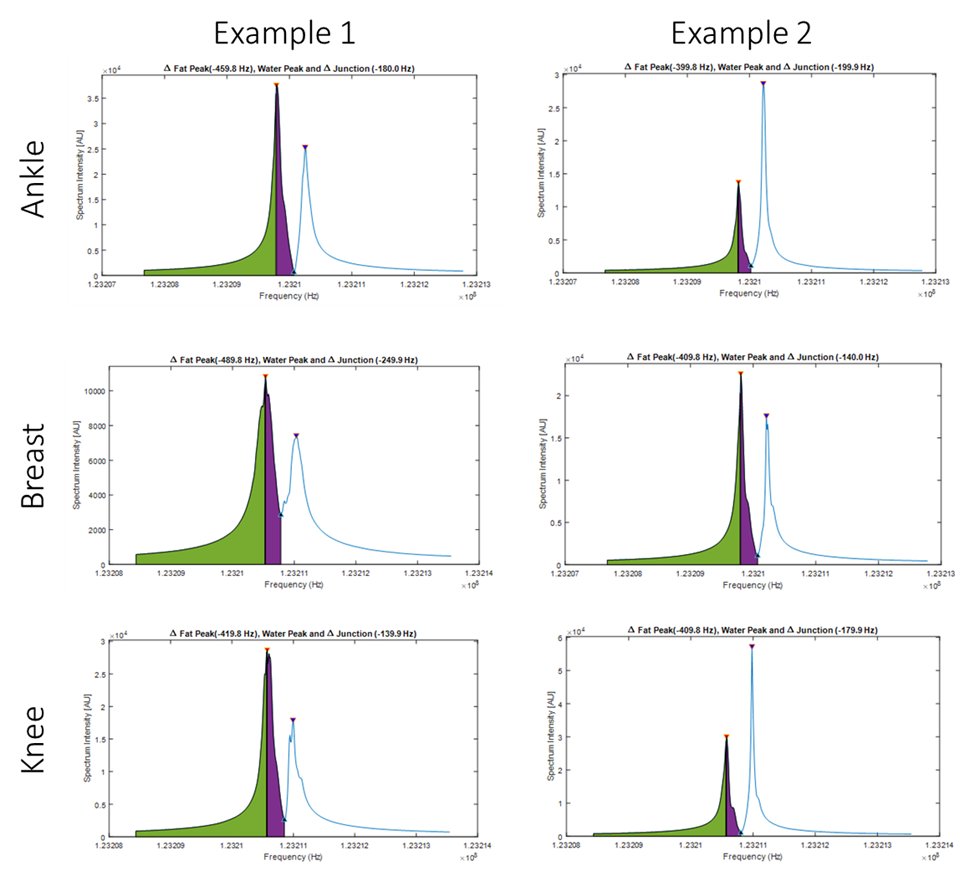
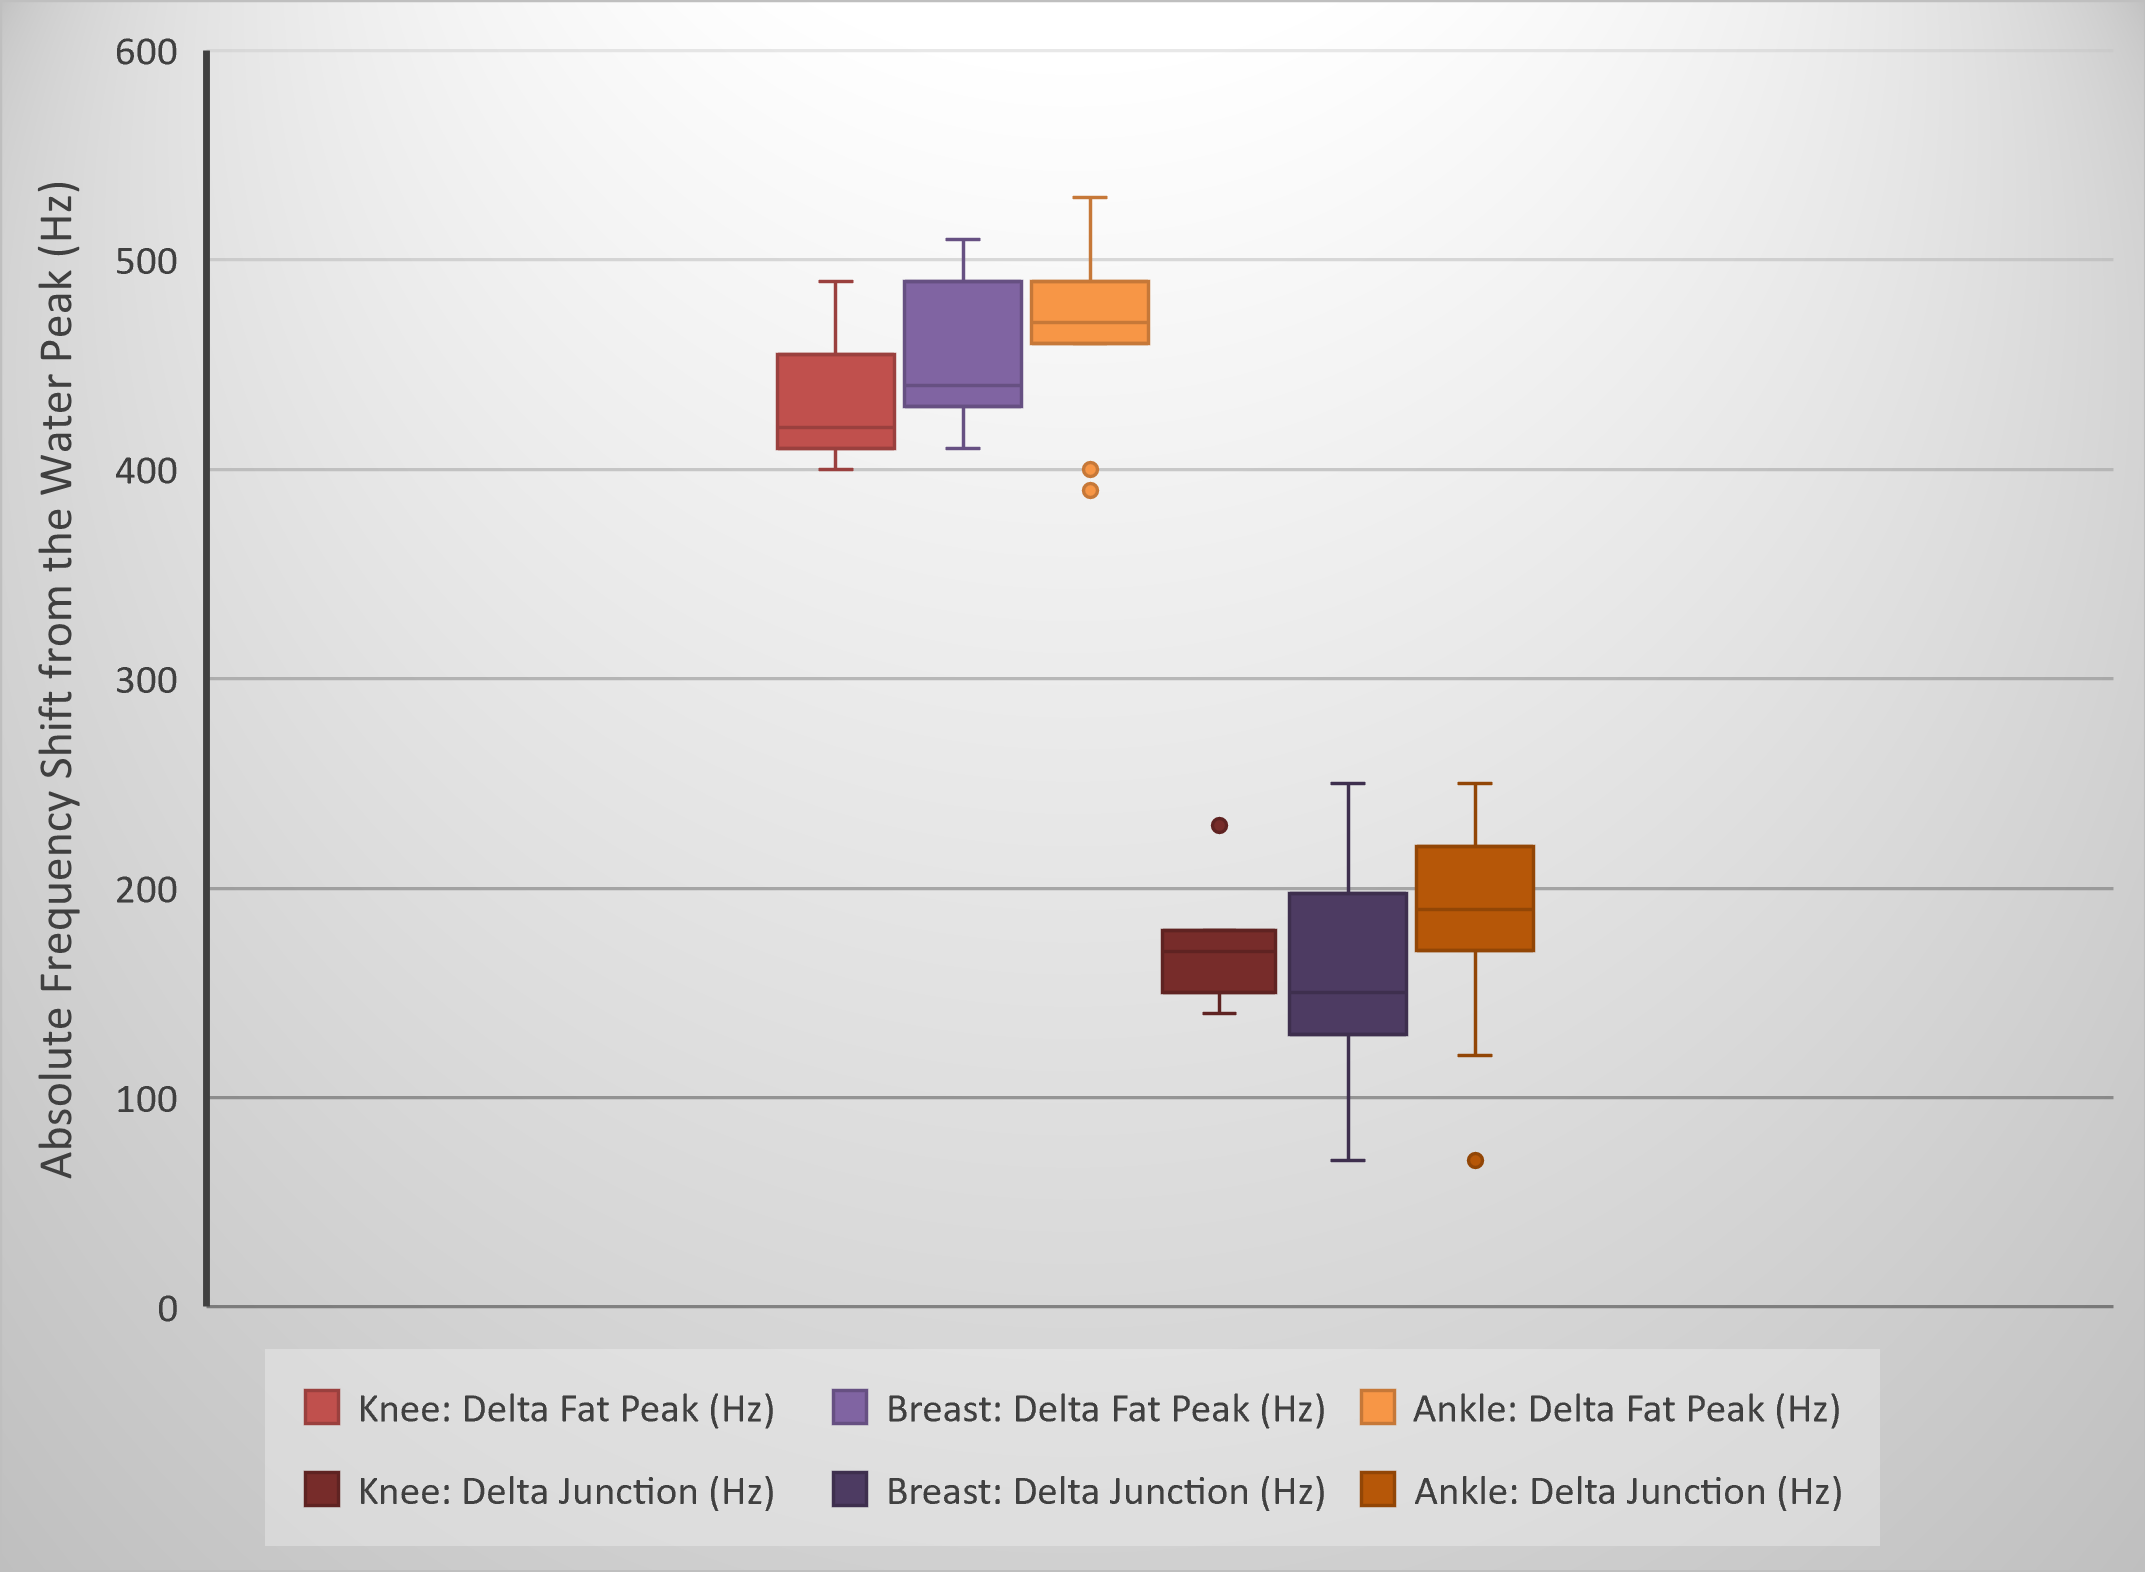
Figure 2 demonstrates the performance of the proposed algorithm on representative spectra from the breast, ankle, and knee regions. The results demonstrate the spectral heterogeneity between and among the regions of breast, ankle, and knee.Figure 3 shows box-and-whisker plots of the frequency difference between the water and (main) fat peaks for the spectra from the breast (n=20), ankle (n=11), and knee (n=9) regions. Box-and-whisker plots of the frequency difference between the water peak and the “junction” frequency are also shown in Figure 3. The spectral heterogeneity observed shows the impact of field homogeneity on the water and (main) fat peak frequency and spectral width in different anatomical regions.
Discussion
The proton spectra analyzed in this work are from the complete three-dimensional imaging volume (not from a single voxel). In addition to the chemical shift between water and fat, the offset between water and fat peak frequencies in the spectrum for the whole imaging volume depends on the field inhomogeneity differences between the fat-dominant and water-dominant regions. Hence, it is not identical with the chemical shift between water and fat, which is fixed. The variation in the “junction” frequency observed is an indicator of variation in spectral widths. The spectral heterogeneity observed is expected to impact the accuracy of spectral saturation methods that use a fixed offset (from the water peak) and bandwidth for fat saturating radiofrequency pulses. Information derived from peak and “junction” frequencies and spectral amplitudes could be used to optimize the bandwidths of excitation and saturating radiofrequency pulses and to improve dynamic shim routines.Conclusion
The proposed algorithm was successful in automated identification of proton spectral characteristics in 30 subjects and could potentially be used for accurate spectral fat saturation, improving dynamic shim routines, and optimizing bandwidth of radiofrequency pulses used in multi-slice or multi-band excitation.Acknowledgements
No acknowledgement found.References
1. Hu HH, Börnert P, Hernando D, et al.: ISMRM workshop on fat–water separation: Insights, applications and progress in MRI. Magn Reson Med 2012; 68:378–388.
2. Clauser P, Pinker K, Helbich TH, Kapetas P, Bernathova M, Baltzer PAT: Fat saturation in dynamic breast MRI at 3 Tesla: is the Dixon technique superior to spectral fat saturation? A visual grading characteristics study. Eur Radiol 2014; 24:2213–2219.
3. Juchem C, de Graaf RA: B0 magnetic field homogeneity and shimming for in vivo magnetic resonance spectroscopy. Anal Biochem 2017; 529:17–29.
4. Bachrata B, Strasser B, Bogner W, et al.: Simultaneous Multiple Resonance Frequency imaging (SMURF): Fat-water imaging using multi-band principles. Magn Reson Med 2021; 85:1379–1396.
5. Crijns S, Stemkens B, Sbrizzi A, Lagendijk J, van den Berg C, Andreychenko A: WE-G-18C-07: Accelerated Water/fat Separation in MRI for Radiotherapy Planning Using Multi-Band Imaging Techniques. Med Phys 2014; 41:530.
Figures