3739
Neuroimaging Pre-Processing and Quality Control for The European Prevention of Alzheimer’s Dementia (EPAD) Cohort Study1VUmc Amsterdam, Amsterdam, Netherlands, 2MRC unit for Lifelong Health and Ageing at UCL, London, London, United Kingdom, 3Department of Neurodegenerative Disease, Dementia Research Centre, London, United Kingdom, 4Centre for Medical Image Computing UCL, London, United Kingdom, 5School of Biomedical Engineering & Imaging Sciences, King’s College London, London, United Kingdom, 6CIRD Centre d’Imagerie Rive Droite, Geneva, Switzerland, 7Department of Surgical Sciences, Radiology, Uppsala University, Uppsala, Sweden, 8Barcelonaβeta Brain Research Center (BBRC), Pasqual Maragall Foundation, Barcelona, Spain, 9CIBER Fragilidad y Envejecimiento Saludable (CIBERFES), Madrid, Spain, 10IMIM (Hospital del Mar Medical Research Institute), Barcelona, Spain, 11Universitat Pompeu Fabra, Barcelona, Spain, 12CIBER Bioingeniería, Biomateriales y Nanomedicina (CIBER-BBN), Madrid, Spain, 13Department of Neurodegenerative Disease, Dementia Research Centre, UCL, London, United Kingdom, 14Neuroradiological Academic Unit, UCL Queen Square Institute of Neurology, London, United Kingdom, 15Centre for Medical Image Computing, University College London, London, United Kingdom, 16Nuclear Magnetic Resonance Research Unit, Queen Square Multiple Sclerosis Centre, University College London Institute of Neurology, London, United Kingdom, 17Department of Medical Physics and Biomedical Engineering, Centre for Medical Image Computing, University College London, London, United Kingdom, 18e-Health Centre, Open University of Catalonia, Barcelona, Spain, 19Helmholtz‐Zentrum Dresden‐Rossendorf, Institute of Radiopharmaceutical Cancer Research, Dresden, Germany, 20IXICO, London, United Kingdom, 21Imperial College London, London, United Kingdom, 22Takeda Pharmaceuticals Ltd., Cambridge, MA, United States, 23Université de Normandie, Unicaen, Inserm, U1237, PhIND "Physiopathology and Imaging of Neurological Disorders", institut Blood-and-Brain @ Caen-Normandie, Cyceron, Caen, France, 24Department of Nuclear Medicine, Toulouse CHU, Purpan University Hospital, Toulouse, France, 25Toulouse NeuroImaging Center, University of Toulouse, INSERM, UPS, Toulouse, France, 26Centre for Clinical Brain Sciences, The University of Edinburgh, Edinburgh, Scotland, 27Laboratory Alzheimer’s Neuroimaging & Epidemiology, IRCCS Istituto Centro San Giovanni di Dio Fatebenefratelli, Brescia, Italy, 28University Hospitals and University of Geneva, Geneva, Switzerland, 29Centre for Dementia Prevention, The University of Edinburgh, Edinburgh, Scotland, 30UK Dementia Research Institute at Edinburgh, University of Edinburg, Edinburgh, Scotland, 31Department of Medicine, Imperial College London, London, United Kingdom, 32Institute of Neurology and Healthcare Engineering, University College London, London, United Kingdom, 33Ghent Institute for Functional and Metabolic Imaging (GIfMI), Ghent University, Ghent, Belgium
Synopsis
The neuroimaging community strives to obtain large data cohorts, usually through association within consortia spanning different sites and countries. This results in increased variability of acquisition parameters and scan quality, which can affect image processing and statistical analyses. We propose a semi-automatic data management pipeline to process raw data, assess quality and compute image-derived phenotypes from multi-modal MRI scans, as developed for the multi-centre European Prevention of Alzheimer Dementia longitudinal cohort study (EPAD LCS).
Introduction
Data sharing in neuroimaging research communities has become increasingly popular, with multiple collaborative efforts for pooling data to form large and diverse samples1,2. The limited standardization of image acquisition protocols across sites with different scanner types and the heterogeneity of exported data structures and processing pipelines represent major challenges for Research Data Management (RDM) in multisite cohort studies3. Additionally, no clear procedure for MRI quality control (QC) in large cohort studies exists4. Here, we describe the methodological advances and implementation details of the MRI data processing and QC procedures developed for the European Prevention of Alzheimer Dementia (EPAD) neuroimaging dataset5.Method
The EPAD v1500.0 MRI acquisition protocolThe EPAD v1500.0 release is the baseline data release of the EPAD LCS study and includes data from the first 1500 participants consented in the study6. The imaging protocol is composed of core and advanced sequences. The core image acquisitions (3D T1w, 3D FLAIR, 2D T2w, 2D T2star) are conducted at all sites and provide structural information. The advanced MRI protocol (resting-state fMRI, diffusion tensor imaging, arterial spin labeling, susceptibility weighted imaging) is performed in a subset of EPAD sites with sufficient expertise and equipment, and investigates brain function and structure in greater detail.
The EPAD Image Processing Pipeline
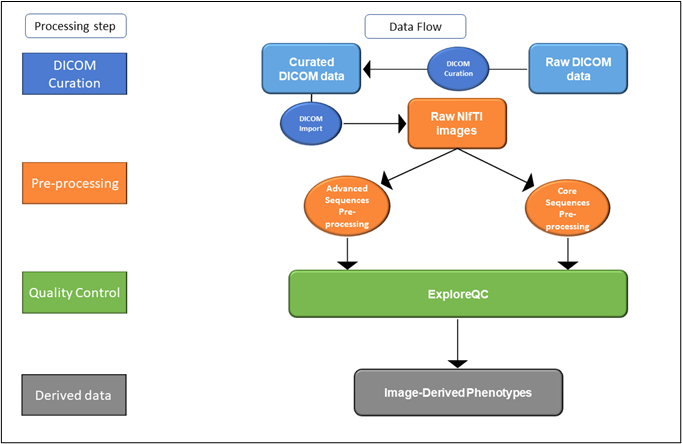
The EPAD image processing pipeline consisted of four modules (Figure 1): 1) Curation of raw DICOM files, including conversion to Neuroimaging Informatics Technology Initiative (NifTI) format; 2) Image pre-processing of core and advanced sequences; 3) Semi-automatic quality control (QC) 4) Image-derived Phenotypes (IDPs) computation7, i.e. extraction of summary measures from images.
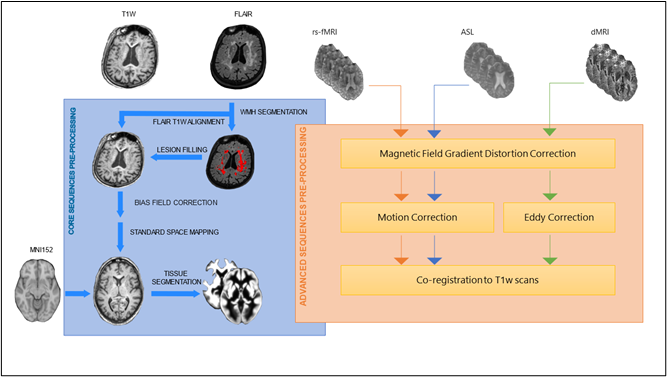
DICOM data were automatically parsed for series description identification using regular expressions and sorted into folders with a unique structure throughout the dataset. Pre-processing of core and advanced sequences is shown in Figure 2, and was implemented in ExploreASL 1.0.28, with the addition of BaMos9, FSL 610 and SPM 1211.
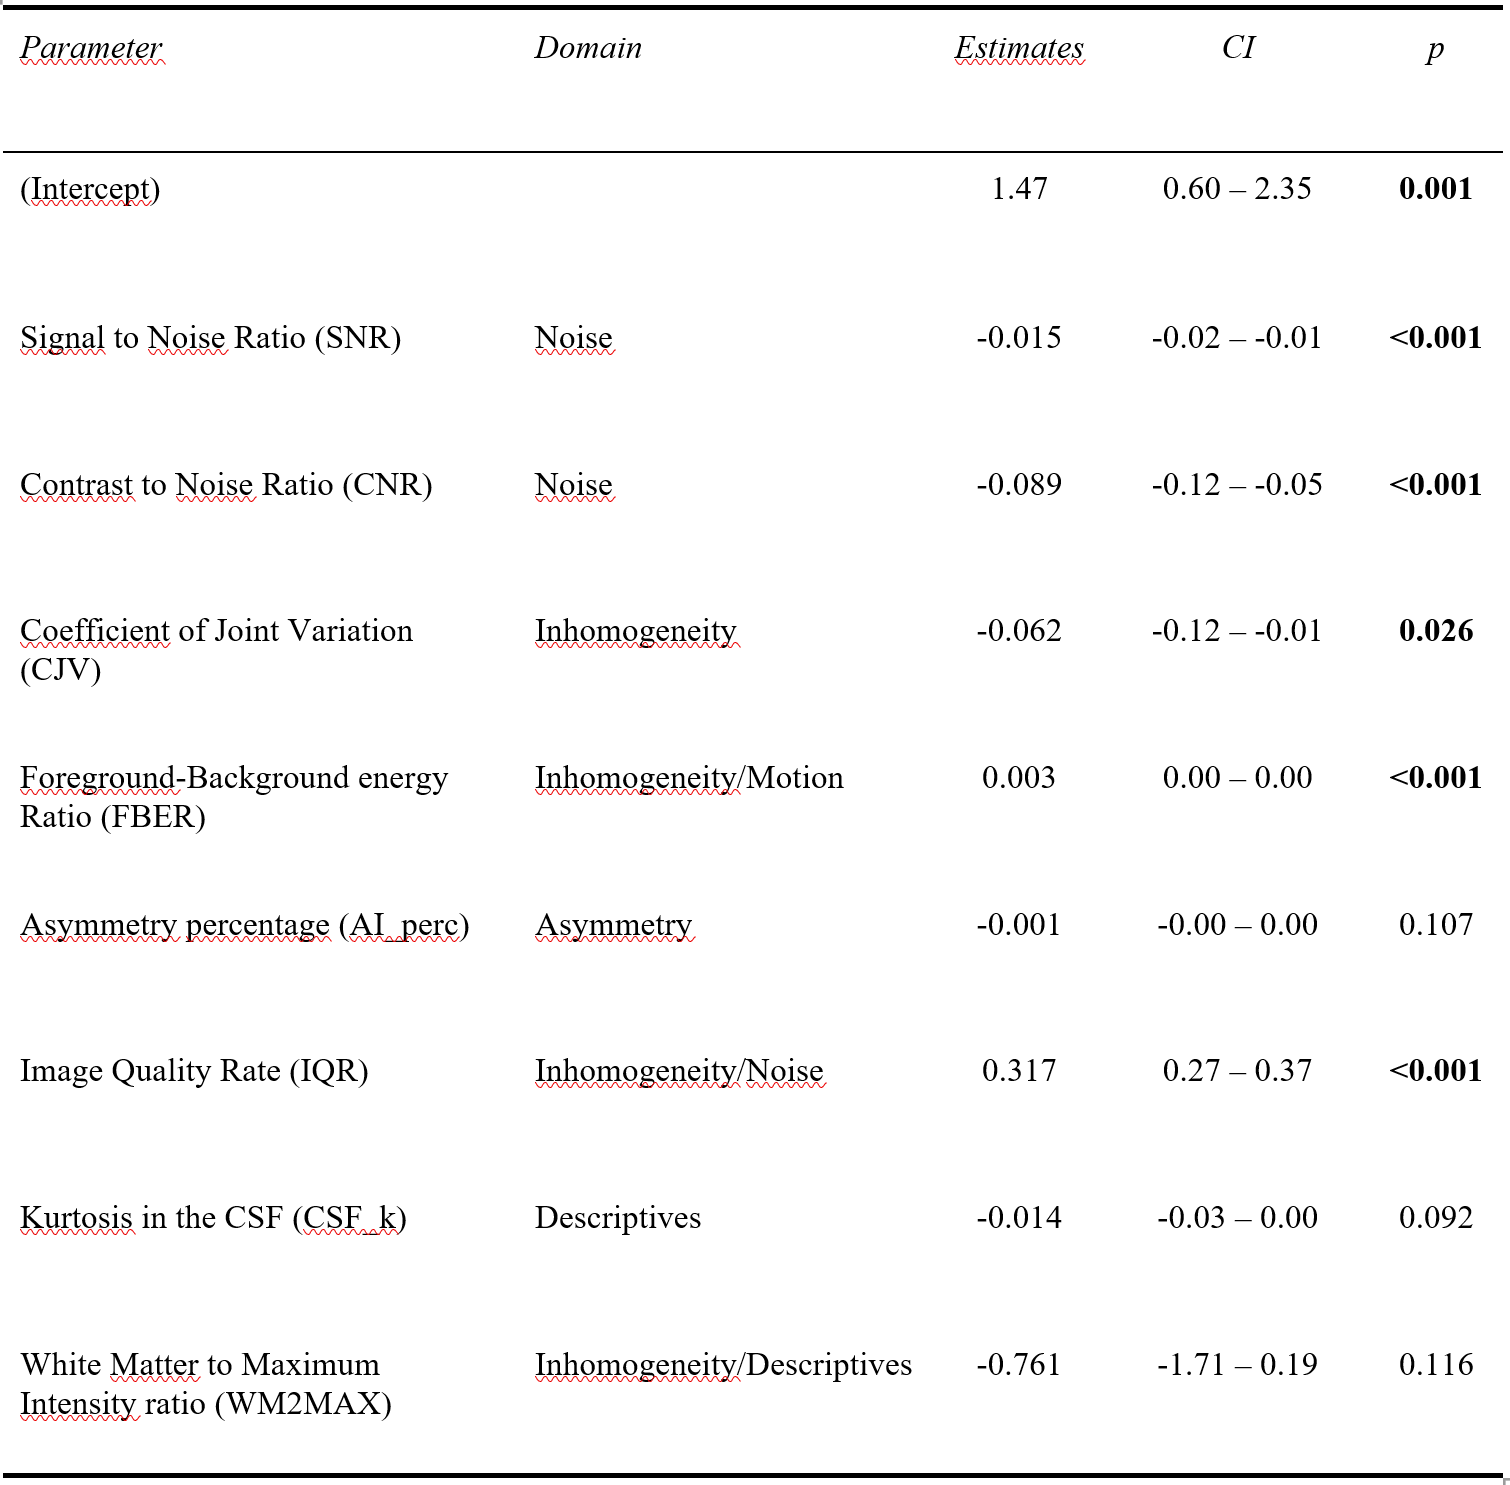
We developed and integrated ExploreQC: a two-module toolbox for the implementation of semi-automated MRI Quality Control of 3D T1w scans. The parameter estimation module was used to compute QC parameters defined over five Image Features Domains (IFDs): Noise, Motion, Inhomogeneity, Asymmetry, and Descriptives. The visualization module creates an interactive dashboard reporting within and between site parameter distributions and flags the 15% of scans showing the highest deviation from the site mean as “needing visual QC”. The flagged, and an equivalent number of non-flagged, images were visually inspected and judged as “good”, “moderate”, or “poor” quality, by a blinded rater. As an explorative step, we built a multiple logistic regression model with QC parameters predicting the output of the visual judgement and performed a stepwise backward feature selection based on Akaike Information Criteria to investigate the informative character of each metric.
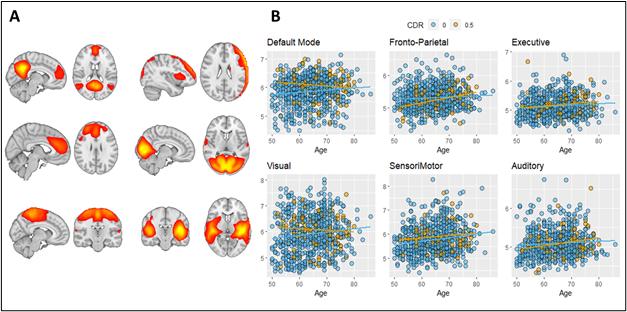
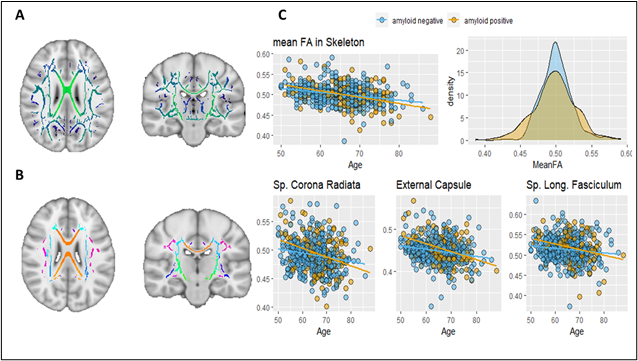
Core sequences’ IDPs include regional volume and thickness values using the FreeSurfer12 and LEAP13 segmentation pipelines, and global white matter hyperintensity (WMH) load as measured by BaMoS9. A group-level independent component analysis (ICA) was performed with FSL melodic on the processed functional MRI (fMRI) dataset to extract mean functional connectivity for each resting-state network (Figure 3). FSL tract-based spatial statistics (TBSS) pipeline was used on Diffusion Tensor Imaging (DTI) derived fractional anisotropy (FA) images to compute 48 regional features according to the JHU ICBM-DTI-81 atlas14 (Figure 4). Mean cerebral blood flow (CBF) and spatial coefficient-of-variation (sCoV) were computed from Arterial Spin Labeling (ASL) scans as described previously8. To evaluate IDPs biological relevance we assessed their relationship with non-imaging metadata.
Results
Of the 1500 screened participants, 142 did not fulfill eligibility criteria and were therefore excluded from the release6. The resulting dataset included 1358 core sequences, 756 SWI, 842 fMRI, 831 DTI, and 858 ASL scans.Of the 197 automatically flagged scans, 16 were categorized as “poor quality” upon visual inspection, while 51 were labelled as “moderate quality”. Of the equivalent number of non-flagged scans only one was labelled “poor” while 10 were judged “moderate”. Backward parameter elimination included 8 out of the 12 structural QC parameters in the final selected model. Five of those were significantly associated with the visual QC output (Table 1).
A total of 358 IDPs were computed from core sequences as described above. From advanced sequences we derived 119 IDPs. Figure 3 and 4 show example associations with other non-imaging metadata.
Conclusion
Here, we presented the semi-automated pipeline used to process and extract relevant features from a multimodal and multicenter MRI cohort. We introduced a QC toolbox for the computation and visualization of informative parameters for guiding image inclusion in large studies. Our work may benefit both imaging and non-imaging researchers accessing the EPAD data as well as investigators aiming to apply a similar procedure in other multi-center cohorts.Acknowledgements
No acknowledgement found.References
1. Thompson, P. M. et al. The ENIGMA Consortium: large-scale collaborative analyses of neuroimaging and genetic data. Brain Imaging Behav. 8, 153–182 (2014).
2. Alfaro-Almagro, F. et al. Image processing and Quality Control for the first 10,000 brain imaging datasets from UK Biobank. Neuroimage 166, 400–424 (2018).
3. Nourani, A., Ayatollahi, H. & Dodaran, M. S. Clinical Trial Data Management Software: A Review of the Technical Features. Rev. Recent Clin. Trials 14, 160–172 (2019)
.4. Esteban, O. et al. Crowdsourced MRI quality metrics and expert quality annotations for training of humans and machines. doi:10.1101/420984.
5. EPAD. http://ep-ad.org/.
6. Solomon, A. et al. European Prevention of Alzheimer’s Dementia Longitudinal Cohort Study (EPAD LCS): study protocol. BMJ Open 8, e021017 (2019).
7. Gong, W., Beckmann, C. F. & Smith, S. M. Phenotype Discovery from Population Brain Imaging. bioRxiv (2020).
8. Mutsaerts, H. J. M. M. et al. ExploreASL: An image processing pipeline for multi-center ASL perfusion MRI studies. Neuroimage 219, 117031 (2020).
9. Sudre, C. H. et al. Bayesian model selection for pathological neuroimaging data applied to white matter lesion segmentation. IEEE Trans. Med. Imaging 34, 2079–2102 (2015).
10. Jenkinson, M., Beckmann, C. F., Behrens, T. E. J., Woolrich, M. W. & Smith, S. M. FSL. NeuroImage vol. 62 782–790 (2012).
11. Penny, W. D., Friston, K. J., Ashburner, J. T., Kiebel, S. J. & Nichols, T. E. Statistical Parametric Mapping: The Analysis of Functional Brain Images. (Elsevier, 2011).
12. Fischl, B. FreeSurfer. Neuroimage 62, 774–781 (2012).
13. Wolz, R. et al. LEAP: learning embeddings for atlas propagation. Neuroimage 49, 1316–1325 (2010).
14. Wakana, S., Jiang, H., Nagae-Poetscher, L. M., van Zijl, P. C. M. & Mori, S. Fiber tract-based atlas of human white matter anatomy. Radiology 230, 77–87 (2004).
Figures