3737
YTTRIUM: QC algorithm for the processed diffusion maps in UK Biobank 18608 sample1Western Norway University of Applied Sciences, Bergen, Norway, 2NORMENT, University of Oslo, Oslo, Norway
Synopsis
Diffusion MRI is a powerful approach to quantify brain architecture. However, diffusion scalar maps derived from raw data are sensitive to the data quality and processing choices. Many quality control algorithms exist that perform a robust check of raw diffusion data, there is a lack of QCs for inspecting the derived maps from different diffusion approaches. We present a novel QC algorithm for processed scalar maps using mean skeleton values (in the context of tract-based spatial statistics) and structural similarity metric based on the scalar maps. The algorithm builds on clustering of scalar diffusion metrics from 18609 UK Biobank individuals.
Introduction
Diffusion MRI produces many scalar diffusion maps providing information about the human brain architecture and microstructure1. Diffusion data are prone to experimental artefacts and vulnerable to various sources of noise, susceptibility distortions, and head motions2. Established quality control (QC) approaches perform a robust check of diffusion data in order to flag and remove bad images. However, the majorityof QC approaches focus on the raw diffusion data3, not on post-processed and estimated diffusion scalar maps. To complement the previous pipelines, we develop a QC algorithm that works on the processed scalar diffusion data prior to any statistical analysis.Methods
We used diffusion data from 18,608 participants of the UK Biobank (UKB)4, passed through initial QC by the original UKB algorithm. The diffusion data were post-processed using an optimised pipeline2. Diffusion scalar metrics were evaluated from diffusion and kurtosis tensor imaging5 and a white matter tract integrity model6. The algorithmic workflow of the developed QC algorithm (YTTRIUM: fast qualitY conTrol meThod foR derIved diffUsion Metrics) is presented in Fig. 1. All data were normalised to MNI space and processed in accordance with tract-based spatial statistics pipeline7. The mean diffusion values averaged over the subject’s skeleton were estimated. Structural similarity8 (SSIM) was evaluated for each subject using the mean diffusion metric averaged over 18608 individuals as a reference image. In order to detect images containing any type of artefacts, e.g. invalid metric estimation or incorrect normalisation, we estimated a distribution of distances from the cluster centroid using k-means in 2D space of mean diffusion values vs SSIM. The final filtration of the 2D (mean values, SSIM) data is based on a density-based spatial clusterisation algorithm9 (bdscan).We assessed the practical relevance of removing outliers using brain age prediction accuracy at different QC thresholds. In order to evaluate brain age gap, i.e. the difference between chronological and predicted ages, we used a linear model with multiple regressors10. For statistical purposes and estimation of the robustness of the results, we repeated model training 100 times, randomly choosing the training samples from the whole UKB sample. For each sample size between 1000 and 15000 subjects, a number of outliers presented in the training samples were from 47.6% up to 3.17%, respectively. The tests of the trained model were performed on the fixed sample of 1000 subjects without presence of any outliers.
Results
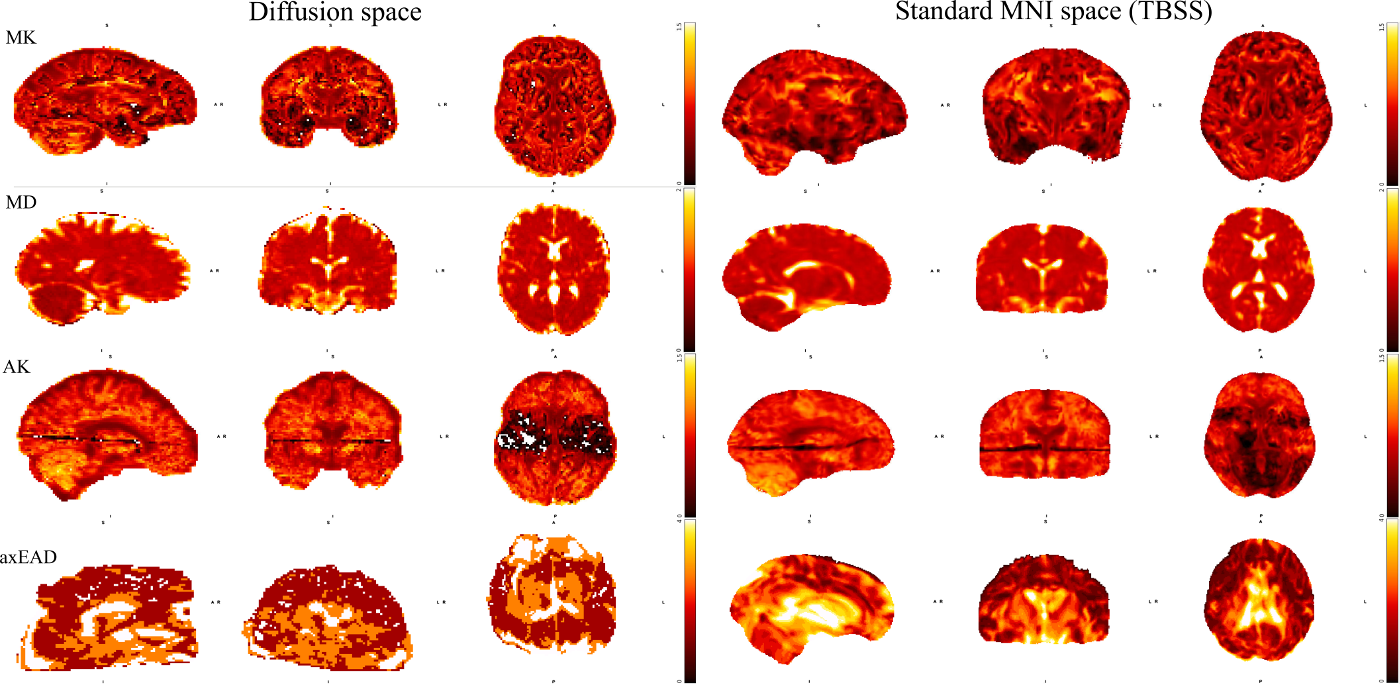
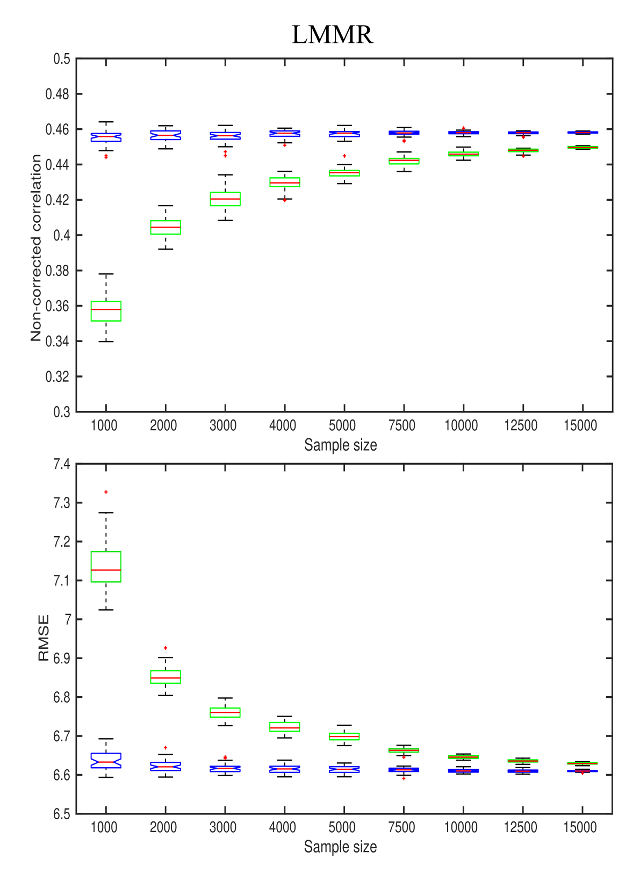
In Fig. 2 we present example images detected and marked as outliers by the proposed algorithm. Notably, the detected outliers passed the standard UKB QC approach. Fig. 3 shows the effect of sample size in the training set and outlier detection on the resulting age prediction accuracy. Briefly, in data without outliers (blue boxplots) the correlations between predicted and chronological ages increase slowly depending on the sample size. In turn, in the case of outlier presence (green boxplots), both the correlations and errors change dramatically in line with the sample size.Discussion
The proposed QC algorithm (see Fig. 1) based on the diffusion data density features enables an efficient procedure for the reliable data filtration in large data samples. This allowed us to describe each subject by a scalar diffusion value, averaged over anatomical region and natural image features, derived from SSIM. Importantly, the SSIM values were estimated in line with the mean reference image evaluated for all diffusion scalar maps in the sample, including possible outliers. Due to the large sample size, influence of the outliers on the mean maps is negligible. Notably, the proposed method is sensitive to data which have good quality in the diffusion space, but exhibited problems along the normalisation step, e.g. due to misalignment or anatomical abnormalities (see Fig. 2). Illustrating the value of this QC approach, the algorithm improved an estimation of brain age gap depending on a training sample and percentage of outliers in the training set.Conclusion
In summary, our results suggest that the proposed QC algorithm is proficient in data quality validation and can be used as a complementary test for the diffusion scalar maps in order to increase a reliability of the subsequent statistical analysis.Acknowledgements
This work was funded by the Research Council of Norway (249795). This research has been conducted using the UK Biobank under Application 27412. This work was performed on the TSD (Tjeneste for Sensitive Data) facilities, owned by the University of Oslo, operated and developed by the TSD service group at the University of Oslo, IT-Department (USIT). Computations were also performed on resources provided by UNINETT Sigma2 – the National Infrastructure for High Performance Computing and Data Storage in Norway.References
1. Jones, “Diffusion MRI: Theory, Methods, and Applications”. Oxford University Press, 2011.
2. Maximov, Alnaes, Westlye. Human Brain Mapping 40 (2019) 4146-4162.
3. Alfaro-Almagro, Jenkinson, Bagreter, et al., Neuroimage 166 (2018) 400-424.
4. Miller, Alfaro-Almagro, Bangerter, et al., Nature Neuroscience 19 (2016) 1523-1536.
5. Jensen, Helpern, Ramani et al., Magnetic Resonance in Medicine 53 (2005) 1432-1440.
6. Fieremans, Jensen, Helpern, Neuroimage 58 (2011) 177-188.
7. Smith, Johansen-Berg, Jenkinson, et al., Nature Protocols 2 (2007) 499-503.
8. Wang, Bovik, Sheikh et al., IEEE Trans Image Processing 13 (2004) 600-612.
9. Ester, Kriege, Sanders, et al., Proc. 2nd Intl. Conf. Knowl. Disc. Data Mining (1996) 226-231.
10. Smith, Vidaurre, Alfaro-Almagro, et al., Neuroimage 200 (2019) 528-539.
Figures
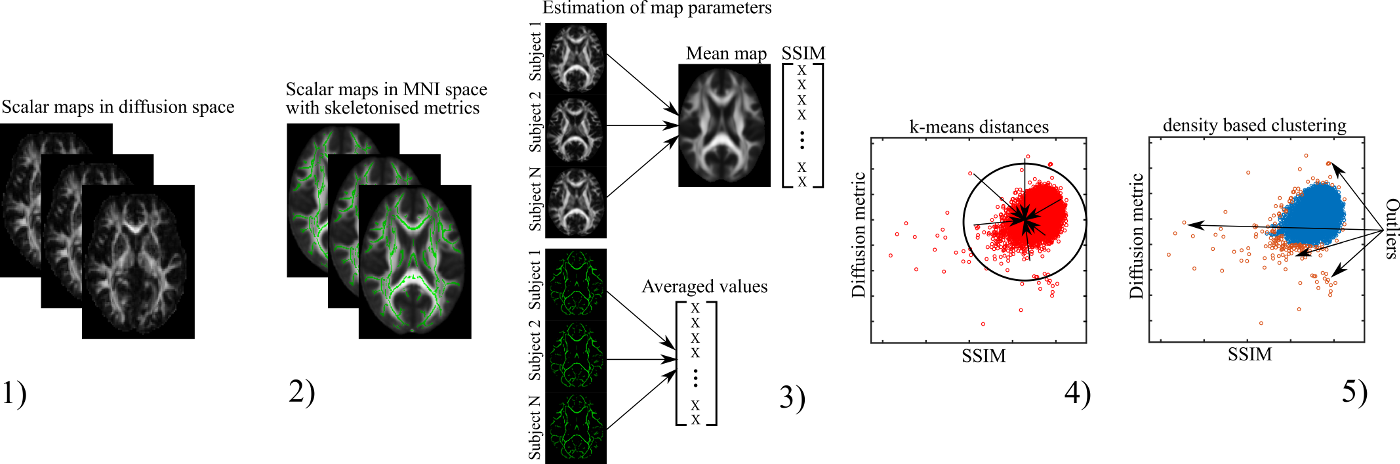
Figure 1 The developed QC algorithm consists of 5 steps: 1) estimation of diffusion scalar maps; 2) normalisation of scalar maps to MNI space by TBSS procedure; 3) estimation of SSIM and skeleton-averaged metrics for each subject; 4) application of k-means-derived distances for one cluster centroid; 5) data filtration using the density-based spatial clusterisation