3735
Automated reference tissue normalization of prostate T2-weighted MRI on a large, multicenter dataset1Department of Circulation and Medical Imaging, Norwegian University of Science and Technology, Trondheim, Norway, 2Department of Physics, Norwegian University of Science and Technology, Trondheim, Norway, 3Department of Radiology and Nuclear Medicine, St. Olavs University Hospital, Trondheim, Norway, 4Department of Cancer Research and Molecular Medicine, Norwegian University of Science and Technology, Trondheim, Norway, 5Department of Urology, St. Olavs University Hospital, Trondheim, Norway, 6Department of Medical Imaging and Intervention, Chang Gung Memorial Hospital at Linkou, Institute for Radiological Research, Chang Gung University, Taoyuan, Taiwan
Synopsis
Scanner-dependent variations induce non-standard signal intensities (SI) in T2-weighted (T2W) MR images. These variations make computer aided diagnosis of prostate cancer based on T2W images challenging, and SI normalization is necessary. Autoref is a normalization method for axial T2W prostate MRI based on two reference tissues of high and low intensity. The aim of this work was to evaluate Autoref’s performance on a large dataset, and to investigate its performance for various reference tissues. Femoral head and fat were proven to be stable reference tissues, significantly reducing inter-scan variation.
Introduction
There is no standard signal intensity (SI) in T2-weighted (T2W) MR images, due to variations in scanner parameters such as the field strength, coil type, signal amplification and acquisition protocols.1,2 This hinders quantitative analysis of the images, and makes computer aided diagnosis of prostate cancer based on T2W images challenging. Hence, a SI normalization is paramount.3 Autoref is an automated method for prostate T2W image normalization using fat and muscle as reference tissues recently developed in our group.4 The aim of this study was to evaluate and improve the performance of Autoref on multicenter data. For this purpose, a large set of axial T2W images from ten scanners located at three different institutions was put together. The potential of using femoral head and pelvic bone as reference tissues to enhance normalization performance and stability was also investigated.Methods
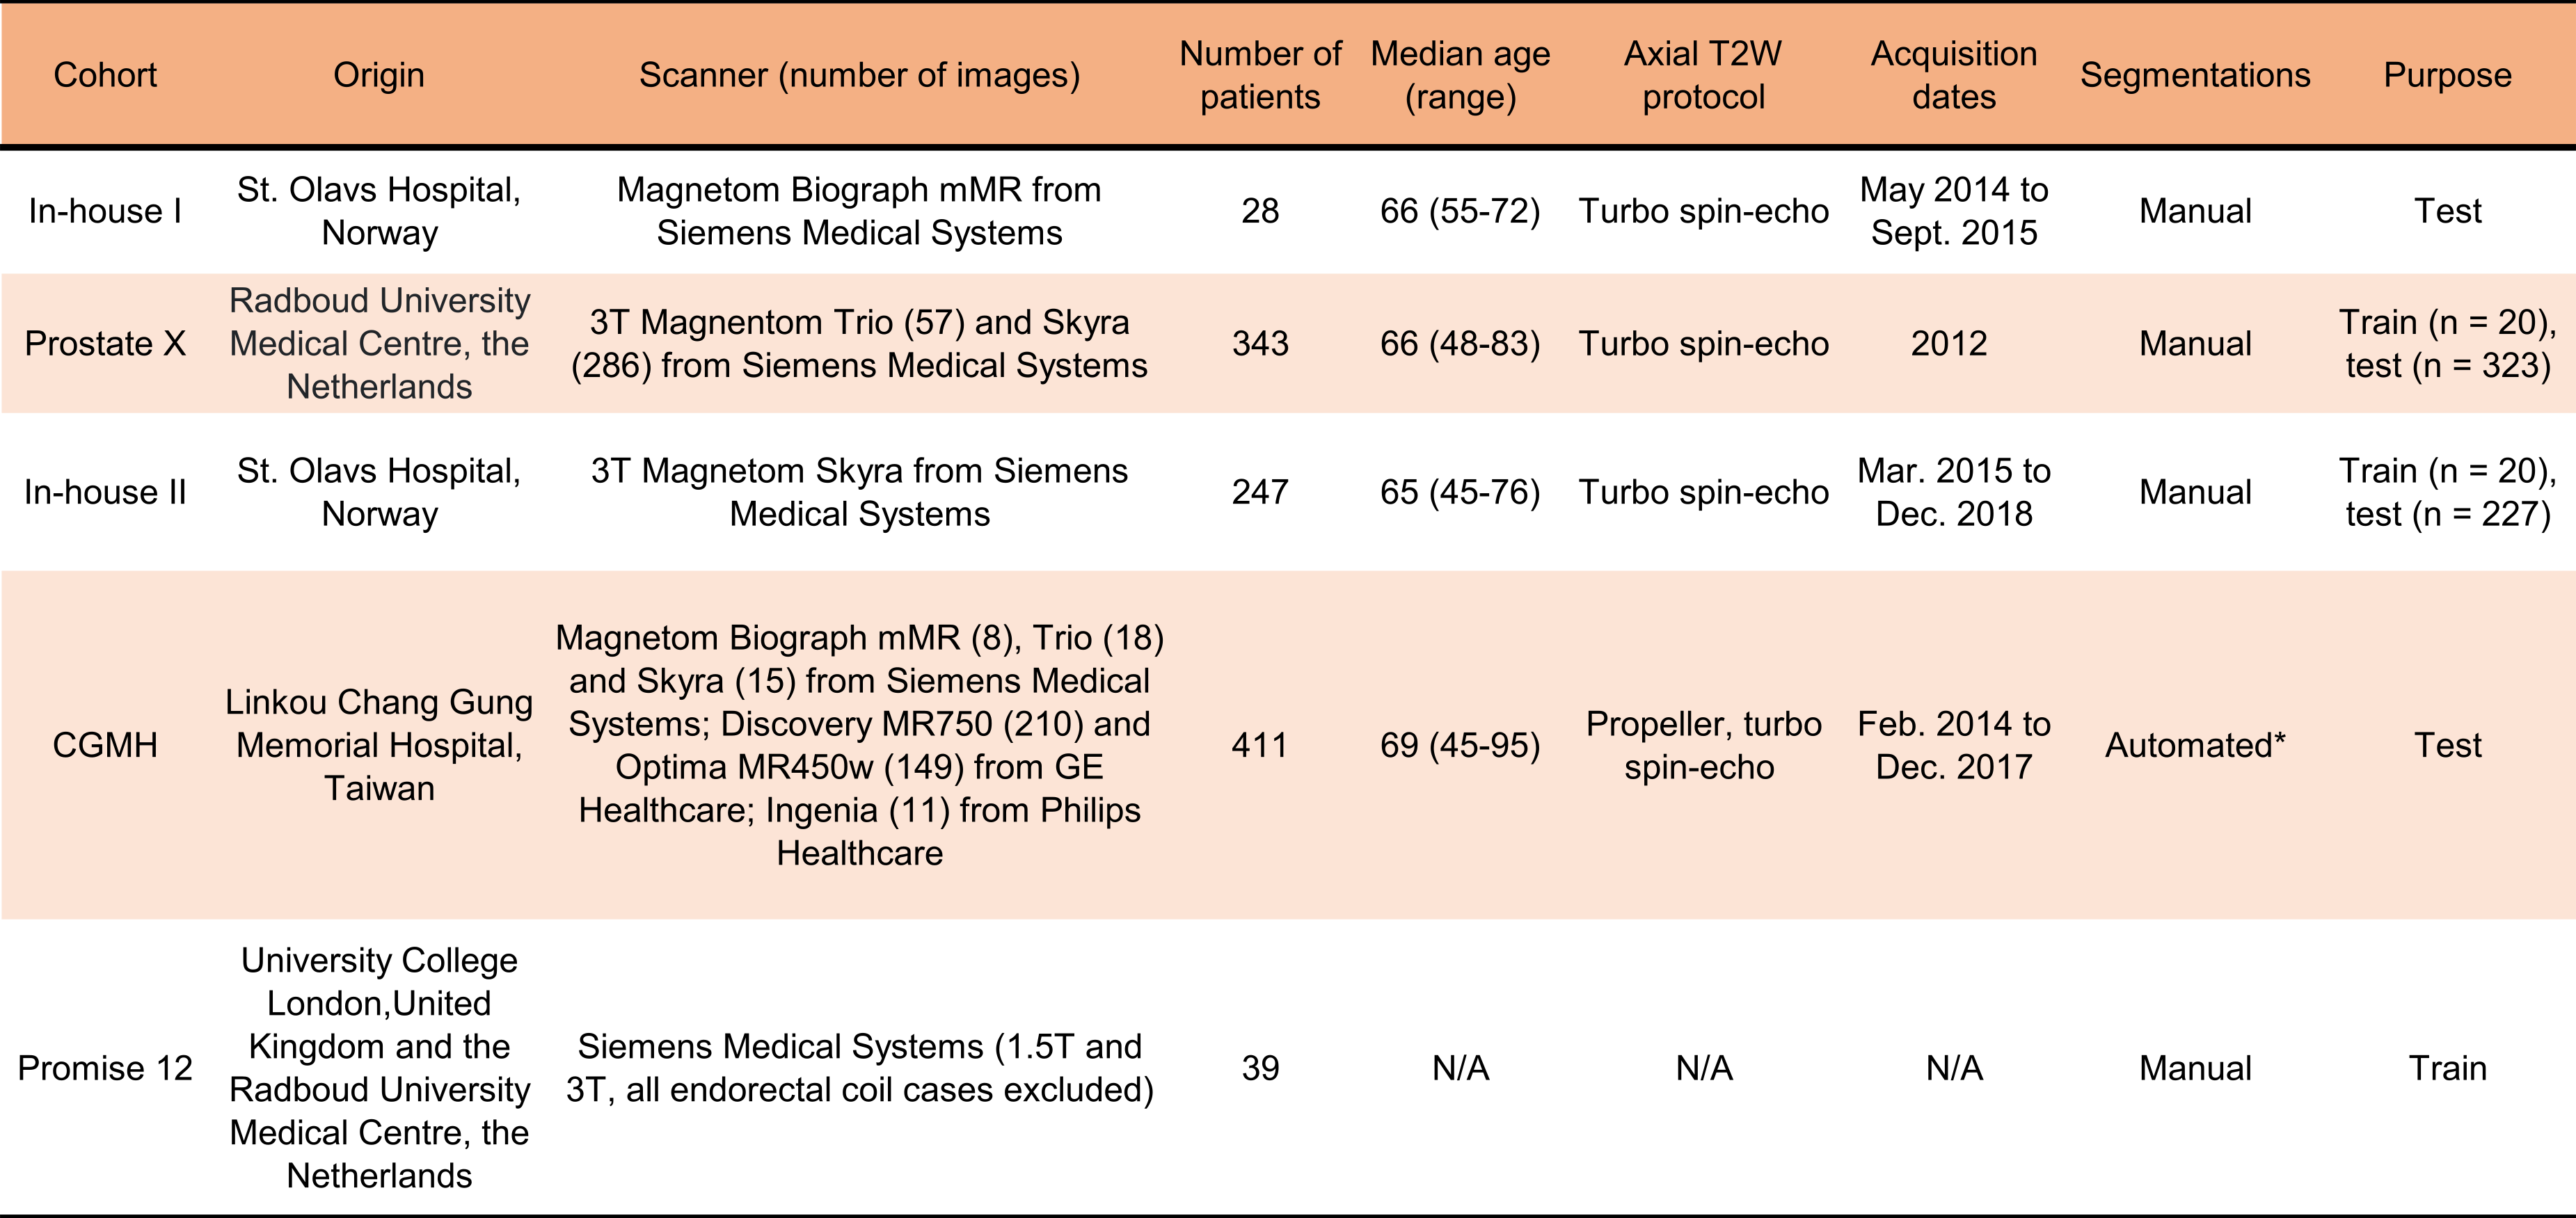
In Autoref, aggregate channel features object detectors (acfObjectDetector, Matlab R2019b) are trained to detect reference regions of interest (ROI), which are further processed by extracting the largest connected regions in these areas. By mapping the 90th percentile of the higher intensity ROI and 10th percentile of the lower intensity ROI to their corresponding tissue T2 values, the entire 3D T2W image is linearly scaled – creating a pseudo-T2 map.4 In this work, the object detectors were trained on manually placed rectangles around reference ROIs on a dataset consisting of 79 axial T2W MRI cases. Details on the dataset used for training is found in Table 1. For normalization, muscle was always used as the low intensity ROI, but the high intensity ROI varied between fat, femoral head and pelvic bone (ischial tuberosity). T2 relaxation times in the ROIs were measured in eight healthy volunteers (median age 28.5, range 26 to 65 years) using a multi-echo spin echo (MESE) imaging sequence on a Magnetom Skyra 3 T MRI system (Siemens, Erlangen, Germany) at St. Olavs University Hospital, Norway.Autoref was independently tested on a dataset consisting of 989 axial T2W from four cohorts, described in Table 1, providing variations in MRI scanner manufacturers, field strengths and acquisition protocols.
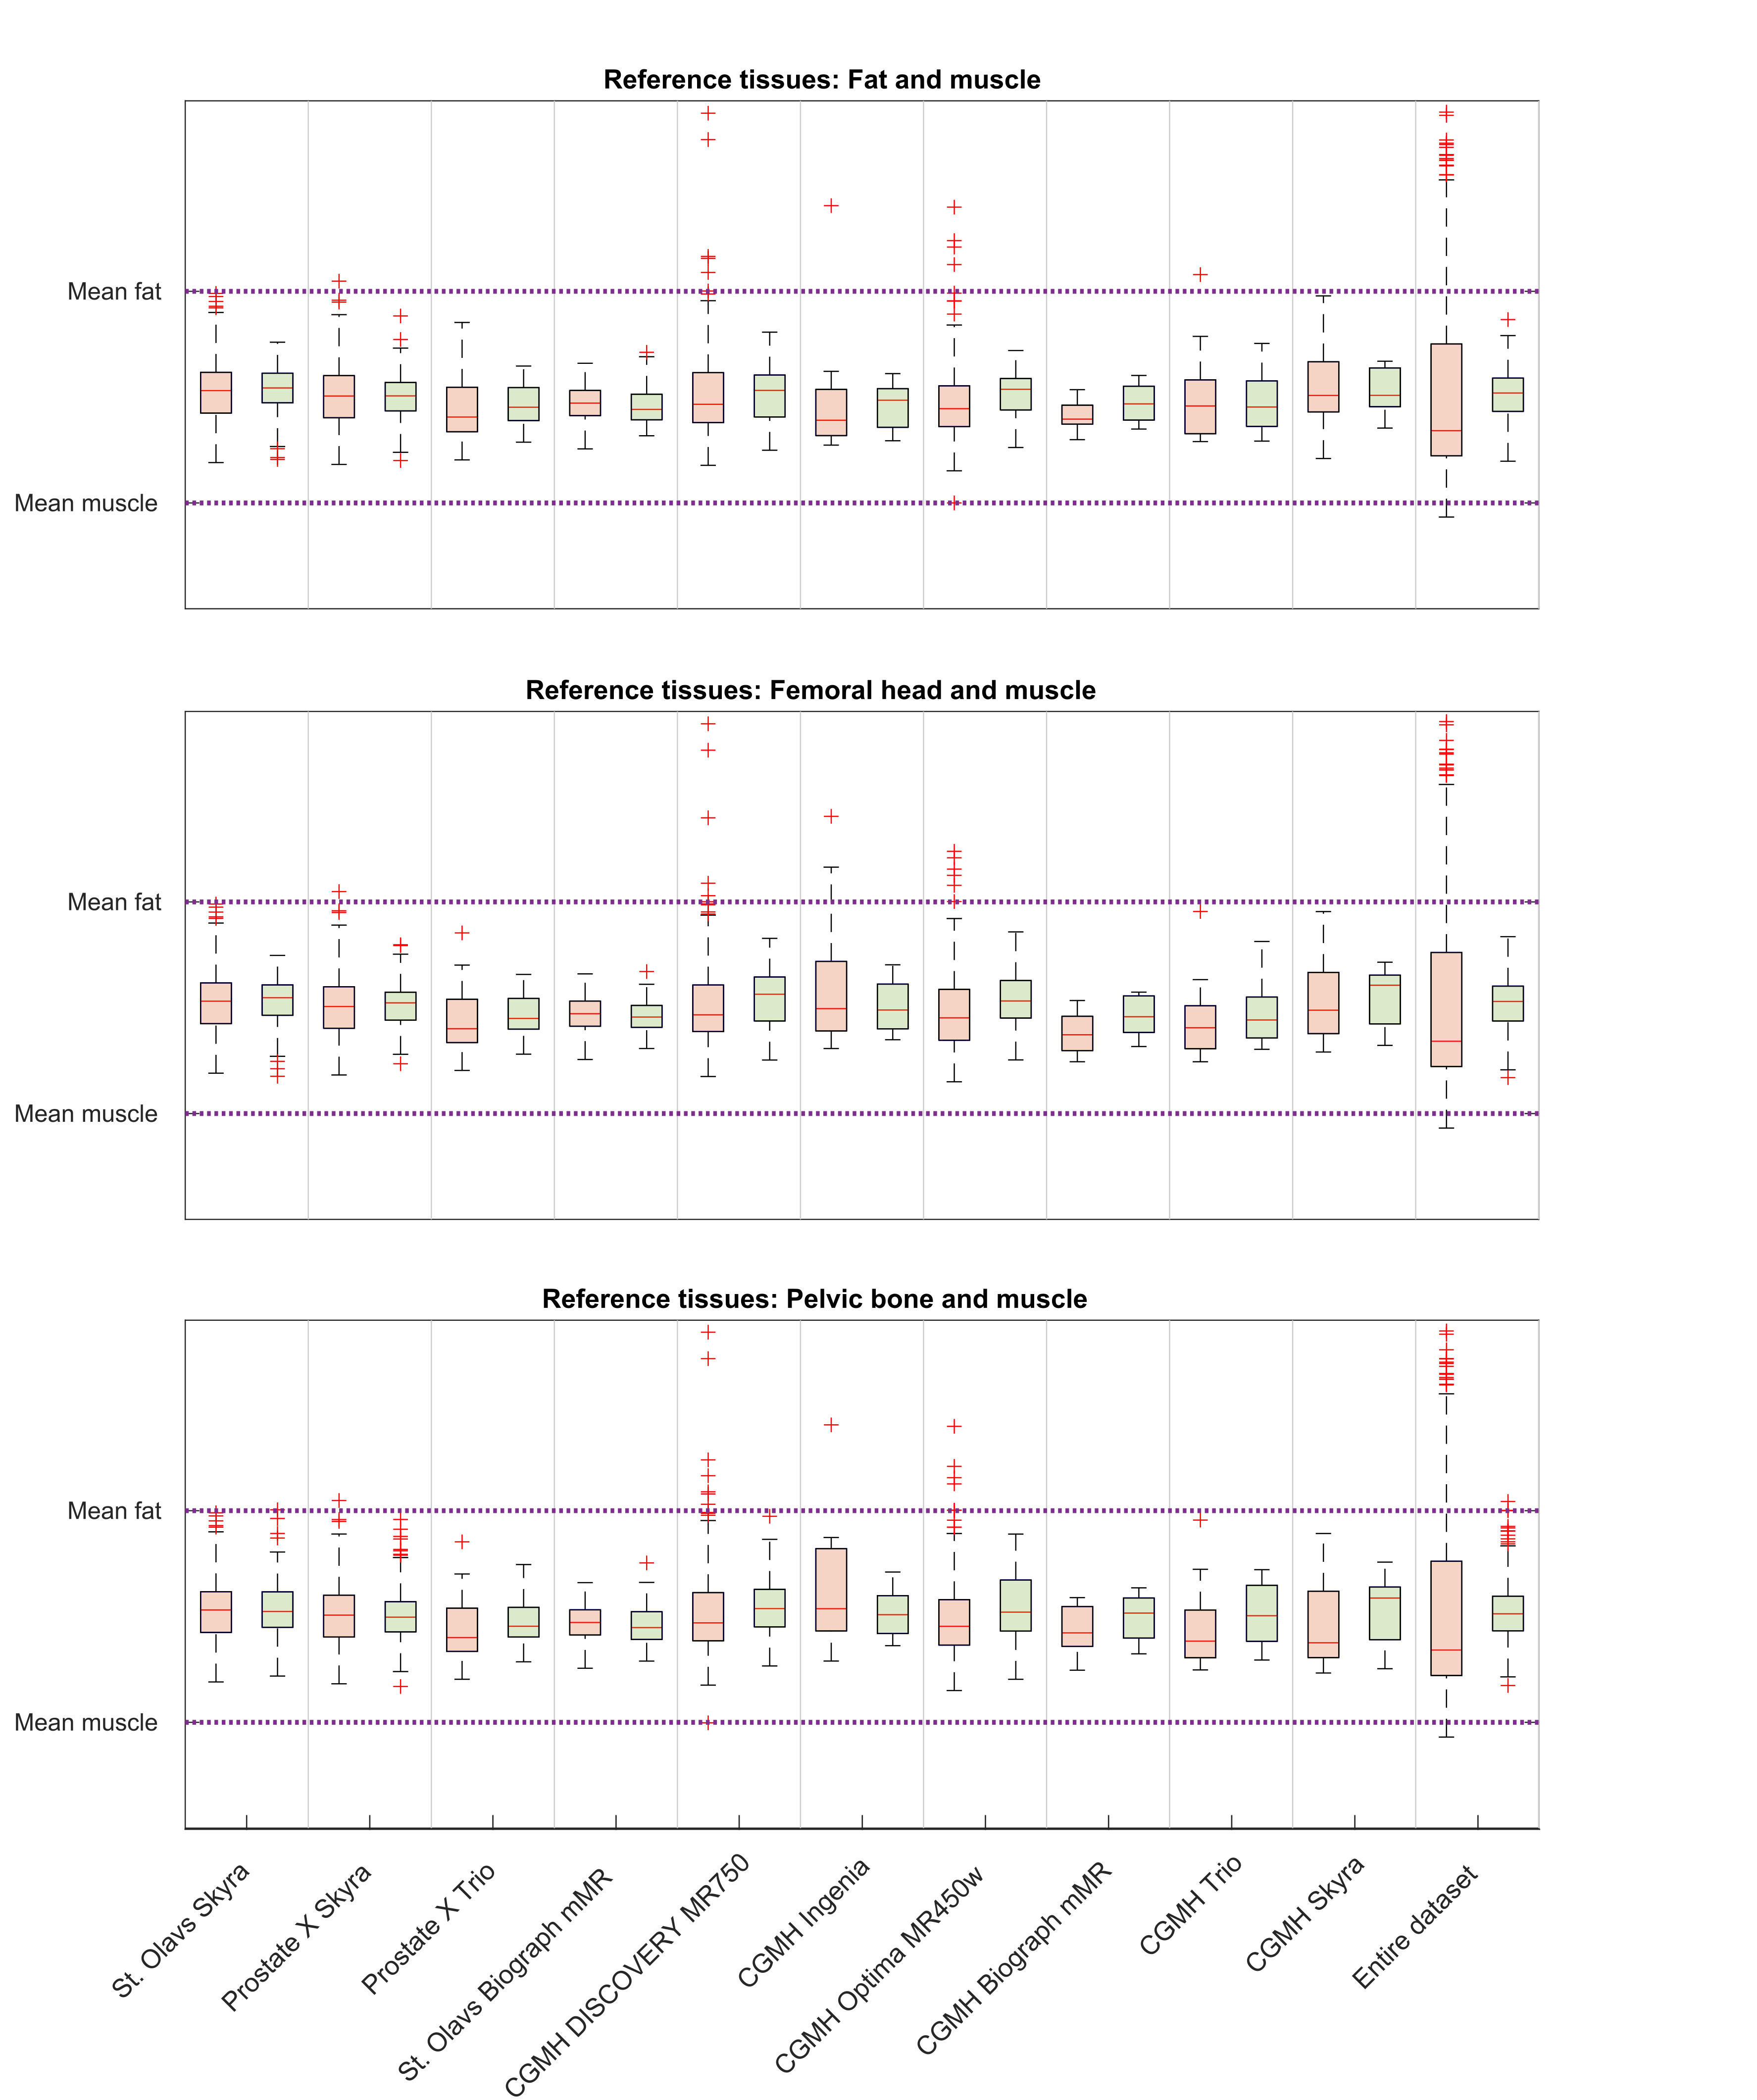
The spread in mean prostate intensities before and after Autoref normalization was calculated for every scanner and for the dataset as a whole. To enable comparison of the inter-quartile range (IQR) and range before and after normalization on the same scale, the prostate intensities were scaled. The prostate intensity in each patient was scaled to the scanner mean intensities in the higher and lower intensity ROIs before and after normalization. When scaling the entire dataset, the prostate intensity was scaled to the global mean of high and low ROIs. A paired t-test between the ranges and IQRs before and after normalization over all scanners, for the three combinations of ROIs, was applied.
Results
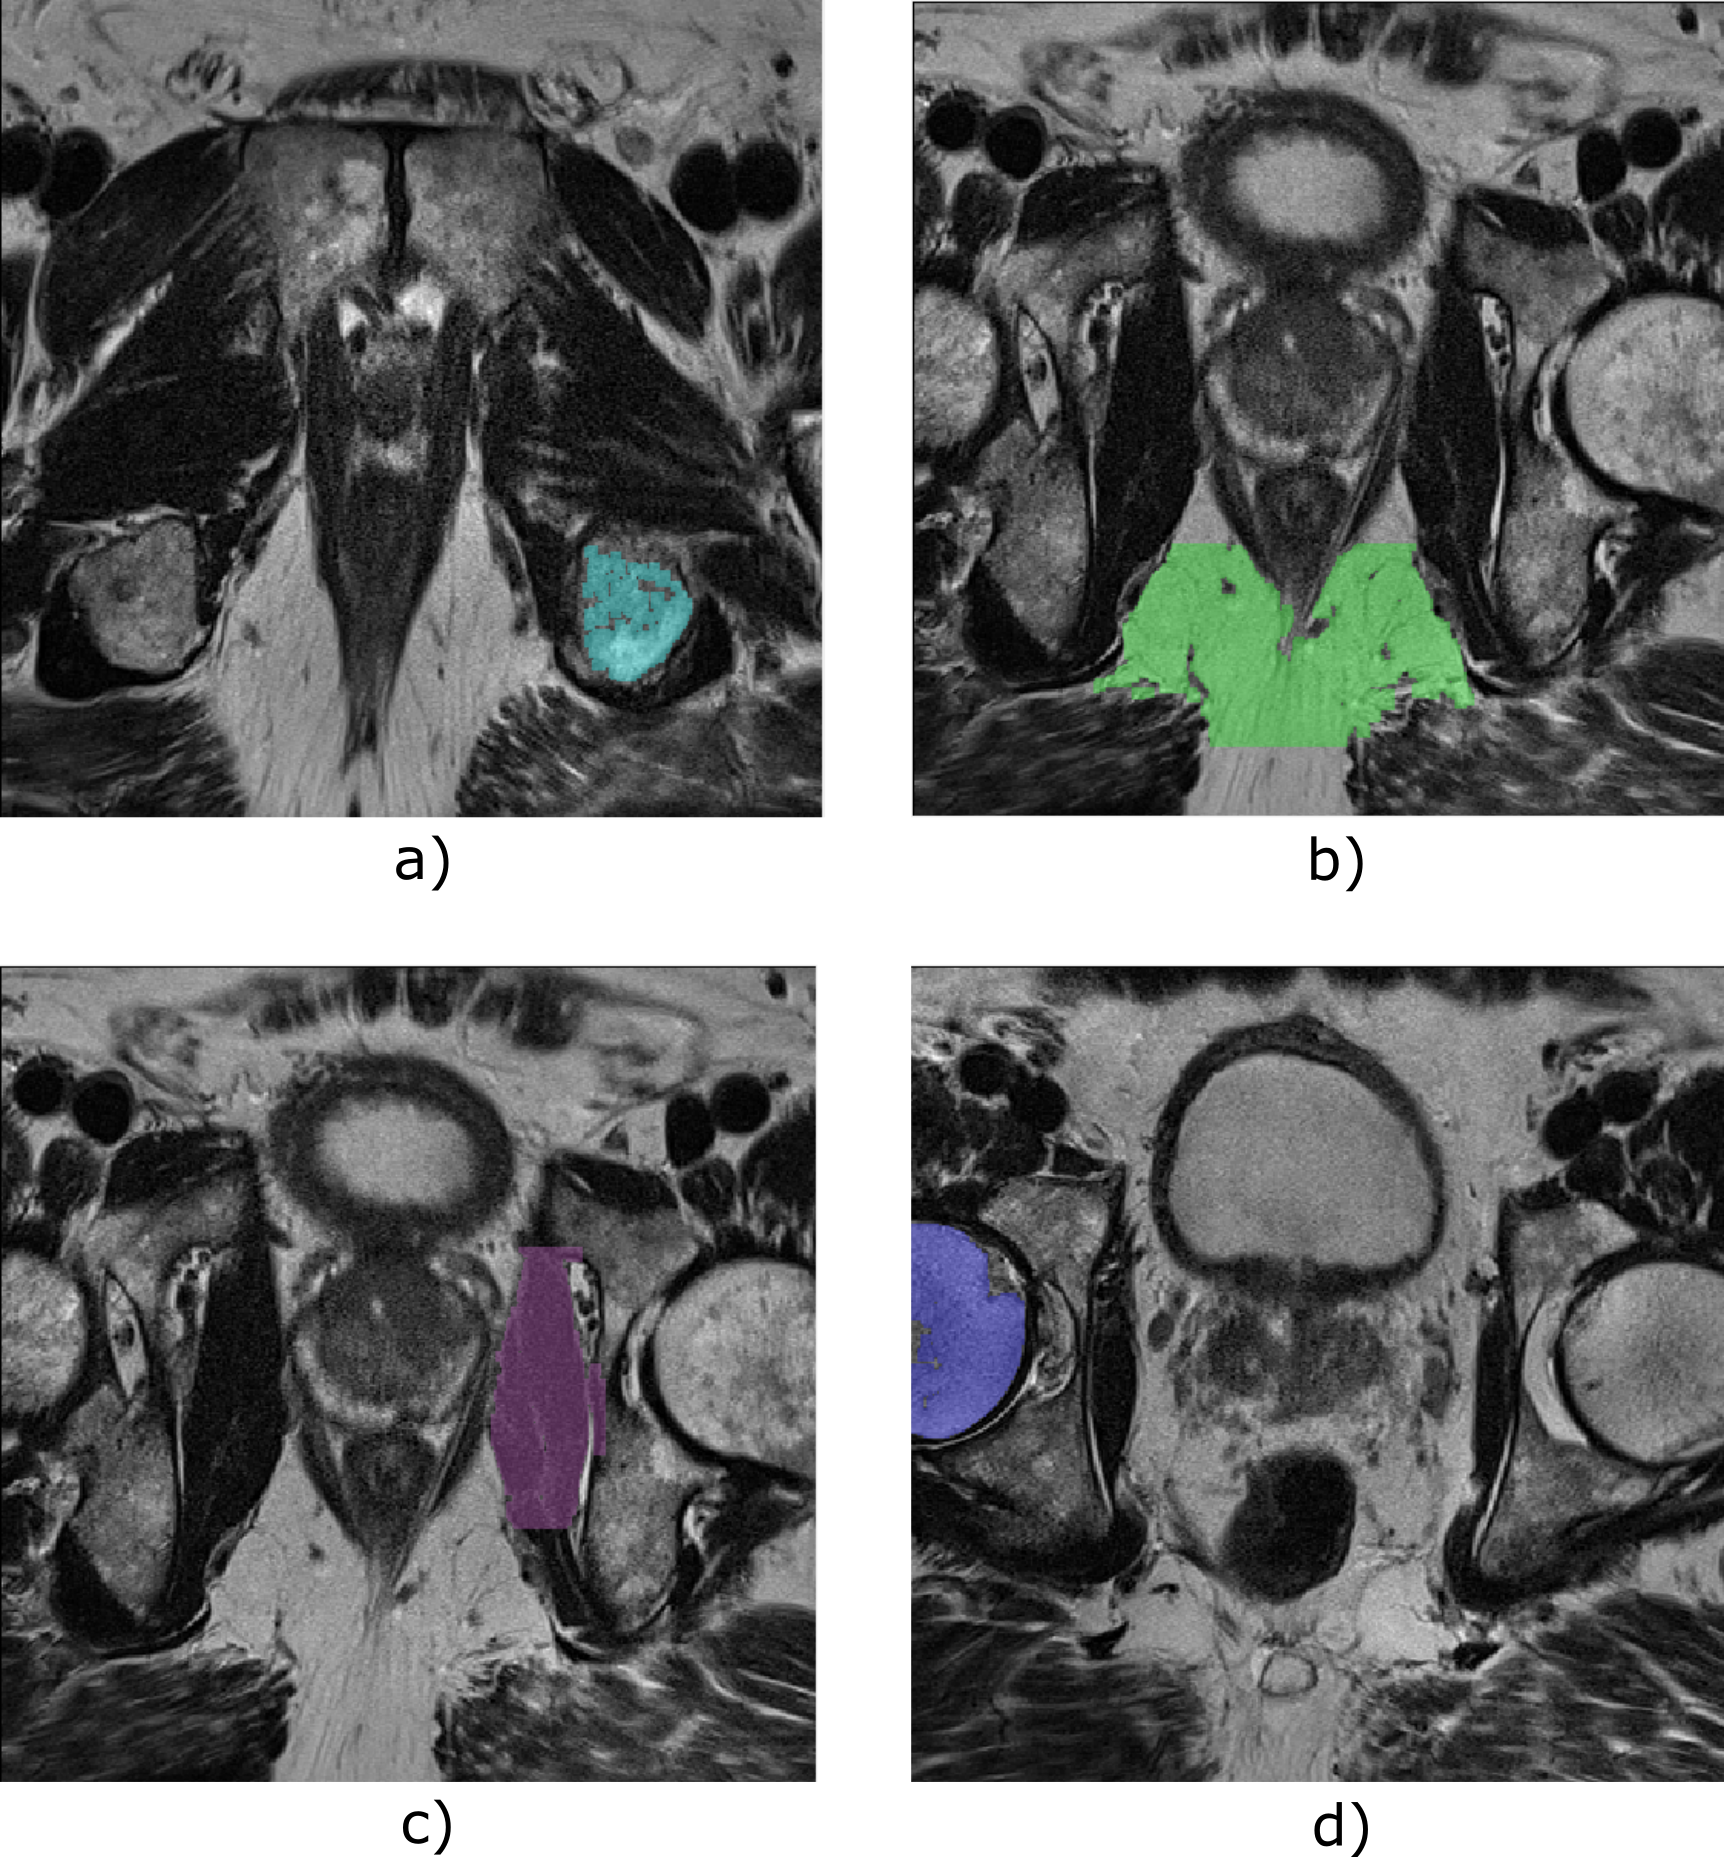
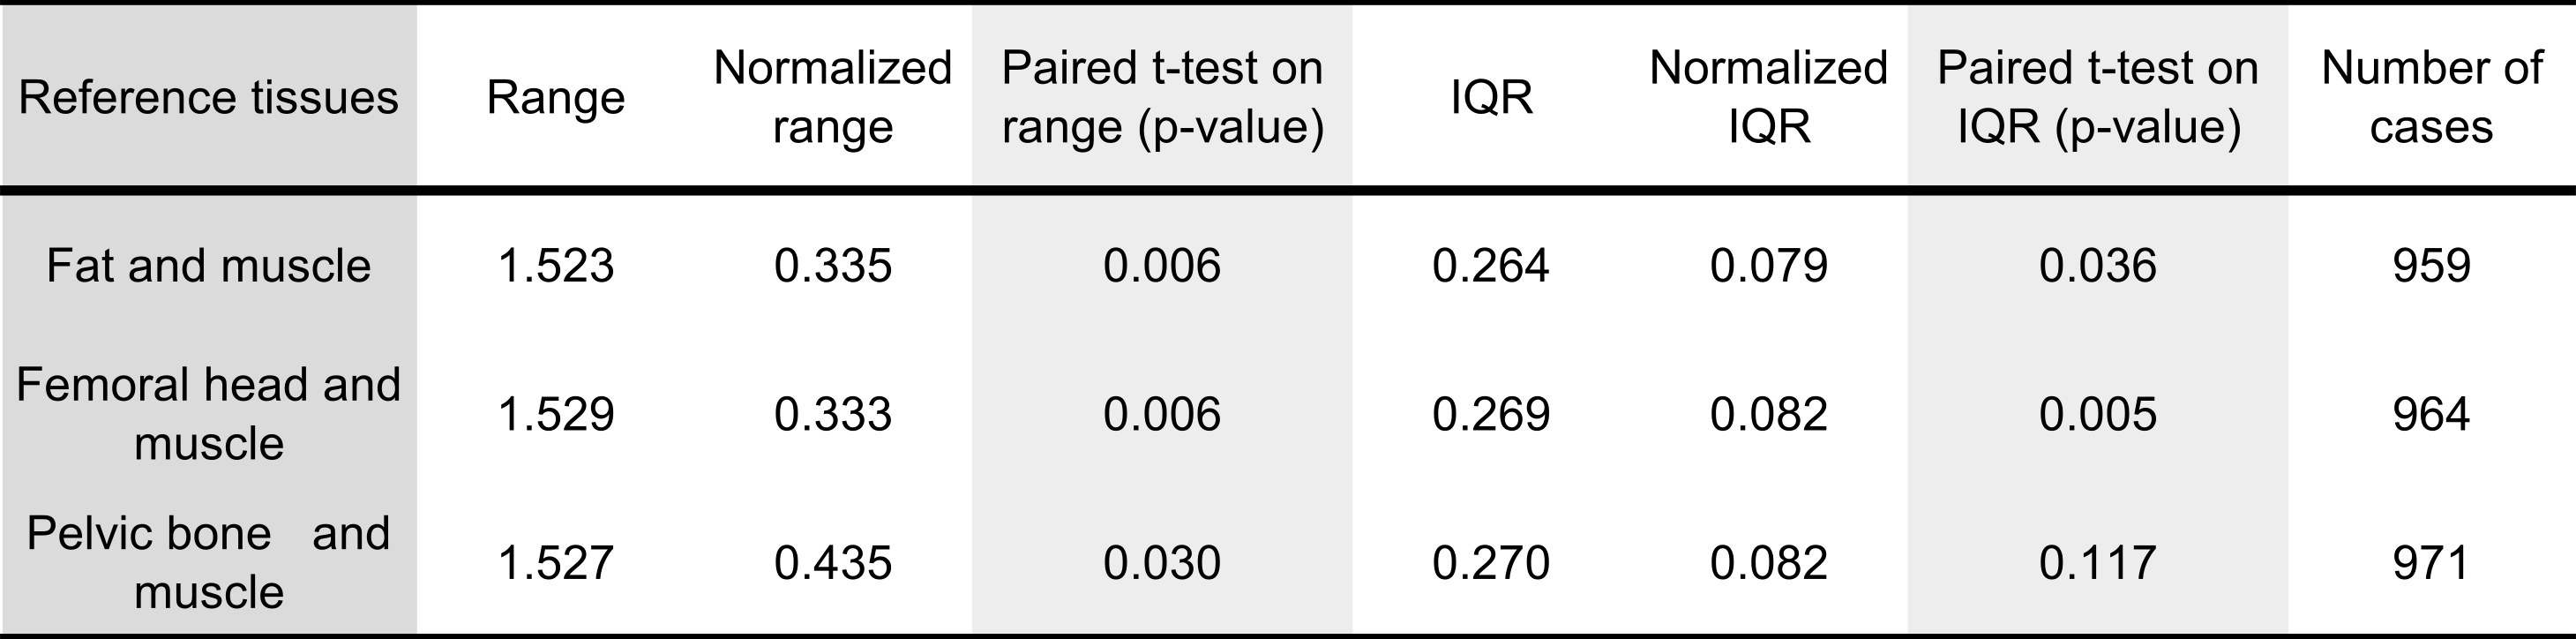
Reference tissue T2 values obtained from MESE, averaged over eight volunteers, were: 137.0 ± 2.7 ms for femoral head, 37.4 ± 0.9 ms for muscle, 98.7 ± 7.6 ms for pelvic bone and 129.7 ± 1.9 ms for fat. The reference ROIs detected by the object detectors are shown for one case in Figure 1. The MESE T2 value of the prostate, averaged over seven volunteers, was 77.0 ± 4.7 ms. The remaining volunteer lacked a T2W image and corresponding prostate segmentation. Mean pseudo-T2 values from all cohorts can be found in Table 2. Figure 2 shows the spread in mean prostate intensity before and after Autoref normalization with various ROIs. Table 3 depicts the range and inter-quartile range (IQR) in the scaled mean prostate intensities before and after normalization, for all the three combinations of ROIs. Table 3 also shows paired t-tests between the IQR and range before and after normalization for each scanner.Discussion
Autoref reduced the range in mean prostate intensities for all the three ROI pairs. The performance of femoral head and fat as high intensity ROI was comparable, both showing a statistically significant reduction in range and IQR for the mean prostate intensities over all scanners. The prostate pseudo-T2 values after normalization with femoral head as ROI and fat as ROI were close, but slightly higher for the femoral head. The real prostate T2 value in this cohort is not known, and it therefore cannot be concluded which of these methods provides results closest to the ground truth. These results, however, indicate that if the object detector fails to detect fat, the femoral head can be used as ROI instead - and vice versa.Pelvic bone was the high intensity ROI most stably detected, but provided a statistically insignificant reduction in IQR. The prostate pseudo-T2 was overall lower with the pelvic bone as ROI, indicating that the choice of ROI affects the pseudo-T2. This difference could be adjusted for by adding a constant term to the pseudo-T2.
Conclusion
Femoral head and fat are stable reference tissues that result in similar pseudo-T2 values across data from different scanners and institutions. Normalization using these tissues significantly reduced the inter-scan variation, which may be important for quantitative analysis of prostate cancer of T2W images.Acknowledgements
No acknowledgement found.References
[1] Simmons A, Tofts PS, Barker GJ, Arridge SR. Sources of intensity nonuniformity in spin echo images at 1.5 T. Magnetic resonance in medicine. 1994 Jul;32(1):121-8.
[2] Nyúl LG, Udupa JK, Zhang X. New variants of a method of MRI scale standardization. IEEE transactions on medical imaging. 2000 Feb;19(2):143-50.
[3] Lemaître G, Rastgoo M, Massich J, Vilanova JC, Walker PM, Freixenet J, Meyer-Baese A, Mériaudeau F, Martí R. Normalization of t2w-mri prostate images using rician a priori. InMedical Imaging 2016: Computer-Aided Diagnosis 2016 Mar 24 (Vol. 9785, p. 978529). International Society for Optics and Photonics.
[4] Sunoqrot MR, Nketiah GA, Selnæs KM, Bathen TF, Elschot M. Automated reference tissue normalization of T2-weighted MR images of the prostate using object recognition. Magnetic Resonance Materials in Physics, Biology and Medicine. 2020 Jul 31:1-3.
[5] Selnæs KM, Krüger-Stokke B, Elschot M, Willoch F, Størkersen Ø, Sandsmark E, Moestue SA, Tessem MB, Halvorsen D, Kjøbli E, Angelsen A. 18 F-Fluciclovine PET/MRI for preoperative lymph node staging in high-risk prostate cancer patients. European radiology. 2018 Aug 1;28(8):3151-9.
[6] Sunoqrot MR, Selnæs KM, Sandsmark E, Nketiah GA, Zavala-Romero O, Stoyanova R, Bathen TF, Elschot M. A Quality Control System for Automated Prostate Segmentation on T2-Weighted MRI. Diagnostics. 2020 Sep;10(9):714.
Figures