3732
Non-Invasive Brain Metabolic and Cytometric Imaging: Insights from Activity MRI [aMRI]1Advanced Imaging Research Center, Oregon Health & Science University, Portland, OR, United States
Synopsis
The first aMRI [activity MRI] maps of the awake, heathy human brain are
presented. They show differences in cell
density [ρ (cells/μL)], average cell volume [V (pL)], and on-going
metabolic activity among different brain tissues. Metabolic activity is represented by the mean
steady-state cellular water efflux rate constant [kio], which
reflects homeostatic cytolemmal Na+,K+-ATPase
[NKA] enzymatic turnover. Cortical gray
matter [GM] ρ is
less than white matter [WM] ρ,
while VGM > VWM.
Most interesting is the quite large WM kio, 30 s-1. WM NKA activity per cell is considerably larger than in cortical GM.
Introduction
Considerable evidence has accumulated that cell membrane water permeability, expressed as the steady‑state cellular efflux rate constant [kio], has a significant contribution from cytolemmal Sodium Pump enzymatic turnover.1 The strongest evidence comes from in vitro and ex vivo model studies that employ extracellular paramagnetic contrast agents, CAo’s. In the brain, intravascular plasma CAp’s can be used to map kpo, the steady-state capillary water molecule efflux rate constant.2 Trans-capillary wall water exchange kinetics [kpo] appear to reflect cellular [kio] Na+,K+‑ATPase [NKA] activity coupling within the neurogliovascular unit [NGVU].2 Significantly, kpo shows systemic decreases in multiple sclerosis2 and ageing,3 as well as in brain tumors.2,4 However, since CA’s do not extravasate, the kio biomarker cannot be accessed this way in normal-appearing brain.A Monte Carlo random walk [RW] simulation of non-invasive, CA-free DWI data has been reported.5,6 It employs digital ensembles of randomly shaped/sized [“Voronoi”] cells characterized by realistic cell density [ρ] and average cell volume [V] values. The kio value is effectuated during the RW.5,6 Since kio reflects NKA enzyme activity [fmol(ATP)consumed/s/cell],1 this method is called activity MRI [aMRI]. An aMRI simulation matches experimental brain DWI data.6 Here, we report the first, preliminary human brain aMRI maps.
Methods
IRB-approved, signed informed consent was obtained from a volunteer. A Prisma 3T instrument [Siemens] using a single-shot 2D EPI SDE DWI sequence, and three sequential orthogonal bipolar [twice-refocused] PFGs yielded DT trace-averaged data. Siemens software numerically calculates b values for the constant diffusion time (36 ms). Sixteen evenly-spaced b values, 0 to 5000 s/(mm)2, were collected. The ~31,000 voxels had nominal dimensions [0.94 x 0.94x3 (mm)3; 2.7 μL] from a 192x256 (mm)2 FOV [TR/TE/9500(ms)/92(ms)].Results
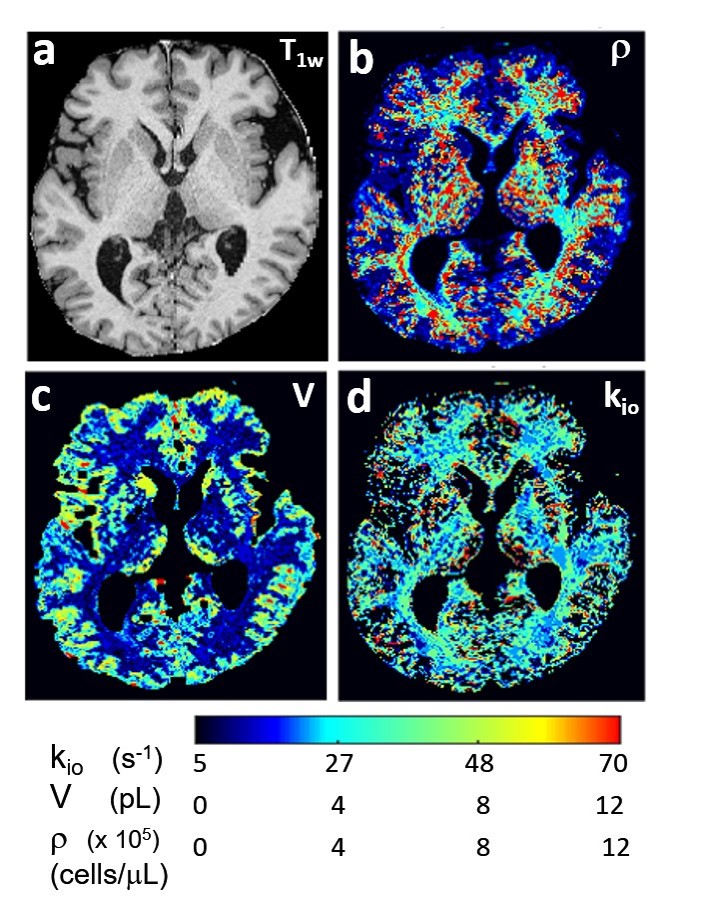
Figure 1 shows a T1-weighted axial image slice [inferior perspective] (a) of an awake, resting healthy human brain. The pixel intensities are proportional to intracellular macromolecular content.1 Matchings of the pixel DWI decays with simulated SDE decays from an aMRI library yield parametric maps. Panels (b-d) map ρ, V, and kio, respectively. It is encouraging that brain anatomy is reflected with very good conspicuity, particularly in the ρ and V maps. aMRI analyses do faithfully distinguish different tissues. We see: ρGM ≈ 200,000 and ρWM ≈ 400,000 cells/μL (b), VGM ≈ 4 and VWM ≈ 2 pL (c), and (kio)GM ≈ 8 and (kio)WM ≈ 30 s-1 (d). Thus, ρGM/ρWM ≈ 0.5, VGM/VWM ≈ 2, and (kio)GM/(kio)WM ≈ 0.3.Since the aMRI parameters are real quantities [with units], they have the possibility for independent absolute verification. Modern histopathological cell counting results7 can be used to estimate ρ and V values. Thus, we are gratified to estimate ρGM/ρWM = 0.7, and VGM/VWM = 1.6 for post-mortem human brains.8 Also, we find (kpo)GM/(kpo)WM = 0.9 for awake, resting healthy human brain.2 These are encouraging agreements. VGM > VWM is reasonable: the percentage of the larger neurons is 42% in GM and only 6% in WM.8
Absolute magnitudes we estimate from the cell counting literature differ somewhat. For human brain, we estimate ρGM ≈ 47,000 and ρWM ≈ 72,000 cells/μL, and VGM ≈ 17 and VWM ≈ 11 pL, from (8). An average cell density for chimpanzee cerebral neo-cortex,9 88,000 cells/μL, is closer to our ρGM near 200,000 [Fig. 1b]. Possible reasons for these differences are discussed below.
Discussion
Our brain kio values are the first obtained non-invasively. The 8 s-1 (GM) and 30 s-1 (WM) magnitudes are greater than those of kpo, 2.9 s-1 (GM) and 3.2 s-1 (WM).2 This is encouraging: kpo reflects kio values to the extent of metabolic coupling within the NGV unit. It may be sensible kio can be an order of magnitude greater than kpo. If so, it suggests the kpo pathological changes reported above could be more pronounced in kio maps. Most interesting is the large WM kio value, ~30 s-1. The kio/kpo ratio is much larger in WM than GM. In general, WM neuronal cells actively transmit signals between several different GM regions. Thus, it may be sensible the WM NKA activity per cell is greater than in GM. It may also be sensible NGVU metabolic coupling [kpo/kio] is smaller in WM than in GM. It will be interesting to see how kio maps respond to discrete neural stimuli. Also, kio maps could settle whether kpo drops in brain tumors because of decreased metabolic activity or because of angiogenic NGVU metabolic coupling disruption.Histopathological methods7-9 are optimized for cell counting. Using them to estimate ρ and V relies on the volume-conserving precautions pathologists took for the excision and fixing steps. These can change tissue volumes.10 It is also possible that, for cells with such highly articulated structures, aMRI over-counts ρ and underestimates V. It may treat the large cell body [soma] and small processes [neuropil] of the same neuronal cell as different cells. This was suggested in (11) and evidence compiled in (12). Nonetheless, the in vivo ρ and V maps should be sensitive to the same pathologies, pharmaceutical responses, and genetic alterations as cell counts.7
Acknowledgements
We thank the Brenden-Colson Center for Pancreatic Care for support. We thank Profs. Christopher Kroenke and William Rooney for stimulating discussions, and Dr. Thorsten Feiweier [Siemens] for the DWI acquisition pulse sequence.References
Li X, Mangia S, Lee J-H, Bai R, Springer CS, “NMR Shutter-Speed Elucidates Apparent Population Inversion of 1H2O Signals Due to Active Transmembrane Water Cycling,” Magn. Reson. Med. 2019; 82: 411-424. [DOI: 10.1002/mrm.27725]
Rooney WD, Li X, Sammi MK, Bourdette DN, Neuwelt EA, Springer CS. “Mapping Human Brain Capillary Water Lifetime: High-Resolution Metabolic Neuroimaging.” NMR Biomed. 2015; 28: 607-623. [DOI: 10.1002/nbm.3294]
Anderson VC, Tagge IJ, Li X, Quinn JF, Kaye JA, Bourdette DN, Spain RI, Riccelli LP, Sammi MK, Springer CS, Rooney WD. “Observation of Reduced Homeostatic Metabolic Activity and/or Coupling in White Matter Aging,” J. Neuroimag. 2020; 30: 658-665. [DOI: 10.1111/jon.12744]
R. Bai, B. Wang, Y. Jia, Z. Wang, C. S. Springer, Z. Li, C. Lan, Y. Zhang, P. Zhao, Y. Liu, “Shutter-Speed DCE-MRI Analyses of Human Glioblastoma Multiforme (GBM) Data,” J. Magn. Reson. Imag. 52,850-863 (2020). [DOI: 10.1002/jmri.27118]
Baker, EM, Moloney B, Li X, Gilbert EW, Springer CS. “Random Walks in Stochastic Geometries.” Proc. Int. Soc. Magn. Reson. Med. 2019; 27: 3612.
Moloney B, Baker EM, Li X, Gilbert EW, Springer CS. “Fundamental cell biology properties underlying in vivo DWI.” Proc. Int. Soc. Magn. Reson. Med. (2020) 28: 4506.
Attili SM, Silva MRM, Nguyen T-v, Ascoli GA. “Cell numbers, distribution, shape, and regional variation throughout the murine hippocampal formation from the adult brain Allen Reference Atlas.” Brain Struct. Funct. (2019) 224: 2883-2897.
Azevedo FAC, Carvalho LRB, Grinberg LT, Farfel JM, Feretti REL, Leite REP, Filho WJ, Lent R, Herculano‑Houzel S. “Equal numbers of neuronal and nonneruonal cells make the human brain an isometrically scaled-up primate brain.” J. Compar. Neurolog. (2009) 513: 532-541.
Collins CE, Turner EC, Sawyer EK, Reed JL, Young NA, Flaherty DK, Kaas JH. “Cortical cell and neuron density estimates in one chimpanzee hemisphere.” Proc. Nat. Acad. Sci. 2016; 113: 740-745.
Pallotto M, Watkins PV, Fubara B, Singer JH, Briggman KL. “Extracellular space preservation aids the connectomic analysis of neural circuits.” eLife (2015) 4: e08206. [DOI: 10.7554/eLife.08206]
Quirk, JD, Bretthorst GL, Duong TQ, Snyder AZ, Springer CS, Ackerman JJH, Neil JJ. “Equilibrium Water Exchange Between the Intra- and Extracellular Spaces of Mammalian Brain.” Magn. Reson. Med. 2003; 50: 493‑499.
Flint JJ, Menon K, Hansen B, Forder J, Blackband SJ. “Visualization of Live, Mammalian Neurons During Kainate-infusion Using Magnetic Resonance Microscopy.” Neuroimage 2020; 219: 116997.
Figures