3731
Quantitative measurement of changes in 23Na MRI following transcranial direct current stimulation (tDCS) of the motor cortex
Iris Asllani1,2, Francesco Di Lorenzo1, Balazs Orzsik1, Guillaume Madelin3, Neil Harrison4, and Mara Cercignani1
1University of Sussex, Brighton, United Kingdom, 2Rochester Institute of Technology, Rochester, NY, United States, 3New York University, New York, NY, United States, 4University of Cardiff, Cardiff, United Kingdom
1University of Sussex, Brighton, United Kingdom, 2Rochester Institute of Technology, Rochester, NY, United States, 3New York University, New York, NY, United States, 4University of Cardiff, Cardiff, United Kingdom
Synopsis
23Na MRI data were acquired on healthy volunteers ~15 mins after either anodal, cathodal, or sham application of tDCS in the motor cortex. Tissue specific [Na] concentration images were obtained using a partial volume correction algorithm previously developed for ASL MRI. There was an average 14% increase in gray matter sodium concentration, [Na]GM, across the group following the anodal tDCS; no significant change was observed for the sham application. Of note, all subjects exhibited a widespread pattern of increased [Na]GM similar to that reported in ASL MRI studies that have measured changes in CBF also following anodal tDCS of M1.
Introduction: Studies on both animals and humans indicate that changes in brain function induced with tDCS are likely mediated via changes in membrane permeability1. The mechanisms underlying these processes, however, are not well understood. The goal of this study was to investigate changes in sodium concentration, [Na], measured with 23Na MRI, following tDCS of the motor cortex in healthy volunteers. The motivation stemmed from the pivotal role Na plays in neuronal membrane permeability and brain activation2,3. Using a spatial linear regression (SLR) partial volume correction (PVEc) algorithm, originally developed for ASL MRI4, we investigated tissue-specific changes in sodium concentration [Na] in the motor area before after a 20-min application of tDCS. While there's been a surge recently in studies acquiring fMRI and ASL MRI data during and tDCS application5,6, this is the first study to look into the dynamics of sodium concentration, which may provide new insights into the processes by which tDCS affects the brain.
Methods: Data acquisition: Each subject (n = 7, age = 33 ± 8 years, 3 male) participated in 3 separate sessions (3-5 days apart). Each session comprised a randomized sham, anodal, or cathodal tDCS application followed by the MRI acquisition. For tDCS, a direct current of 2 mA (0.057 mA/cm2) was delivered for 20 minutes via two surface electrodes (5 x 5 cm2) positioned over the left M1 area and the contralateral orbito-frontal cortex. The anatomical landmarks were identified through the 10-20 system. The 23Na MRI images were acquired ~ 15 min after the tDCS delivery using FLORET7 with: TE = 0.2ms, TR = 100ms, voxel size = 4 mm3. A vitamin E capsule was position next to the stimulating electrode as a co-localization marker and four agar phantoms, 30, 50, 75, and 120mM NaCl, were attached to the head inside the coil for calibration purposes. A low-res 1H T1w image matching the resolution of the 23Na image and an MPRAGE with 1mm isotropic resolution were acquired for co-registration and segmentation purposes.
Image Processing: The SLR PVEc algorithm was applied to the [Na] image using PV maps obtained from segmentation of the MPRAGE using SPM128. For each subject and tissue, percent change maps, Δ%[Na] were computed using the [Na] images acquired before and after tDCS. A MatLab script was written to identify interconnected voxels, "clusters", with GM Δ%[Na] change > 10% (Fig.1). The cluster directly under the stimulated area (identified from the vitamin E capsule signal on the MPRAGE) was used for subsequent ROI analysis (Fig.1). As an exploratory aim, the Δ%[Na] images for WM and CSF were also obtained. Here, we present results from anodal and sham tDCS sessions.
Image Processing: The SLR PVEc algorithm was applied to the [Na] image using PV maps obtained from segmentation of the MPRAGE using SPM128. For each subject and tissue, percent change maps, Δ%[Na] were computed using the [Na] images acquired before and after tDCS. A MatLab script was written to identify interconnected voxels, "clusters", with GM Δ%[Na] change > 10% (Fig.1). The cluster directly under the stimulated area (identified from the vitamin E capsule signal on the MPRAGE) was used for subsequent ROI analysis (Fig.1). As an exploratory aim, the Δ%[Na] images for WM and CSF were also obtained. Here, we present results from anodal and sham tDCS sessions.
Results: Fig.2 provides an example of the tissue-specific [Na] images obtained from the PVEc algorithm at the single-subject level. Baseline group-wise average [NA]GM, [NA]WM, and ventricular [NA]CSF was 47 ± 4.6 mM, 39 ± 3.8 mM, and 118 ± 11 mM. There was no effect of tDCS on global tissue [NA] (p < 0.005, for all three tissues). Fig.3 shows areas where GM Δ%[NA] > 10% from 2 randomly selected subjects. All subjects showed similar patterns. Only [Na]GM values for the motor area under the electrode are reported here (Fig.4).
Discussion: Using an "offline" experimental design (i.e., MRI scanning was preceded by tDCS stimulation), we measured changes in [NA] in the motor area under anodal and sham conditions. The [Na] images were corrected for PVE using an algorithm previously applied in ASL MRI4. The algorithm extracts tissue-specific signal in each voxel by assuming tissue-signal homogeneity within a kernel surrounding the voxel. As such, the PVE algorithm yields tissue-specific [Na] images that, at each voxel, reflect the [Na] the voxel would have if it were comprised entirely of that tissue. The values obtained here for [NA]GM, [NA]WM,and [Na]CSF are similar to those obtained from 7T 23Na MRI9. In addition to changes in the area under the electrode, we found widespread changes in [Na]GM that followed a pattern similar across subjects. This is an interesting finding considering that similar patterns have been seen in CBF measured with ASL MRI using a similar experimental design10. More research is needed to build models that can explain these findings and that address current experimental challenges such as variability in electrode position, duration, and intensity of stimulation.
Acknowledgements
No acknowledgement found.References
1L J Bindman et al., J. Physiol. (1964); 2M A Nitsche et al., J Physiol. (2003); 3D Rotin et al., Requirement of the Na+/H+ Exchanger for Tumor Growth; 4I Asllani et al., MRM (2009); 5Y H Kwon & M H Ko, Neurosci Lett., (2008); 6X Zheng et al., NeuroImaging, (2011); 7G Madelin et al. JMRI (2013); 8J Ashburner, NeuroImage (1999); 9M Petracca et al., BRAIN (2016); 10C J Stagg, J Neurosci (2013)Figures
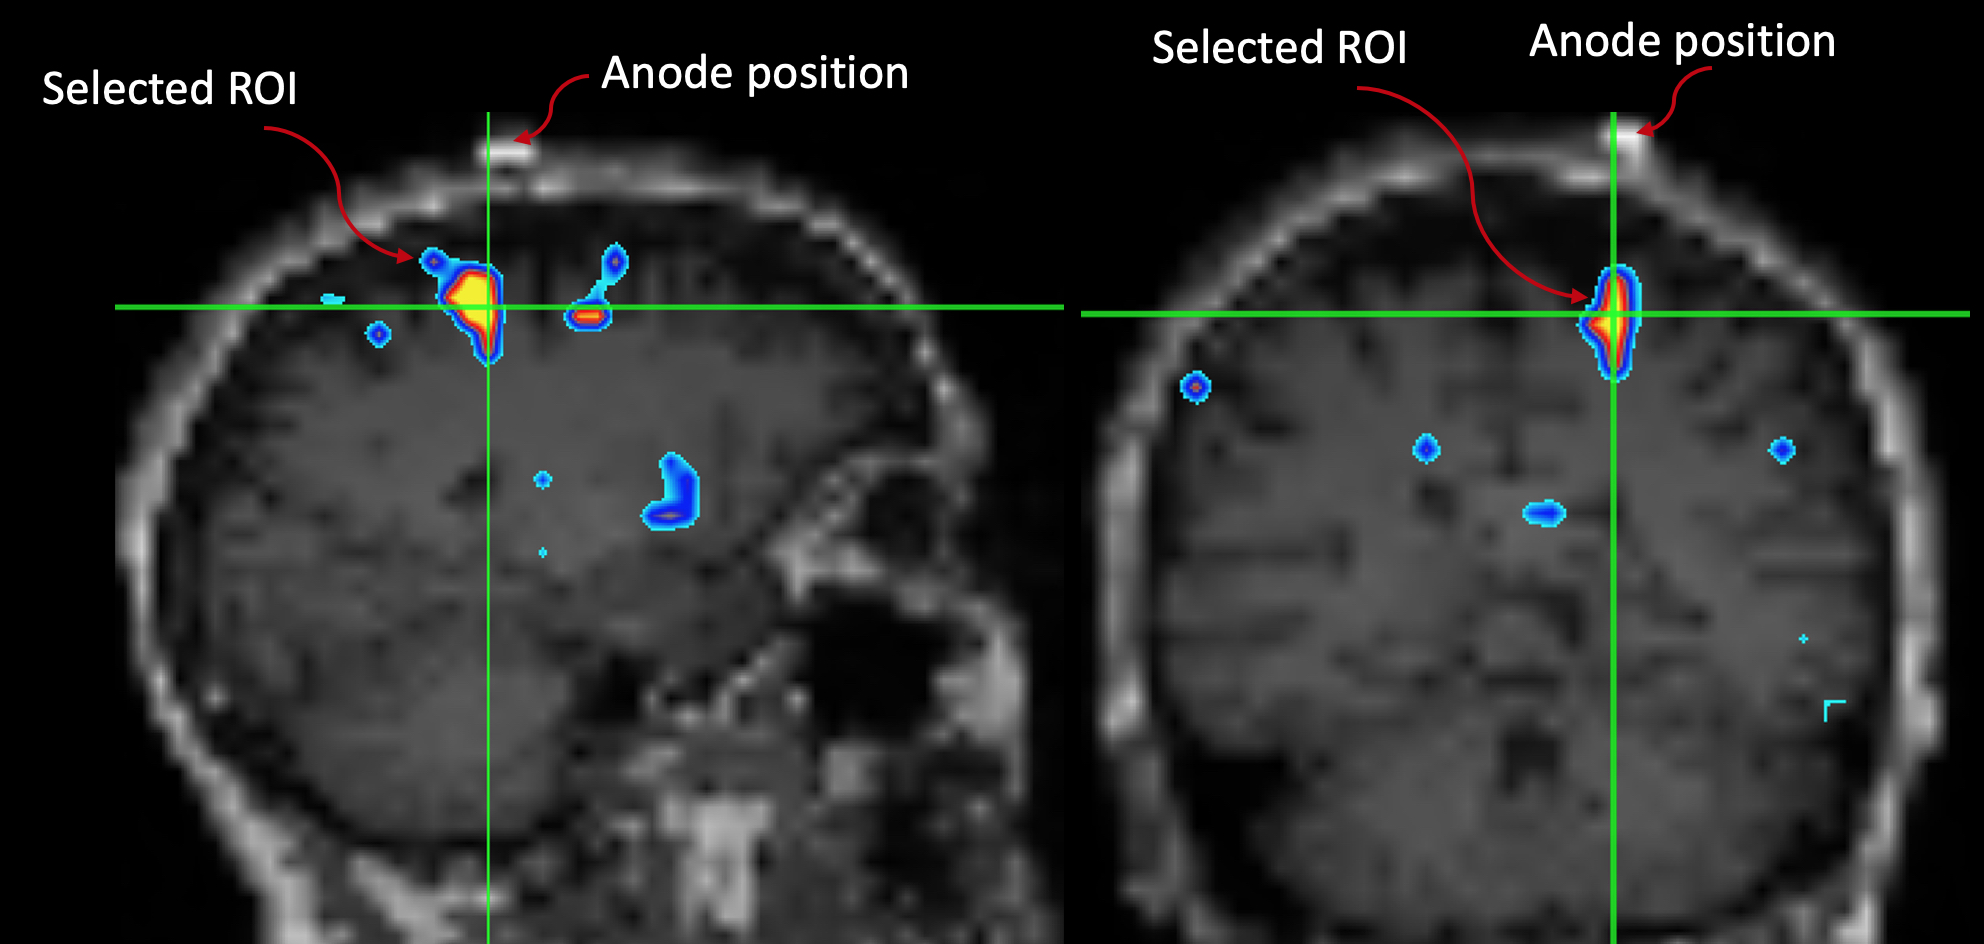
Fig.1: The motor ROI was selected by overlapping the GM Δ%[NA] image onto the subject's down-sampled MPRAGE. A MatLab script was written to identify "blobs" where Δ%[NA] > 10%. The script yields a blob ID number which is then used to extract the motor ROI for further analyses. Note the spatial relationship between the marker and the ROI.
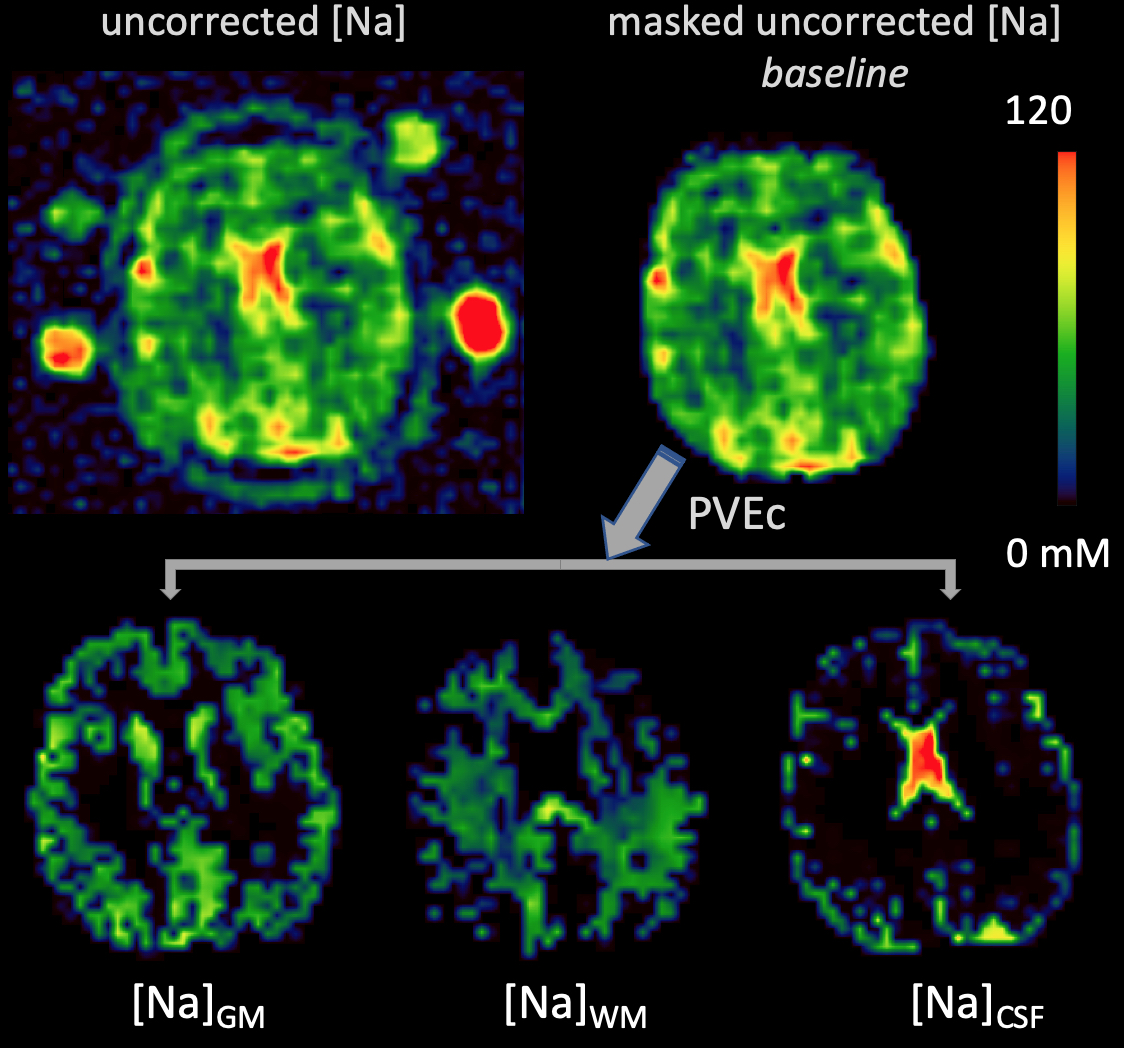
Fig.2: Prior to running the PVEc algorithm, the uncorrected [Na] images were masked by including only voxels for which the sum of PV for all tissues > 20%. The PVEc algorithm yields tissue-specific [Na] images (bottom row). These images can be thought as the sodium concentration a voxel would have if it were comprised solely of that given tissue.
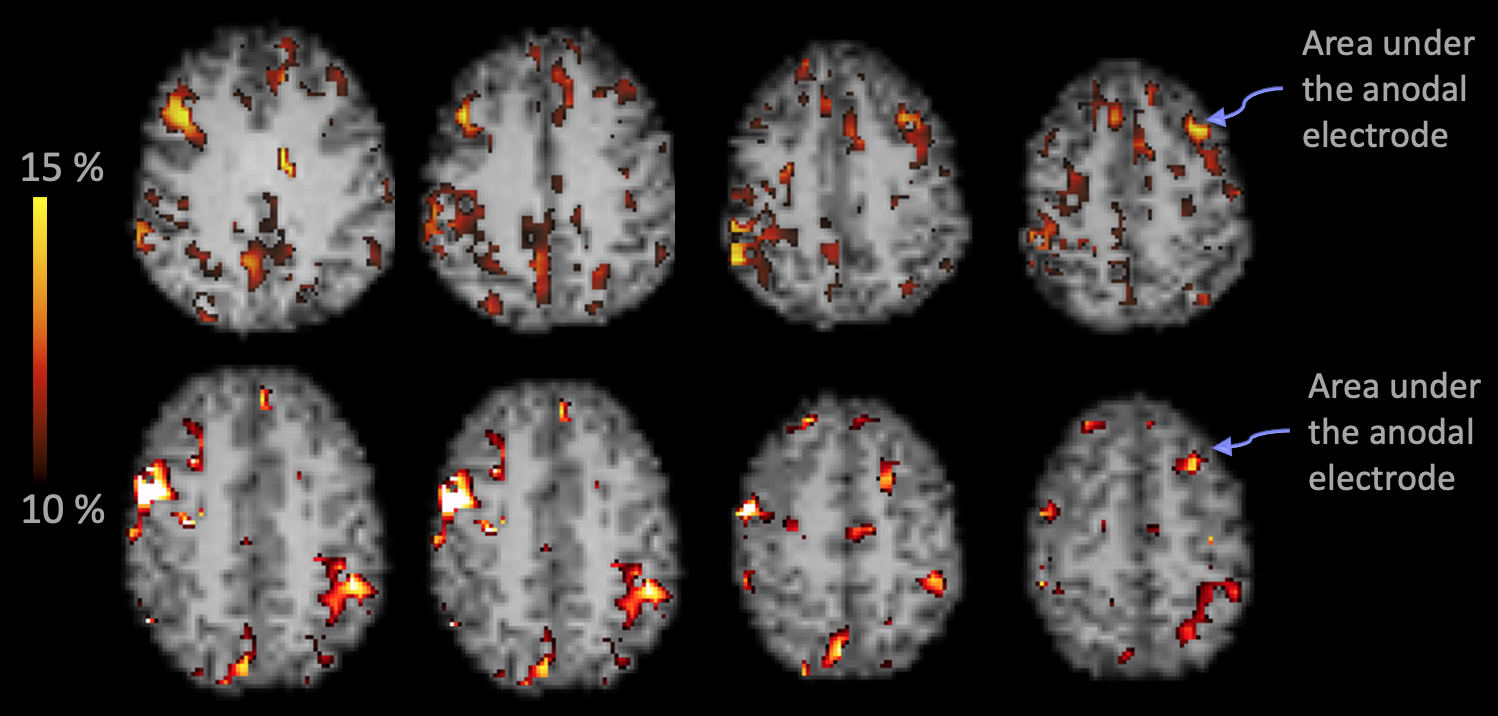
Fig.3: Areas in GM that survived the Δ%[NA] > 10% are shown for 2 randomly selected subjects. The arrows point to the "blob" that was identified under the marker on the MPRAGE (as demonstrated in Fig.1). The widespread pattern of Δ%[NA] was similar across the group.
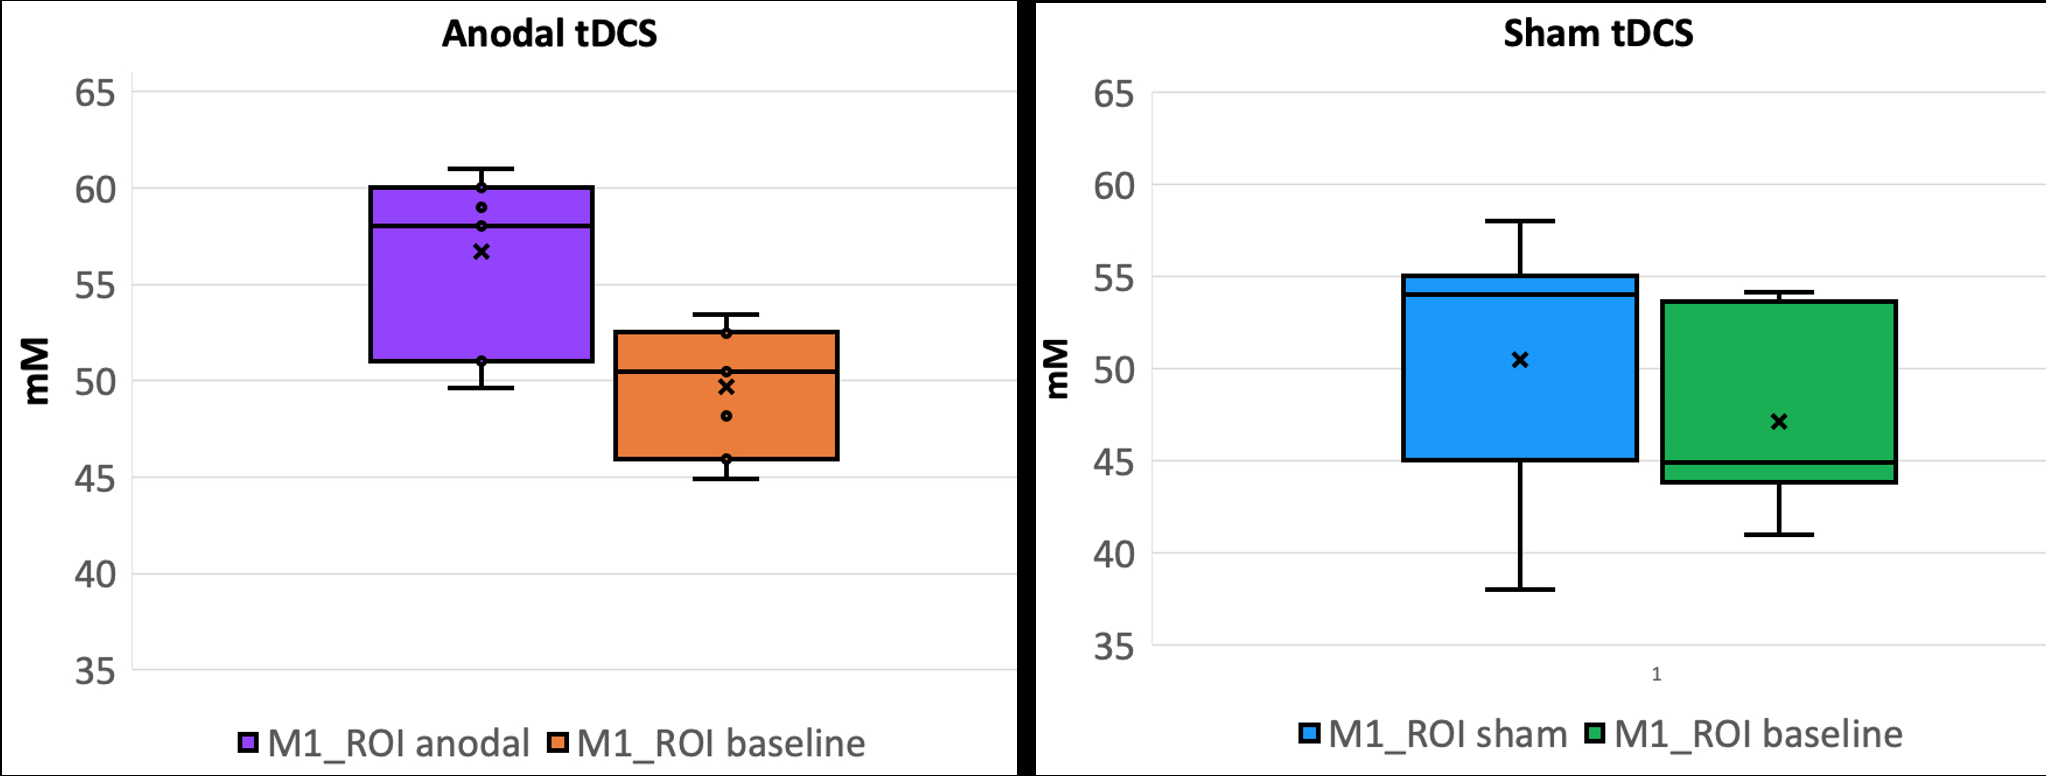
Fig.4: Subject-wise average change in [NA]GM in the motor ROI for anodal stimulation (left) and sham (right).