3729
In vivo detection of GSH in the mouse brain using MEGA-PRESS at 9.4T1Biomedical Engineering, Columbia University, New York, NY, United States, 2Columbia University, New York, NY, United States, 3Herbert Irving Comprehensive Cancer Centre, Columbia University, New York, NY, United States, 4Bruker BioSpin, Billerica, MA, United States, 5Department of Psychiatry, Columbia University, New York, NY, United States
Synopsis
Glutathione (GSH) is an important intracellular antioxidant in the brain. Various clinical human studies report its measurement by localized 1H spectroscopy using MEGA-PRESS and achieve high reliability and accuracy of GSH measurements at 3 T. As of today, animal model studies conducted at higher fields significantly enhance the armamentarium of tools available for the probing brain function and brain pathologies. However, even though mice are widely used in research, limited studies of GSH in mouse models are conducted. In this study, we demonstrate that MEGA-PRESS is a feasible technique to measure GSH in the mouse brain in vivo at 9.4T.
Introduction
Glutathione (GSH) is one of the most abundant thiol antioxidants in animal cells. The main function of GSH is to combat free-radicals, which can damage growth and survival of cells1,2. Especially in the brain, GSH plays a crucial role for cellular detoxification of reactive oxygen species and neurological diseases that correlate with this stress3. Amongst a wide range of methods for GSH measurement in vivo, Meshcher-Garwood point-resolved spectroscopy (MEGA-PRESS) is the most widely used magnetic resonance spectroscopy (MRS) technique4,5. MEGA-PRESS is a J-difference editing pulse sequence that can selectively isolate GSH from overlapping signals such as N-acetylaspartate (NAA)6. 1H MRS spectral editing of various metabolites with MEGA-PRESS has given rise to many human studies. However, spectral editing on animal studies have been unpopular due to magnet drift, difficulty in respiratory motion regulation, small brain size, the lack of automated spectral processing and quantification software5. Particularly for mouse study, limited investigations are conducted7. In current study, MEGA-PRESS at 9.4 T was used to quantify GSH content in mouse brains to evaluate its feasibility and utility for future uses.Material and Methods
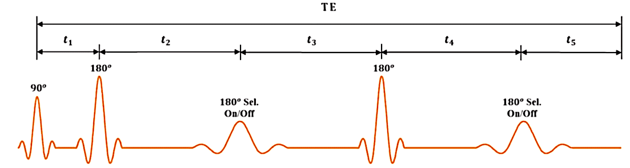
2.1 MEGA-PRESS sequence setupA Bruker BioSpec 94/30 (field strength, 9.4 T; bore size, 30 cm) horizontal small animal MRI scanner with software ParaVision 6.0.1 and a cryogenic mouse head multi-array surface coil were used for the experiments. The MEGA‐PRESS frequency‐selective 180° refocusing pulses were applied at the offset of 4.56 ppm during the ‘On’ and 8 ppm during the ‘Off’ excitation with variable TE and TR = 2000 ms. The sequence setup is depicted in Fig1.
2.2 TE Optimization
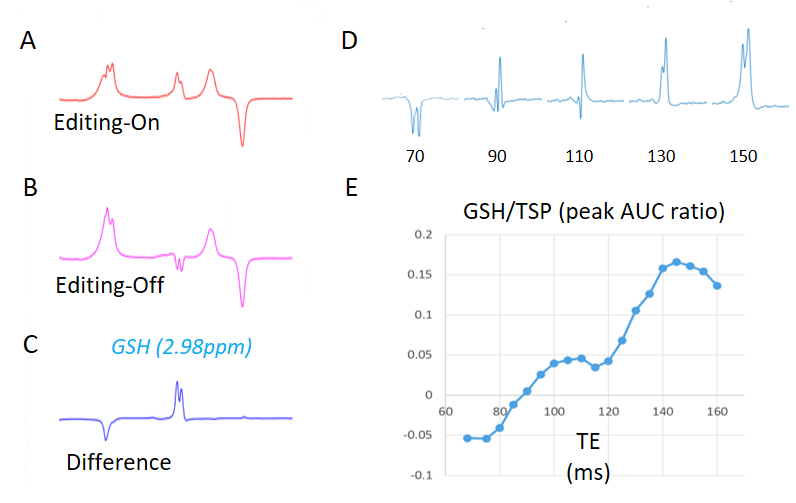
The implemented MEGA-PRESS sequence was used to determine the optimal echo time (TE) that will produce the highest GSH/TSP level at 9.4 T. Measurements began from TE=68 ms, and the GSH/TSP level was computed for every 5 ms increments up until TE=150 ms. This study was conducted with a concentration of GSH of 30 mM and a concentration of TSP of 20mM. The study design is depicted in Fig2.
2.3 GSH Regional Differences
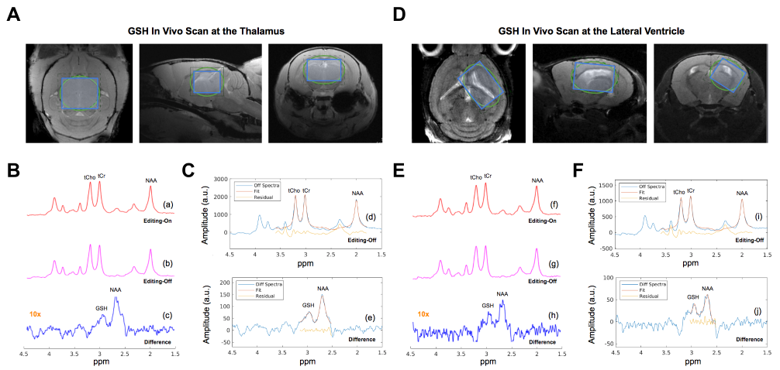
With 3 mouse samples, MEGA-PRESS sequence was used to detect GSH levels in the mouse brain using multiple MR images with depiction of size, location and angulation at the thalamus and lateral ventricle at 9.4 T. A single-voxel spectra acquired in 17 min with an editing pulse applied at 4.56 ppm for the ‘ON’ and 8 ppm for the ‘OFF’. The DIFF spectra showing the edited brain GSH resonance at 2.98 ppm was used to evaluate the GSH/NAA concentration at each location. Fig.3 demonstrates the study region and output.
Results
3.1 GSH Detection and TE OptimizationUsing MEGA-PRESS, editing GSH resonance was accurately determined at 2.98 ppm on the DIFF spectra. The performance of MEGA-PRESS is shown in Figure 2[A-C]. The optimal echo time of GSH in vivo using MEGA-PRESS sequence was at 145 ms. It was found that as TE increases, so does the detection of GSH content over the range 68 - 150 ms. Sample simulations are shown in Fig.2[D] and the optimal TE was determined by analyzing Fig. 2[E].
3.2 GSH Regional Differences
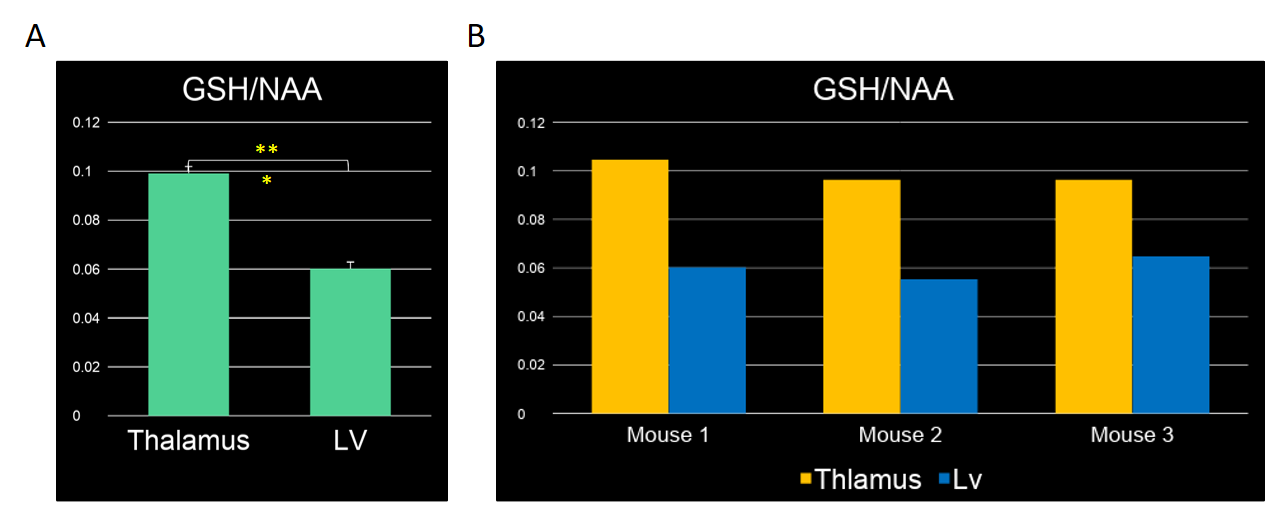
The GSH concentration in different brain regions was determined by comparing the ratio of GSH/NAA at each location. Findings show the GSH level to be significantly greater in the thalamus than the lateral ventricle for all mouse subjects used and with student’s t-test results. The results of the difference in GSH content is depicted in Figure 4[A-B].
Discussion and Conclusion
MEGA-PRESS shows that the maximum GSH peak amplitude was found at 145 ms. This result demonstrates an approximately 200% improvement compared to TE=68 ms, and an approximately 50% improvement compared to TE=130 ms. As GSH is a small metabolite, it can be assumed that T2 of GSH in the brain is longer than water and other macromolecules. Furthermore, a better selectivity can be made when choosing the longer TE. Thus, a greater improvement in contrast between the GSH signal and water/macromolecule signal can be retrieved when choosing TE=145 ms over other TE values8. In addition, with significant differences of GSH content in different brain regions, it can be thought as inhomogeneous6. This notion may be attributed to factors such as different tissue structures, different energetic demands and correlation to certain molecules which can affect the susceptibility of GSH-related neurological disorders.In conclusion, we have demonstrated the feasibility of MEGA-PRESS for the in vivo detection of GSH in the mouse brain. Our work can be used as reference for different metabolite experiments in small animal brains. A more in-depth regional analysis of GSH may be essential to further evaluate the performance of MEGA-PRESS. All in all, an in vivo mouse analysis was successfully conducted and the data retrieved from this study paves the way for future rodent studies at 9.4T. In parallel with the rapid development of transgenic mouse models of neurological diseases, in vivo GSH MEGA-PRESS study in mice offers the potential to develop novel markers of disease progression and therapy.
Acknowledgements
This study was performed at the Zuckerman Mind Brain Behavior Institute at Columbia University and Columbia MR Research Center site.References
1. Pham-Huy, Lien Ai et al. “Free radicals, antioxidants in disease and health.” International journal of biomedical science : IJBS vol. 4,2 (2008): 89-96. PMCID: PMC3614697
2. Miller VM, et. al. Reduced glutathione is highly expressed in white matter and neurons in the unperturbed mouse brain--implications for oxidative stress associated with neurodegeneration. Brain Res. 1276. 2009. pp 22-30. doi: 10.1016/j.brainres.2009.04.029.
3. Ralf Dringen, Johannes Hirrlinger. Glutathione Pathways in the Brain. Biol Chem. vol. 384, no. 4, pp. 505-16, 2003. doi: 10.1515/BC.2003.059
4. Mullins, Paul G et al. “Current practice in the use of MEGA-PRESS spectroscopy for the detection of GABA.” NeuroImage vol. 86 (2014): 43-52. doi:10.1016/j.neuroimage.2012.12.004
5. Guo, J. et. al. In vivo detection and automatic analysis of GABA in the mousebrain with MEGA‐PRESS at 9.4 T. NMR In Biomedicine. 2017. DOI: 10.1002/nbm.3837
6. Harris, Ashley D et al. “Edited 1 H magnetic resonance spectroscopy in vivo: Methods and metabolites.” Magnetic resonance in medicine vol. 77,4 (2017): 1377-1389. doi:10.1002/mrm.26619
7. Sawiak SJ, et. al. In vivo γ‐aminobutyric acid measurement in rats with spectral editing at 4.7T. J Magn Reson Imaging. 2016;43(6):1308‐1312.
8. Li, A. et. al. Measurement of Glutathione in Normal Volunteers and Stroke Patients at 3 T Using J-Difference Spectroscopy with Minimized Subtraction Errors. J. Magn Reson Imaging. vol. 30, no. 2, pp. :263-270. 2009. doi:10.1002/jmri.21832
Figures