3726
Standard Frame of Reference for the Identification of Metabolic Phenotypes of Brain Tumors using Single Voxel MR Spectroscopy1Radiology, Brigham and Women's Hospital, Boston, MA, United States
Synopsis
This work introduces a reference frame for the evaluation of single-voxel spectroscopy scans of brain tumors. The goal of this work is to stratify the classification of spectra based on metabolic features to maximize their specificity. The method was developed using decision trees and tested with different sample classifications that included tumor vs. non-tumor voxels and IDH vs. non-IDH tumors.
Introduction
MR Imaging is a powerful technique for the diagnosis, treatment planning, and progression monitoring of brain tumors. Complementarily, MR Spectroscopy (MRS) and Spectroscopic Imaging (MRSI) measure the chemical composition of tissues non-invasively, providing metabolic markers that characterize the phenotype of healthy brain tissue and different types of tumor tissue. In the case of brain tumors, MRS has been used to measure 2-hydroxy-glutarate (2HG) non-invasively1,2,3, an oncometabolite of gliomas with isocitrate dehydrogenase (IDH) mutations. Thus, metabolic changes as measured by MRS could provide a non-invasive accurate diagnosis and stratify patients for a more patient-specific treatment of the disease. However, given the low concentration of some relevant metabolites such as 2HG, lactate (Lac), or glutamate (Glu), the sensitivity and specificity achieved with the evaluation of individual metabolites is still limited. This work proposes a standard reference frame for the evaluation of MRS scans of brain tumors. The method combines multiple metabolites to identify phenotypes4 of normal-appearing tissue and tumor tissue and characterize their metabolic composition using high-SNR single-voxel MRS scans. The most relevant metabolites are combined to improve the sensitivity and specificity of MRS scans of brain tumors compared to the evaluation of single metabolites, such as 2HG.Methods
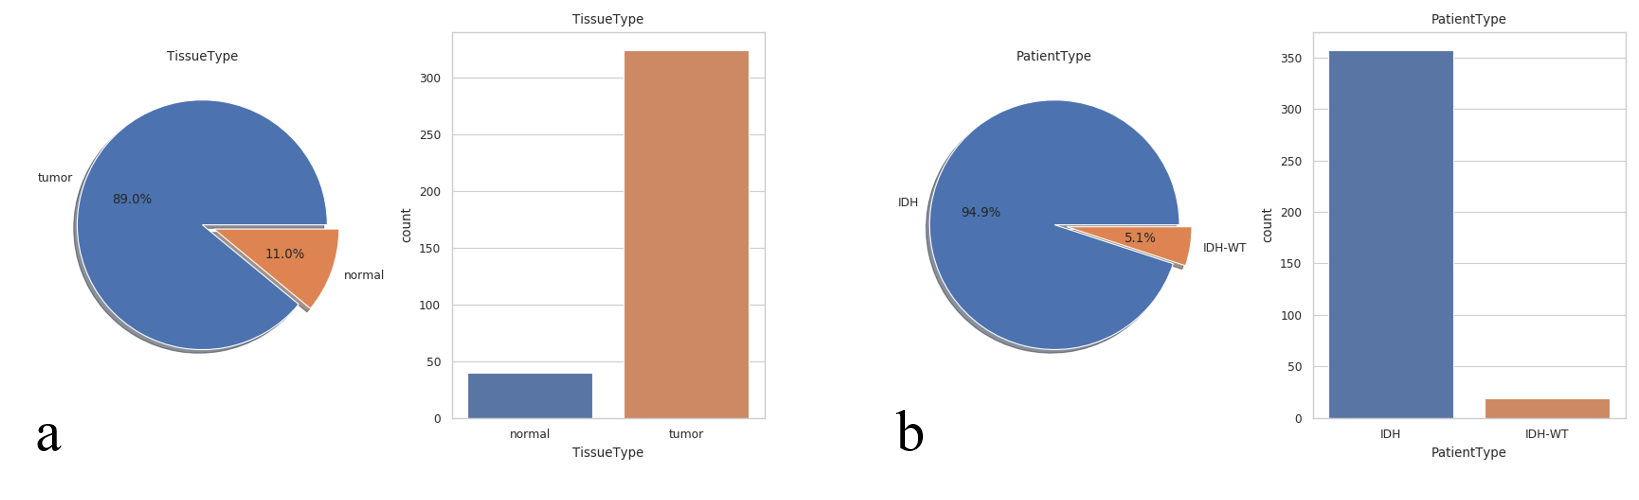
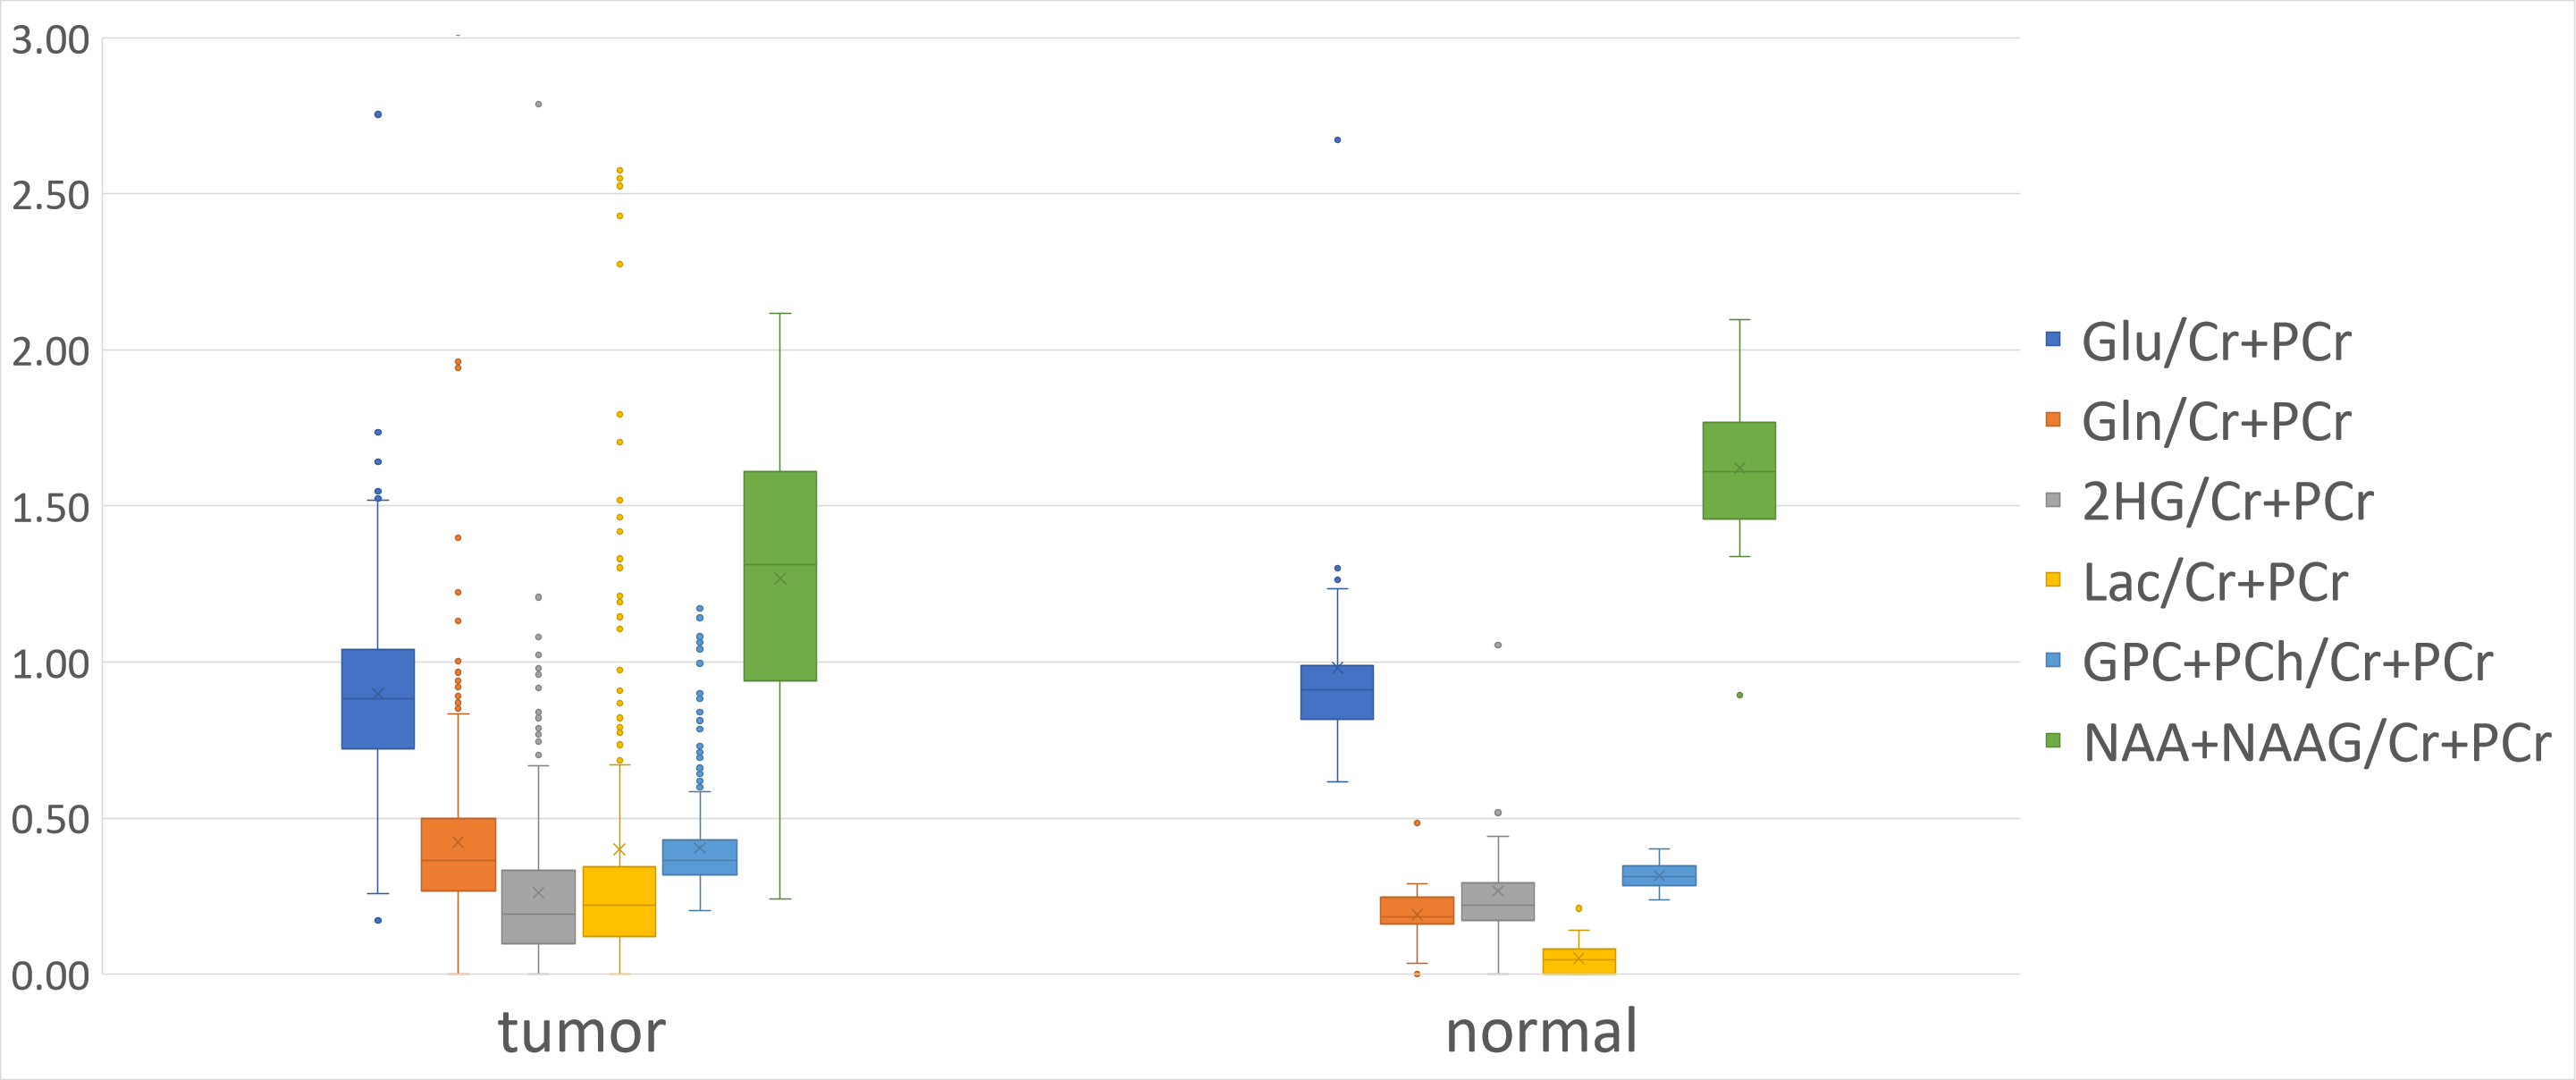
Data collection: 364 single-voxel MRS scans (40 normal-appearing tissue samples, 324 tumor-tissue samples) scans of 125 independent subjects (116 glioma patients, 9 healthy subjects), were analyzed to identify the major tissue classes in which healthy and tumor brain tissue could be classified. All MRS scans were acquired at 3T (Siemens Skyra, Prisma, and Verio, Erlangen, Germany) using PRESS localization, TE/TR=97/2000ms, and volumes in the range of 3.4-25mL. The distributions of the tissue types and tumor types in the dataset are shown in Fig.-1.Data Processing and Quantification: The MRS datasets were reconstructed using OpenMRS Lab5 and quantified using LCModel6. The quantified metabolite ratios to total creatine (tCr) were used to build a decision tree that optimally classified the dataset into the different labels. The metabolites used as features for the decision tree were chosen from relevant tissue signatures of healthy brain tissue and tumor tissue, these included: total NAA (tNAA). total choline (tCho), lactate (Lac), glutamate (Glu), glutamine (Gln), and the combined Glu+Gln (Glx), and 2HG. The distribution of these metabolites is shown in Fig.-2.
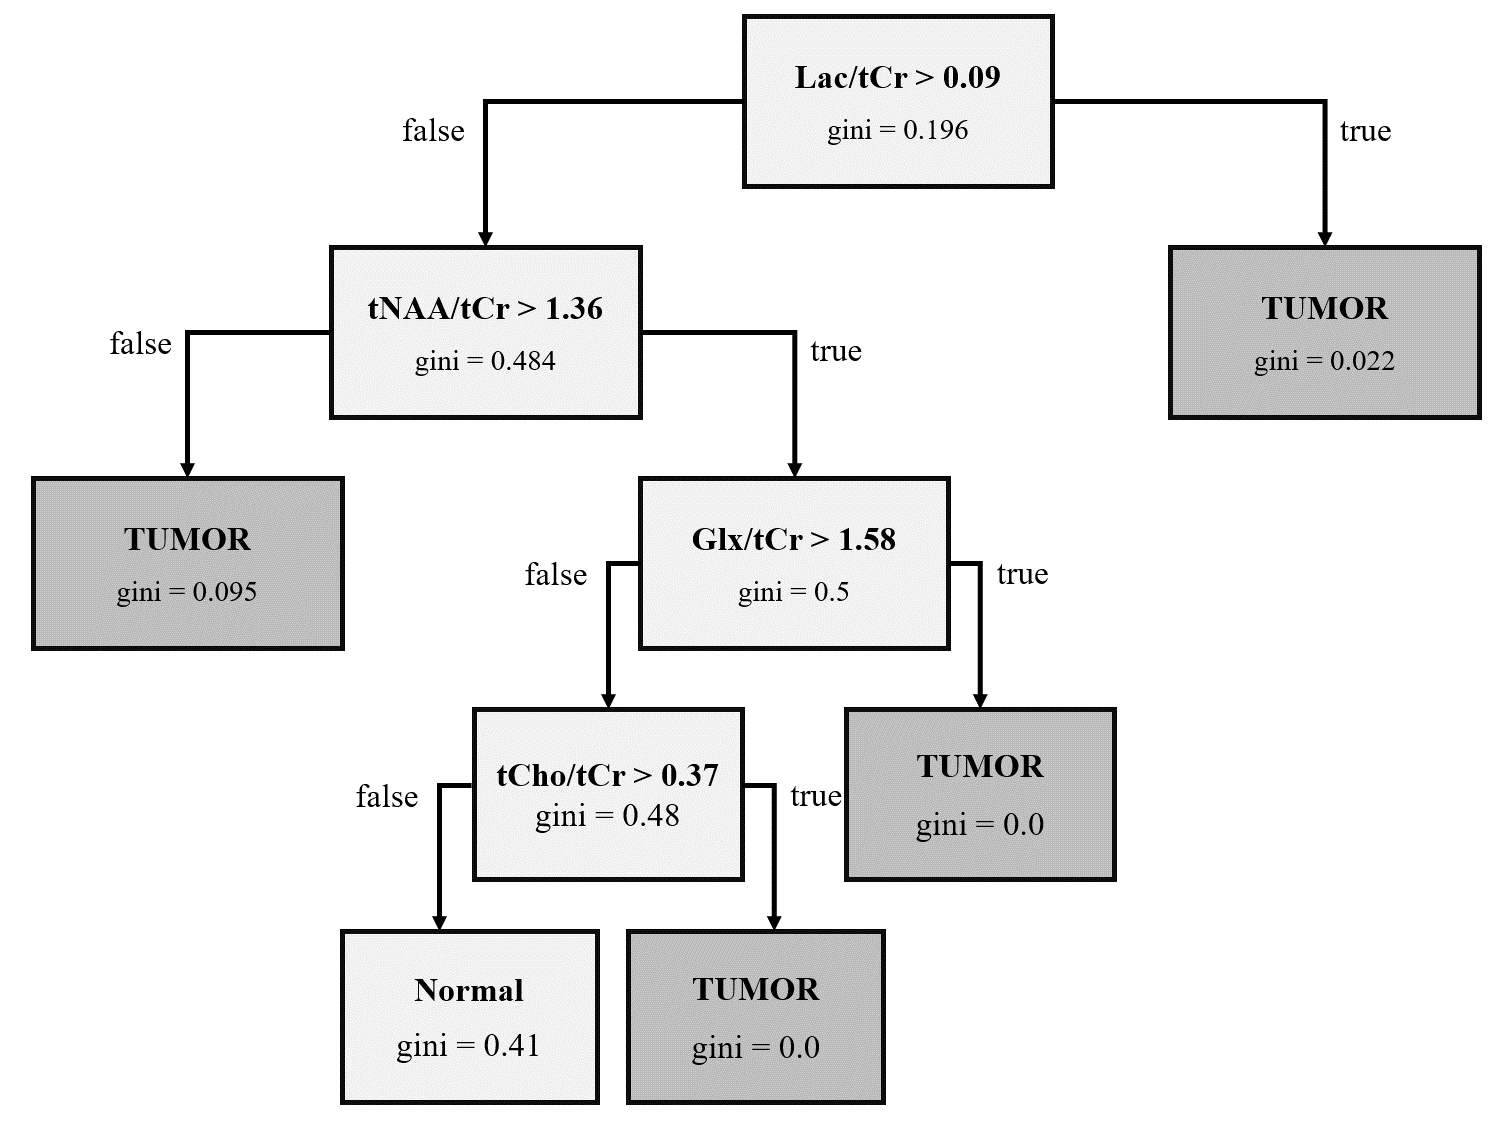
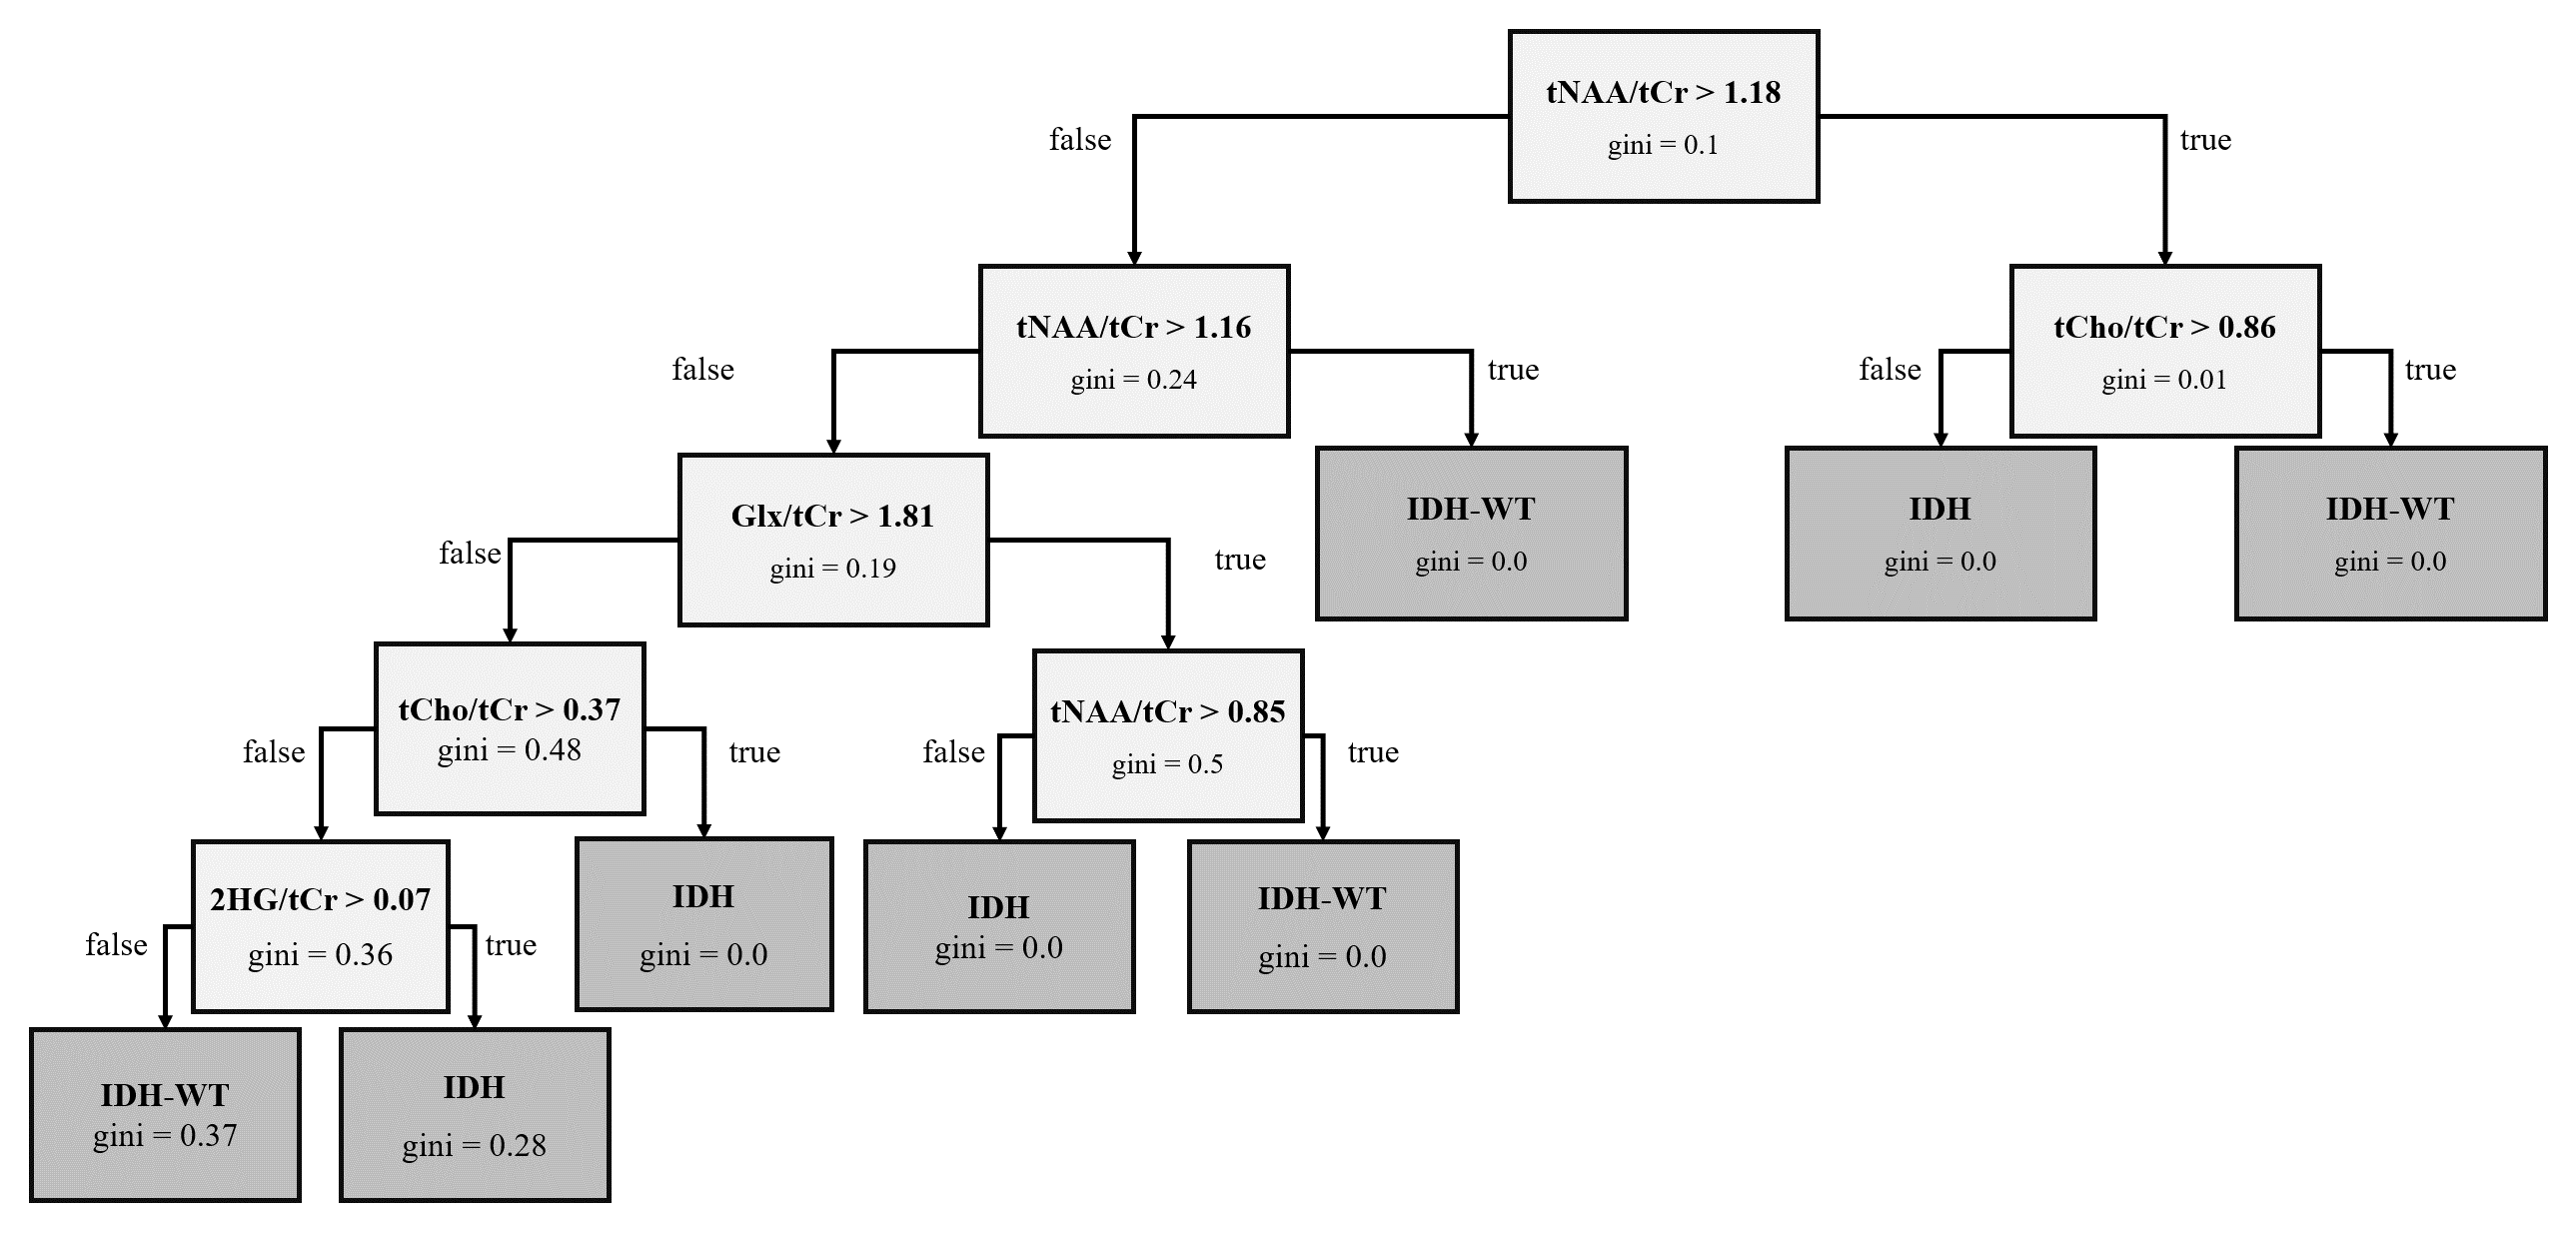
Decision Tree Classification: Two classification models were shown: (1) a decision tree for the classification of MRS samples into normal‑appearing tissue and tumor tissue, and (2) a decision tree for the classification of tumor MRS samples into IDH-Mutant (IDH) and IDH‑wildtype (IDH-WT) tumors. The model was generated with a maximum of 5 features and a maximum depth of 4 nodes.
Results and Discussion
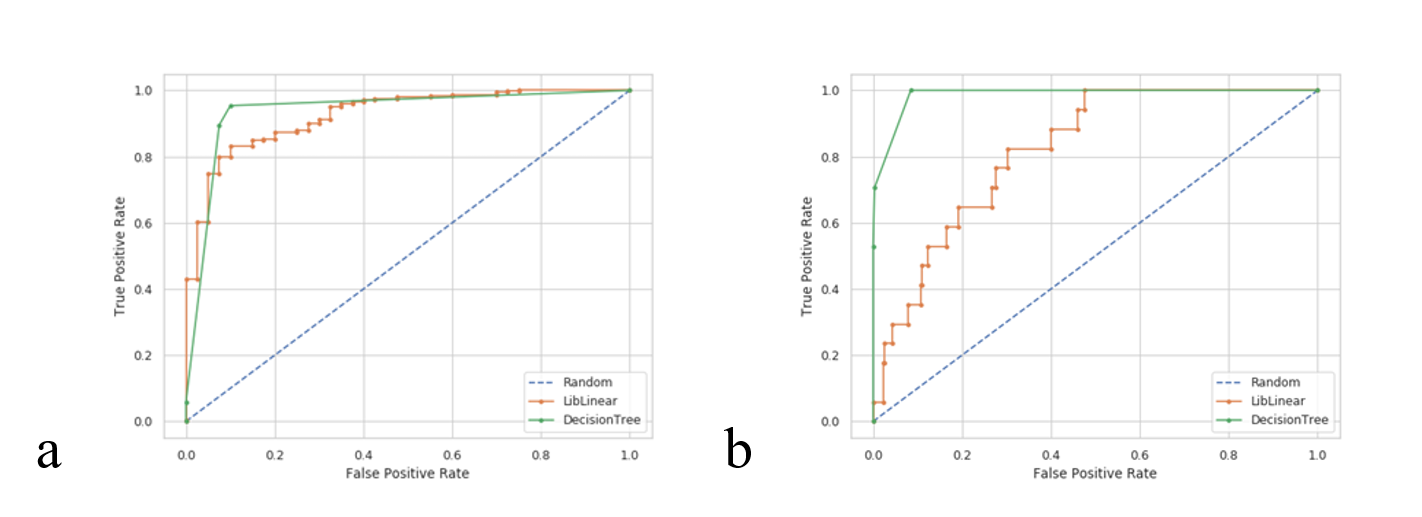
The receiver operating characteristic (ROC) curves of the generated classification models is shown in Fig.-3. The obtained area under the curve (AUC) were 0.93 and 0.98 for the model (1) and (2) respectively. Fig.-4 and Fig.-5 show the decision tree with thresholds that best classifies the datasets into normal and tumor tissue and IDH and IDH-WT. Given the unbalanced classes in both models, overfitting may occur for both the case of IDH vs IDH-WT tumors, as the sensitivity of 2HG is lower.Conclusion
A standard reference frame for the classification of tissue scans using MRS was built. The methodology has the goal of improving the robustness for the identification of tumor types compared to univariate analysis, especially for the identification of IDH-mutated tumors. A standard reference like the one built here can potentially improve patient care and clinical decision making in neuro‑oncology.Acknowledgements
No acknowledgement found.References
[1] Choi C et al. 2-hydroxyglutarate detection by magnetic resonance spectroscopy in IDH-mutated patients with gliomas. Nat Med (2012).
[2] Jalbert LE, et al. Metabolic Profiling of IDH Mutation and Malignant Progression in Infiltrating Glioma. Nature Scientific Reports (2017).
[3] Shen X, et al. A Noninvasive Comparison Study between Human Gliomas with IDH1 and IDH2 Mutations by MR Spectroscopy. ISMRM (2019).
[4] Coello E, et all. Long Term Monitoring of Brain Tumors Using MR Metabolic Phenotyping ISMRM (2020).
[5] Rowland B, et al. An open-source software repository for magnetic resonance spectroscopy data analysis tools. ISMRM MR Spectroscopy Workshop (2016).
[6] Provencher S. W. Automatic quantitation of localized in vivo 1H spectra with LCModel. NMR in Biomedicine 14, 260–264 (2001).
Figures