3720
Evaluation of the agreement of metabolite levels between PRESS and MEGA-PRESS techniques in the grading of glioma patients1Medical Imaging, The Ottawa Hospital, Ottawa, ON, Canada, 2Radiology, University of Ottawa, Ottawa, ON, Canada, 3University of Ottawa, Ottawa, ON, Canada, 4Division of Neurosurgery, The Ottawa Hospital, Ottawa, ON, Canada, 5The Ottawa Hospital Research Institute, Ottawa, ON, Canada, 6Division of Neurology, University of Ottawa, Ottawa, ON, Canada, 7Department of Pathology and Laboratory Medicine, The Ottawa Hospital, Ottawa, ON, Canada
Synopsis
The main objective of this study is to evaluate the agreement of metabolites between the MEGA-PRESS sequence (analyzing the edit-off spectrum) and a standard long TE PRESS sequence that is used in clinical routine for tumour characterization. The T2 corrected metabolite levels of NAA, Cho and Cr obtained from the edit-off spectrum of the MEGA-PRESS sequence are in good agreement with those obtained from the standard long TE PRESS sequence. No significant difference in the diagnostic accuracy was found.
INTRODUCTION
The Mesher-Garwood (MEGA)-PRESS spectral editing technique has been used to identify 2-hydroxyglutarate (2-HG) preoperatively in glioma patients with isocitrate dehydrogenase mutation (IDH)1,2. The main objective of this study is to evaluate the agreement of other metabolites (choline [Cho], creatine [Cr] and N-acetylaspartate [NAA]) between the MEGA-PRESS sequence (analyzing the edit-off spectrum) and a standard long TE PRESS sequence that is used in clinical routine. A secondary objective is to evaluate the diagnostic accuracy of those metabolites in the preoperative grading of glioma.METHODS
In this prospective study, thirty-nine consecutive patients with a newly diagnosed glioma were enrolled. All patients underwent a clinical examination with a 3T MR scanner (Siemens Healthineers, Erlangen, Germany). The spectral editing sequence was based on the method published by Choi3. MEGA-PRESS parameters were: TR = 2 s, TE = 60 ms, 20 ms spectral selective Gaussian pulse at 1.9 ppm (edit-on) and at 7.5 ppm (edit-off), 128 averages for edit-on and edit-off, voxel size = 8 cm3, duration = 8.40 min). Using the FLAIR images, the voxel was positioned to include the maximal amount of solid tumour tissue. A standard PRESS sequence was performed in the same location with an identical voxel size after the MEGA-PRESS acquisition with the following parameters: TR = 2 s, TE = 135 ms, 128 averages, duration = 4:20 min. The MRS data was analyzed using the LCModel (Version 6.3) based on simulated metabolite spectra according to each sequence. Cho, Cr and NAA from the PRESS and from the edit-off MEGA-PRESS acquisition were evaluated. Metabolite levels from the edit-off spectrum were corrected for T2 relaxation using values previously published4. Reproducibility of metabolite levels between the two techniques were assessed using a Bland-Altman analysis. ROC analysis was performed to measure the diagnostic accuracy of different metabolite ratios in the diagnosis of high grade vs low grade gliomas.RESULTS
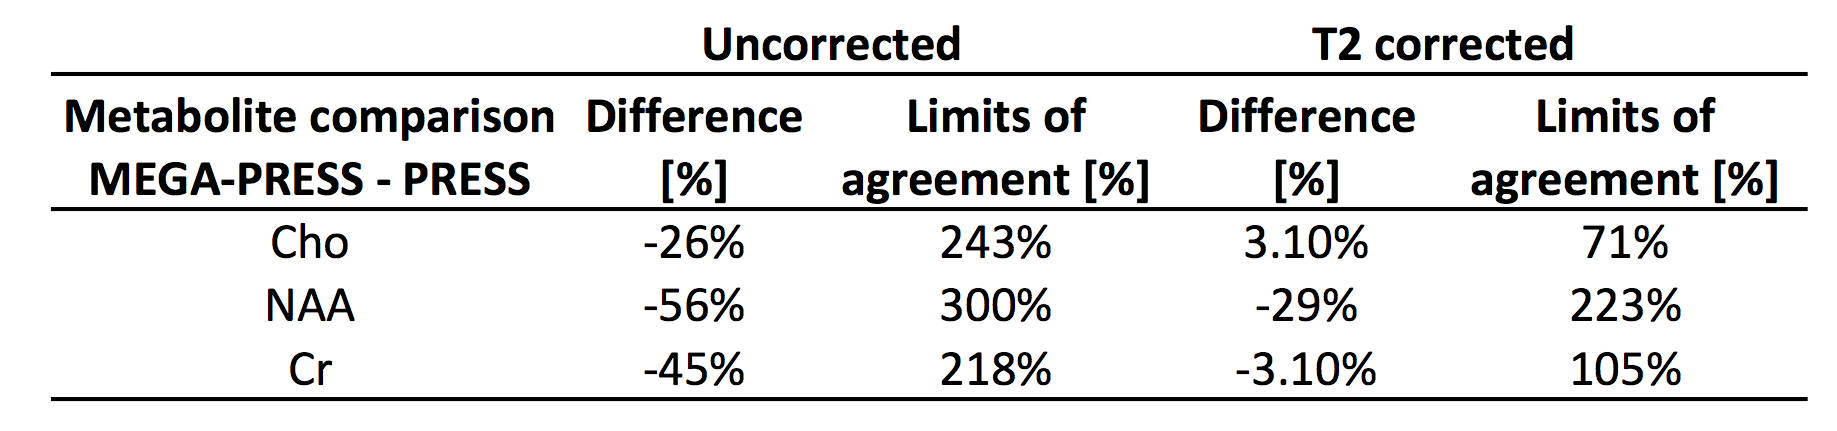
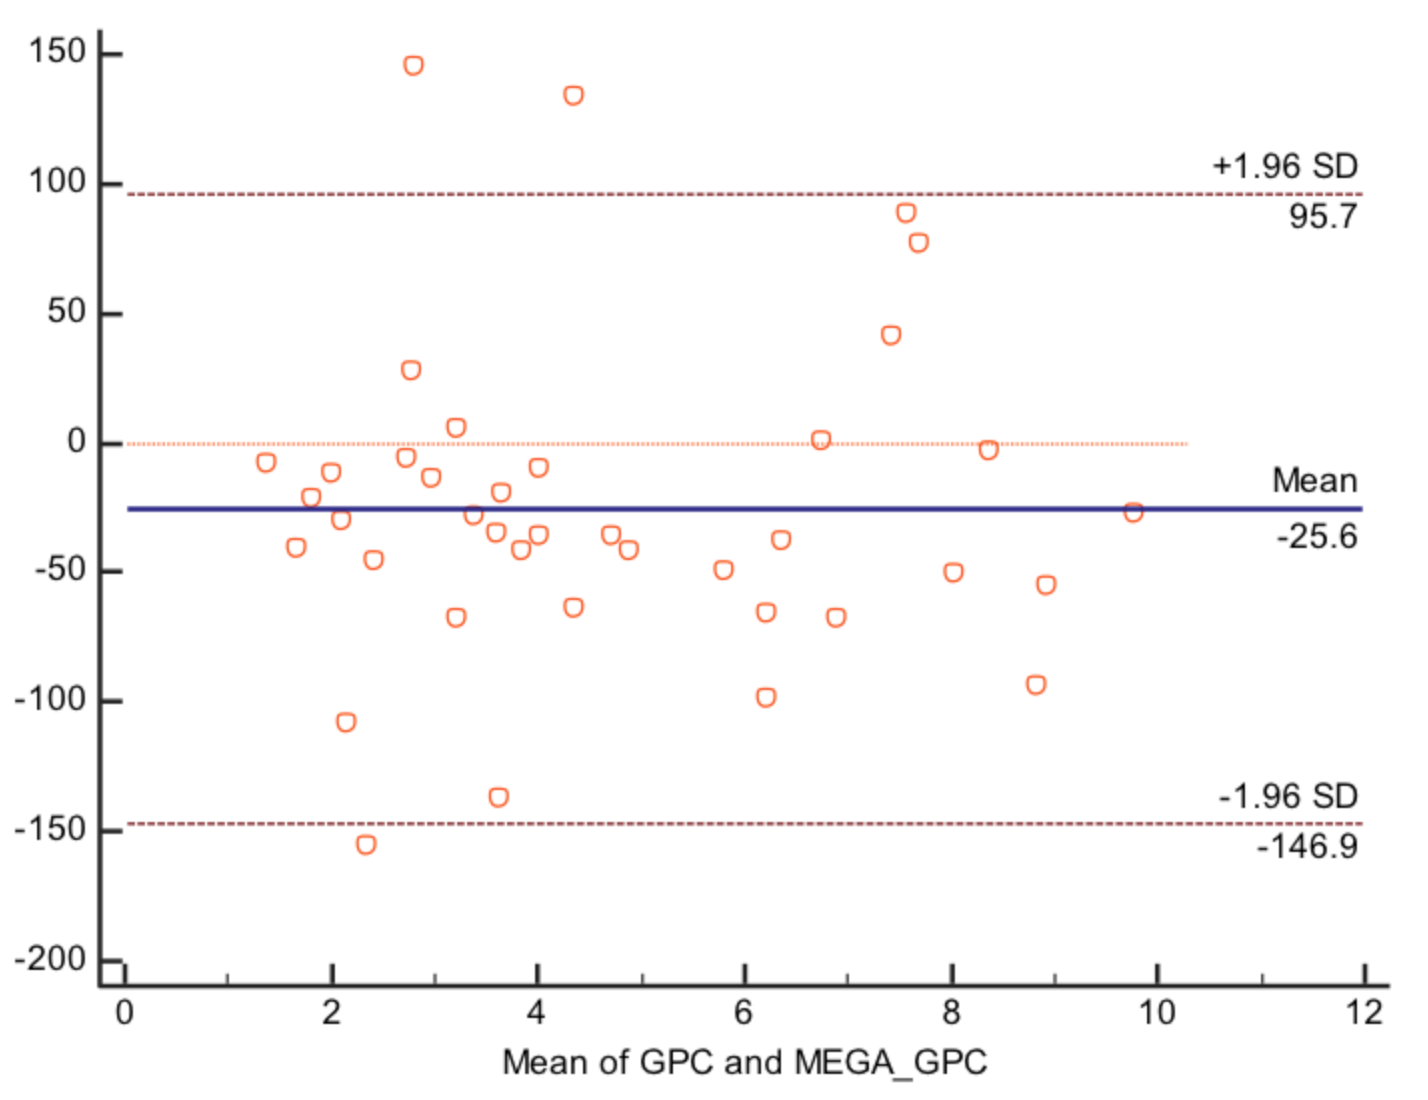
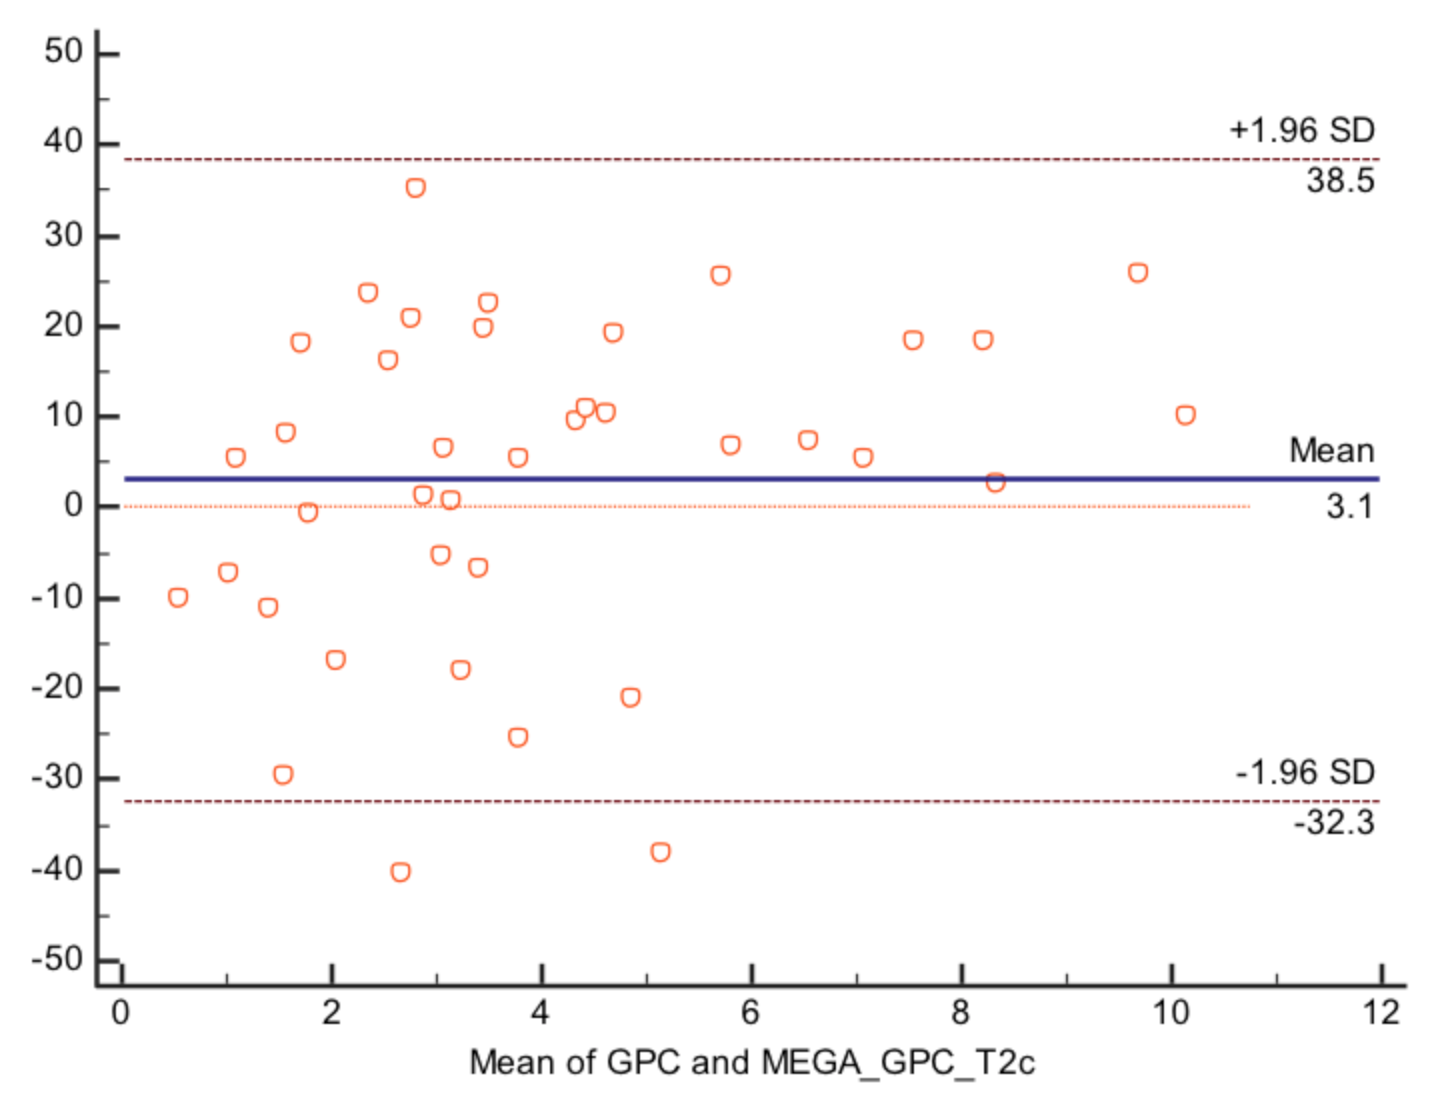
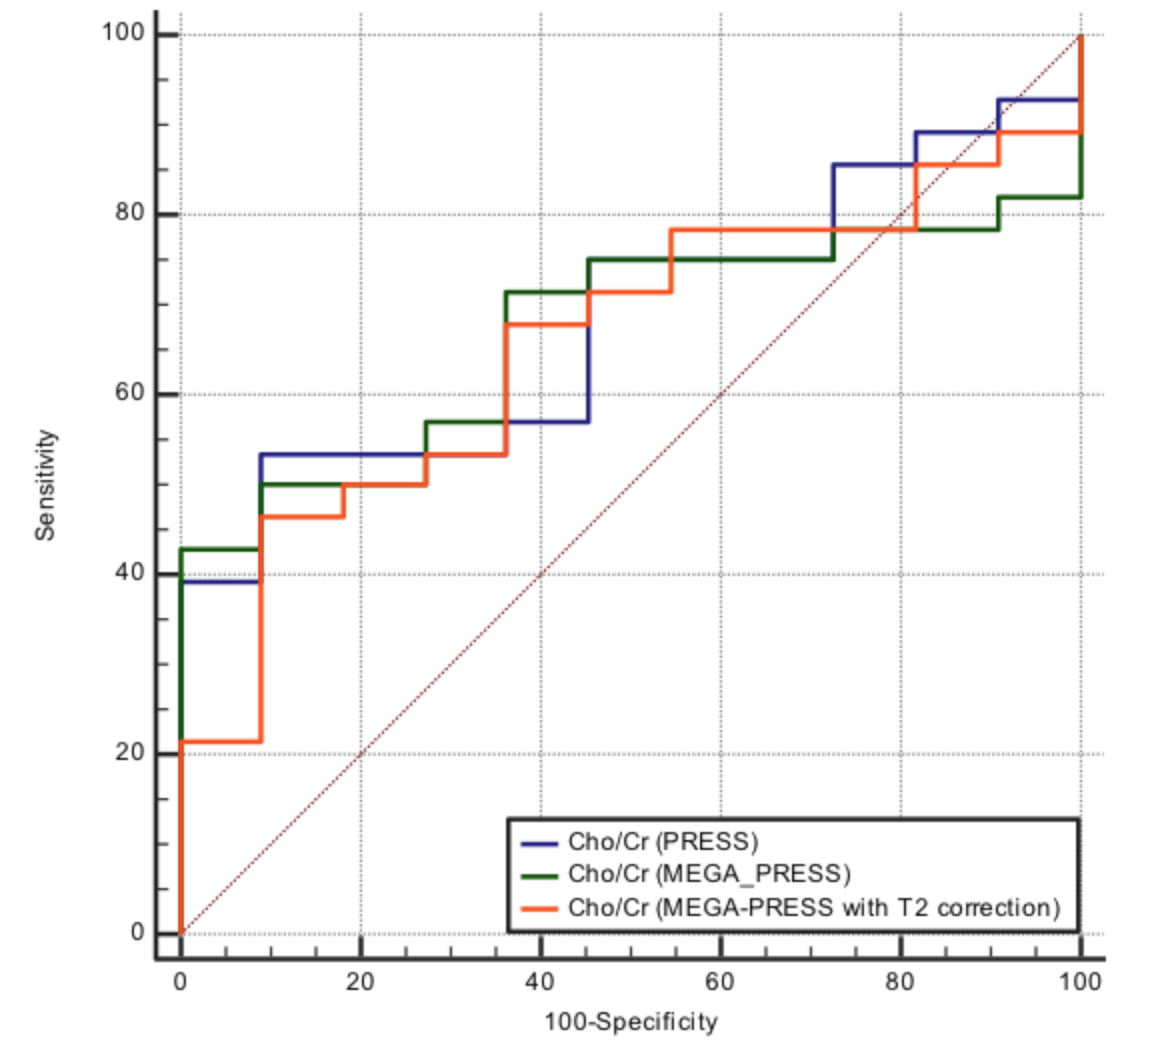
For all three metabolites, the level of agreement between the two techniques was higher when values from edit-off spectrum of the MEGA-PRESS sequence were corrected for T2 relaxation (Fig. 1). Without T2 correction, the difference in percentage between PRESS and edit-off MEGA-PRESS was -25.6% with limits of agreement of 243% (Fig. 2). With T2 correction, the difference in percentage for Cho was 0.24% with limits of agreement of 3.1% (Fig. 3). For differentiation between high and low grade gliomas, the diagnostic accuracy of the Cho/Cr ratio (AUC=0.68, 95% CI 0.52 to 0.85) from PRESS was not statistically different from the ratios obtained from edit-off MEGA-PRESS without (AUC=0.67, 95% CI 0.50 to 0.83) and with T2 correction (AUC=0.66, 95% CI 0.48 to 0.83, P>0.05, Fig. 4).DISCUSSION
The MEGA-PRESS technique was shown to be a useful tool for 2-hydroxyglutarate editing and identification of IDH-mutant gliomas with high specificity. Although 2HG has been an important marker for IDH mutation, classical metabolites like NAA, Cr, and Cho have been used to predict the histopathological grade of cerebral glioma. Our study found that these metabolites typically acquired using a routine long TE PRESS sequence can also be evaluated using the MEGA-PRESS edit-off spectrum. The results showed good agreement between the two spectra when corrected for T2 and no significant difference was found for diagnostic accuracy. A future analysis will focus on comparing other metabolites (like glutamate, glutamine), where the shorter TE of the MEGA-PRESS acquisition might be more beneficial for the accuracy of the quantification.CONCLUSION
T2 corrected metabolite levels of NAA, Cho and Cr obtained from the edit off spectrum of the MEGA-PRESS sequence are in good agreement with those obtained from PRESS sequence. No significant difference in the diagnostic accuracy was found.Acknowledgements
No acknowledgement found.References
1) Branzoli F, Di Stefano AL, Capelle L, et al. Highly specific determination of IDH status using edited in vivo magnetic resonance spectroscopy. Neuro Oncol. 2018;20:907-916.
2) Nguyen TB, Melkus G, Taccone M, et al. Preoperative Determination of Isocitrate Dehydrogenase Mutation in Gliomas Using Spectral Editing MRS: A Prospective Study. J Magn Reson Imaging. 2020 Sep 17. doi: 10.1002/jmri.27366.
3)
Choi C, Ganji SK,
DeBerardinis RJ, et al. 2-hydroxyglutarate detection by magnetic resonance
spectroscopy in IDH-mutated patients with gliomas. Nat Med. 2012;18:624-9.
4)
Li Y, Srinivasan R, Ratiney H, et al.
Comparison of T(1) and T(2) metabolite relaxation times in glioma and normal
brain at 3T. J Magn Reson Imaging. 2008;28:342-50.
Figures