3719
1H-MRS of Primary Progressive and Relapsing-Remitting Multiple Sclerosis in brain white matter compared to healthy controls1Radiology, UBC MRI Research Centre, Vancouver, BC, Canada, 2Medicine, University of British Columbia, Vancouver, BC, Canada, 3Philips Healthcare Canada, Markham, ON, Canada, 4Simon Fraser University's ImageTech Lab, Surrey, BC, Canada, 5Physics & Astronomy, University of British Columbia, Vancouver, BC, Canada, 6Radiology, University of British Columbia, Vancouver, BC, Canada
Synopsis
This study establishes pre-treatment baseline metabolite concentrations for a longitudinal clinical trial for RRMS and PPMS using 1H-MRS. The high MRS data quality and similar in FWHM across all participants creates a strong baseline for detecting change over time. Furthermore, knowing the pre-treatment concentration and tracking concentration changes in the MS subtypes compared to a baseline HC group will allow us to learn more about the mechanisms of action of this therapy.
Introduction
Multiple sclerosis (MS) is an autoimmune demyelinating disease of the central nervous system (CNS)1 with different disease courses and possibly different pathogenesis2, here we examine Relapsing-Remitting MS (RRMS) and Primary Progressive MS (PPMS). We used 1H magnetic resonance spectroscopy (MRS) to examine metabolites within a mostly white matter brain region in both groups pre-treatment and a matched (across the whole MS cohort) healthy control (HC) cohort. We aim to establish baseline MRS data that can be used in the future to compare with treatment groups as part of a larger clinical trial (ClinicalTrials.gov Identifier: NCT02688985).Methods
All RRMS/PPMS participants were recruited from the UBC Hospital MS clinic as part of the OBOE ML29966 study, with demographics given in Figure 1. MRS PRESS (TE=30ms, TR=4000ms) sequence was collected on a 3T Philips Achieva in a large (65x15x20mm3) mostly white matter region in the left hemisphere (shown in Figure 2). The sequence was collected in two shots of 16 signal averages (NSA) that were frequency aligned, eddy current corrected and had residual water removed offline and averaged to result in NSA=32. Lesion masks were created semi-automatically by a trained observer3 and registered to the FAST tissue-segmented anatomical MPRAGE to determine tissue content. Fitting was performed with LCModel4 and outputs were corrected for tissue water content. Absolute errors were determined by multiplying the absolute metabolite concentration by the %SD output from LCModel. Absolute errors higher than 30% of the median metabolite concentration were considered poorly fit and rejected5. LCModel’s quality of fit measures were also examined; Full-Width-Half-Maximum (FWHM) and Signal-to-Noise Ratio (SNR). Since this is preliminary baseline data, group comparison statistics were not performed on the measures.Results
The large volume of interest (VOI) in a mostly white matter region produced high quality spectra with high signal to noise (median=31, range=21-31) and low FWHM (median=4.3Hz, range=3.4-6.9Hz). No metabolite concentration value was rejected in the main metabolites of interest; total N-acetyl aspartate (tNAA) and NAA, total creatine (tCr), total choline (tCho), glutamate (Glu) and myo-inositol (mI) (illustrated in Figure 2b). Metabolite concentrations for all groups are shown in Figure 3. tNAA and NAA appeared to be similar between groups, however there was one PPMS outlier at a much lower concentration. tCr and tCho varied widely across the MS groups and there was a hint of a general increase in tCr in MS compared to HC. We did observe that 9/14 PPMS participants exhibited levels of mI that were higher than 9/10 HC levels. The average lesion fraction for the RRMS and PPMS groups were 1% and 3% respectively, showing a negligible lesion fraction in the VOI, Figure 4. Figure 4 also shows the distribution of FWHM and SNR between groups, FWHM was comparable between groups and the SNR was roughly 10% higher in HC compared to PPMS. One PPMS participant had a high lesion load of 26% and the highest EDSS at 6.5 and lowest SNR, and also exhibited the lowest [tNAA] and [NAA]. Figure 5 shows the tissue segmentation and lesion mask for this participant and the spectrum exhibiting high data quality.Discussion
NAA is associated with neuron density or integrity , and also reflects oligodendrocyte/myelin vitality6. Decreases in tNAA or NAA are often found in pathologies including MS7, but were not observed here. However, literature reports of decreased NAA in MS have largely used ratios to creatine rather than absolute concentrations. In this preliminary baseline study we observed large variations in tCr in MS, suggesting changes in creatine may have been driving previously reported changes in MS NAA/tCr ratios. Further, we would expect NAA decreases primarily in lesions, while this study found a very small lesion fraction in the VOI; the one PPMS participant with high lesion load had very low tNAA and NAA levels. tCho and mI are thought to increase with inflammation, and while tCho levels varied widely among the MS groups, 9/14 PPMS participants appeared to exhibit elevated mI. It will be valuable to follow how this elevated mI changes over time with treatment. The quality of the data was high across all subject groups. Figure 5b shows that even in the participant with the lowest SNR the data is well fit and the FWHM is well within the range of the healthy control spectra. In summary, this study establishes pre-treatment baseline metabolite concentrations for a longitudinal clinical trial. The high MRS data quality and similar in FWHM across all participants creates a strong baseline for detecting change over time. Furthermore, knowing the pre-treatment concentration and tracking concentration changes in the MS subtypes compared to a baseline HC group will allow us to learn more about the mechanisms of action of this therapy.Acknowledgements
This study was sponsored by Genentech, IncReferences
1. Ghasemi, N., Razavi, S. & Nikzad, E. Multiple sclerosis: Pathogenesis, symptoms, diagnoses and cell-based therapy. Cell J. 19, 1–10 (2017).
2. Lublin, F. D. et al. Defining the clinical course of multiple sclerosis. Neurology 83, 278–286 (2014). 3. McAusland, J., Tam, R. C., Wong, E., Riddehough, A. & Li, D. K. B. Optimizing the use of radiologist seed points for improved multiple sclerosis lesion segmentation. IEEE Trans. Biomed. Eng. 57, (2010).
4. Provencher, S. W. Automatic quantitation of localized in vivo 1H spectra with LCModel. NMR Biomed. 14, 260–264 (2001).
5. Kreis, R. The trouble with quality filtering based on relative Cramer-Rao lower bounds. Magn. Reson. Med. 18, 15–18 (2015).
6. Nordengen, K., Heuser, C., Rinholm, J. E., Matalon, R. & Gundersen, V. Localisation of N-acetylaspartate in oligodendrocytes/myelin. Brain Struct. Funct. 220, 899–917 (2015).
7. Gülin, Ö. Magnetic Resonance Spectroscopy of Degenerative Brain Diseases. 13–30 (2016). doi:10.1007/978-3-319-33555-1
Figures
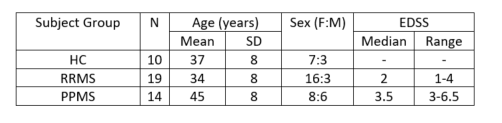
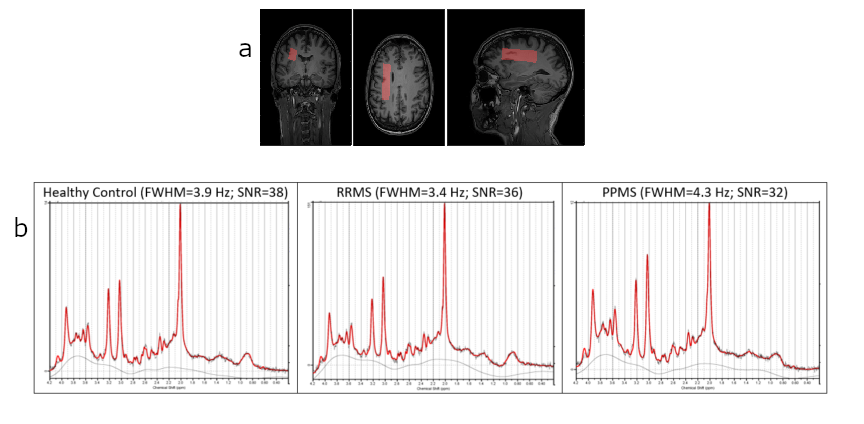
Figure 2a - Sample volume of interest (65x15x20mm3) in white matter region on MPRAGE ‘anatomical’ scan for healthy control.
b - Sample spectrum output from LCModel for each participant group with fit quality measures.
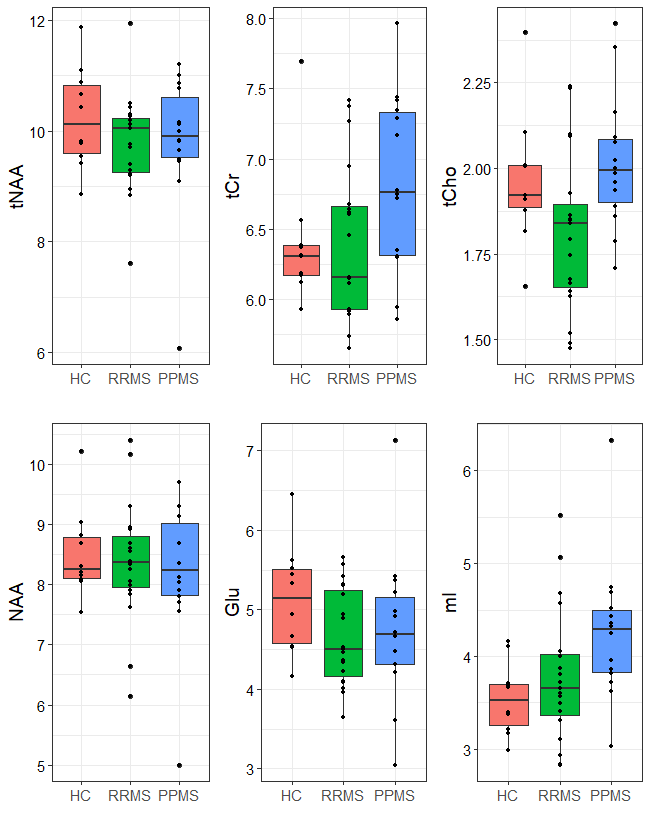
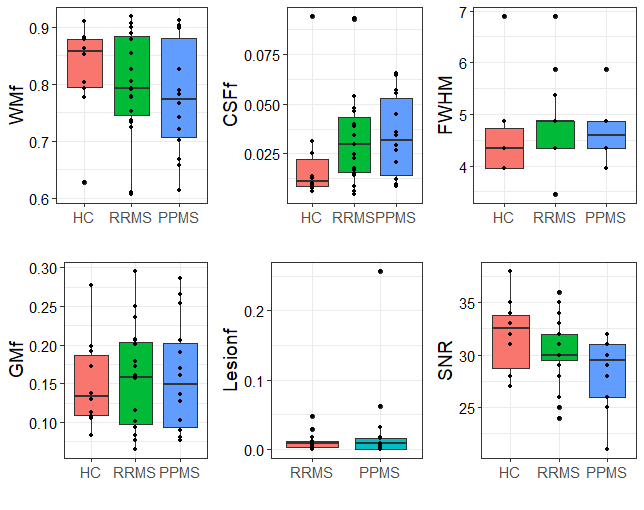
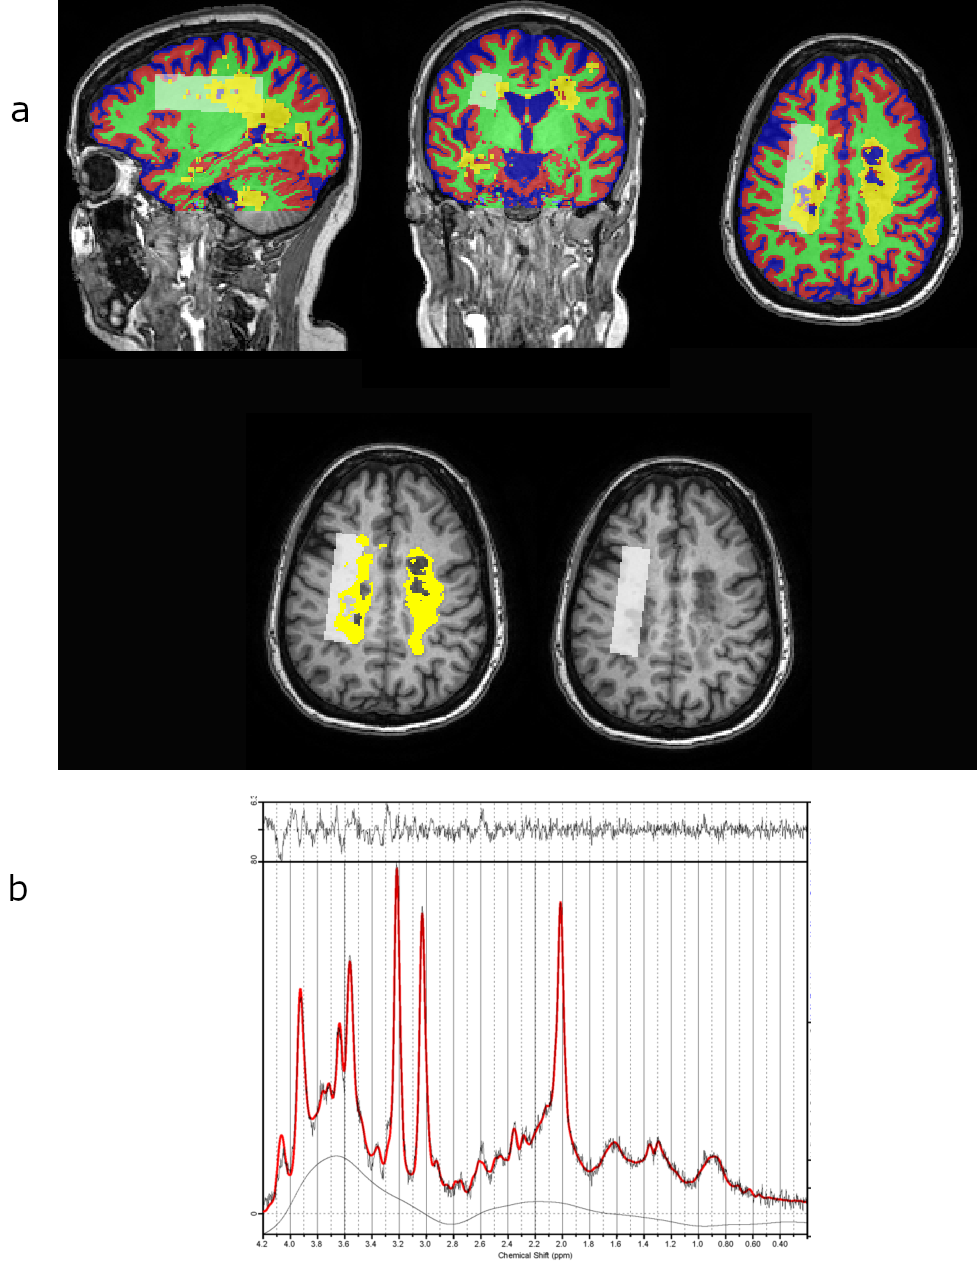
Figure 5 - PPMS (49F, EDSS=6.5) with high lesion fraction (26%) in the MRS VOI.
a - Top row: Tissue segmentation (blue=CSF, red=GM, green=WM, yellow=lesion) with VOI from MRS overlaid (white box) on MPRAGE anatomical scan. Bottom row: VOI (white box) with lesion mask (yellow) overlaid on MPRAGE anatomical scan.
b - LCModel output spectrum showing low NAA peak but high data quality, FHWM=4.9 Hz and SNR=21 (lowest SNR of all participants)