3718
Non-invasive assessment of glycolytic and oxidative metabolism in mouse glioma using DGE 2H-MRS1Champalimaud Research, Champalimaud Foundation, Lisbon, Portugal, 2Center of Functionally Integrative Neuroscience (CFIN) and MINDLab, Department of Clinical Medicine, Aarhus University, Aarhus, Denmark
Synopsis
Glioblastoma multiforme has been reported to rely both on glycolysis and oxidative metabolism but methods are lacking to assess such heterogenity in vivo. We previously showed a novel application of Marchenko–Pastur PCA denoising (MP-PCA) to dynamic glucose-enhanced deuterium MRS (DGE 2H-MRS). Here, we use this approach to measure glycolytic and oxidative metabolic turnover rates in mouse glioma, thereby assessing their functional metabolic heterogeneity. This methodology can be extended to other cancer models and is available for clinical translation, holding strong potential for improving non-invasive cancer phenotyping and/or assessment of early therapeutic response.
INTRODUCTION
Tumor metabolism relies on avid glucose consumption, typically imaged by 18F-FDG PET. This leads to high glucose-derived lactate synthesis rates (Warburg effect or aerobic glycolysis) and secretion to the tumor microenvironment, with concomitant acidification which in turn facilitates proliferation and invasion [1,2]. In the case of glioblastoma multiforme (GBM), the most aggressive form of primary brain tumors in adults, metabolic dependencies on glutamine and acetate have also been reported, from preclinical models to patients, demonstrating the ability to use both glycolysis and oxidation pathways [3,4]. Assessing this functional metabolic heterogeneity non-invasively could impact clinical management, but is hampered by the current MR modalities available for detecting fluxes, mostly based on 13C-MRS. Here, we combined dynamic glucose-enhanced deuterium MRS (DGE 2H-MRS) with Marchenko–Pastur PCA denoising (MP-PCA) [5] to measure glycolytic and oxidative glucose turnover rates in a mouse glioma model.METHODS
All animal experiments were preapproved by institutional and national authorities, and carried out according to European Directive 2010/63.MR setup.
All experiments were performed on a 9.4 T scanner (Bruker BioSpec), using a customized 2H/1H transmit-receive surface coilset (NeosBiotec): 2H, 11 x 15 mm inner loop, optimized for the mouse head; 1H, butterfly configuration, providing quadrature B1 field orientation. 2H-MRS data were acquired using a pulse-acquire sequence, with 175ms TR, 256 points, 1749 Hz, 51º flip angle, and outer volume suppression (OVS) with 6 pulses (10mm slabs), to excite only the tumor region.
In vivo experiments.
High-grade gliomas were induced in n=5 mice by intracranial stereotactic injection of 1E5 GL261 cells in the caudate nucleus [6] and studied 2-3 weeks post-implantation. Before each experiment, mice fasted 4-6h, were weighed (18-24g), cannulated in the tail vein, and placed in the animal holder under anesthesia (1-2% isoflurane in 29% O2), where they were heated with a recirculating water blanket, and monitored for rectal temperature (36-37ºC) and breathing (60-80 BPM); the i.v. catheter was connected to a home-built injection system filled with 6,6′-2H2-glucose (1.6M). Animals were first imaged with T2w 1H-MRI (x8 RARE, 3000 ms TR, 40 ms TE; 2 averages, 1 mm slice thickness, 70μm in-plane resolution). DGE 2H-MRS data were then acquired for 90 min (32k repetitions), with 6,6′-2H2-glucose i.v. bolus at 12 min (2 g/Kg, injected over 30 s).
Data analysis.
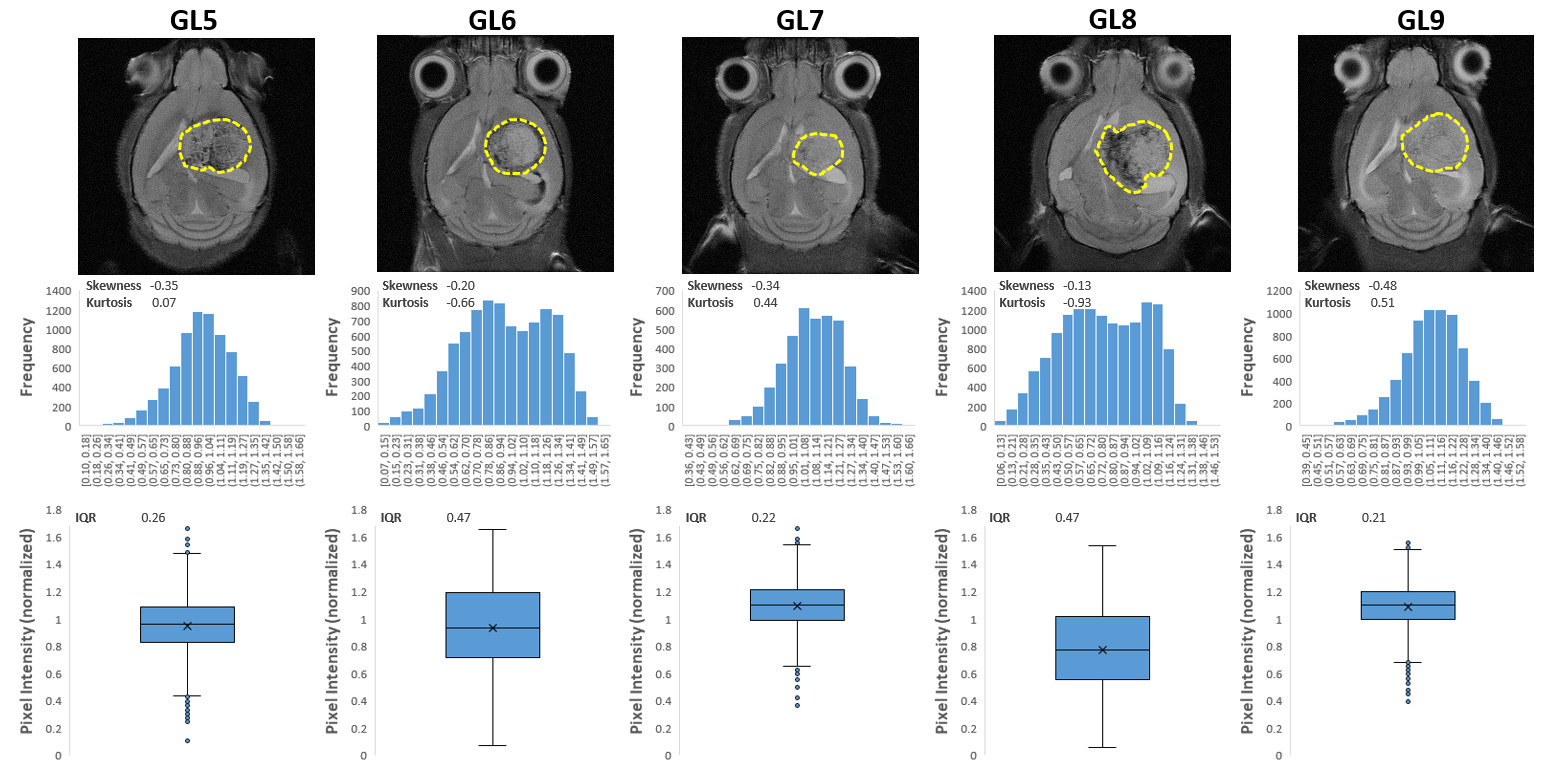
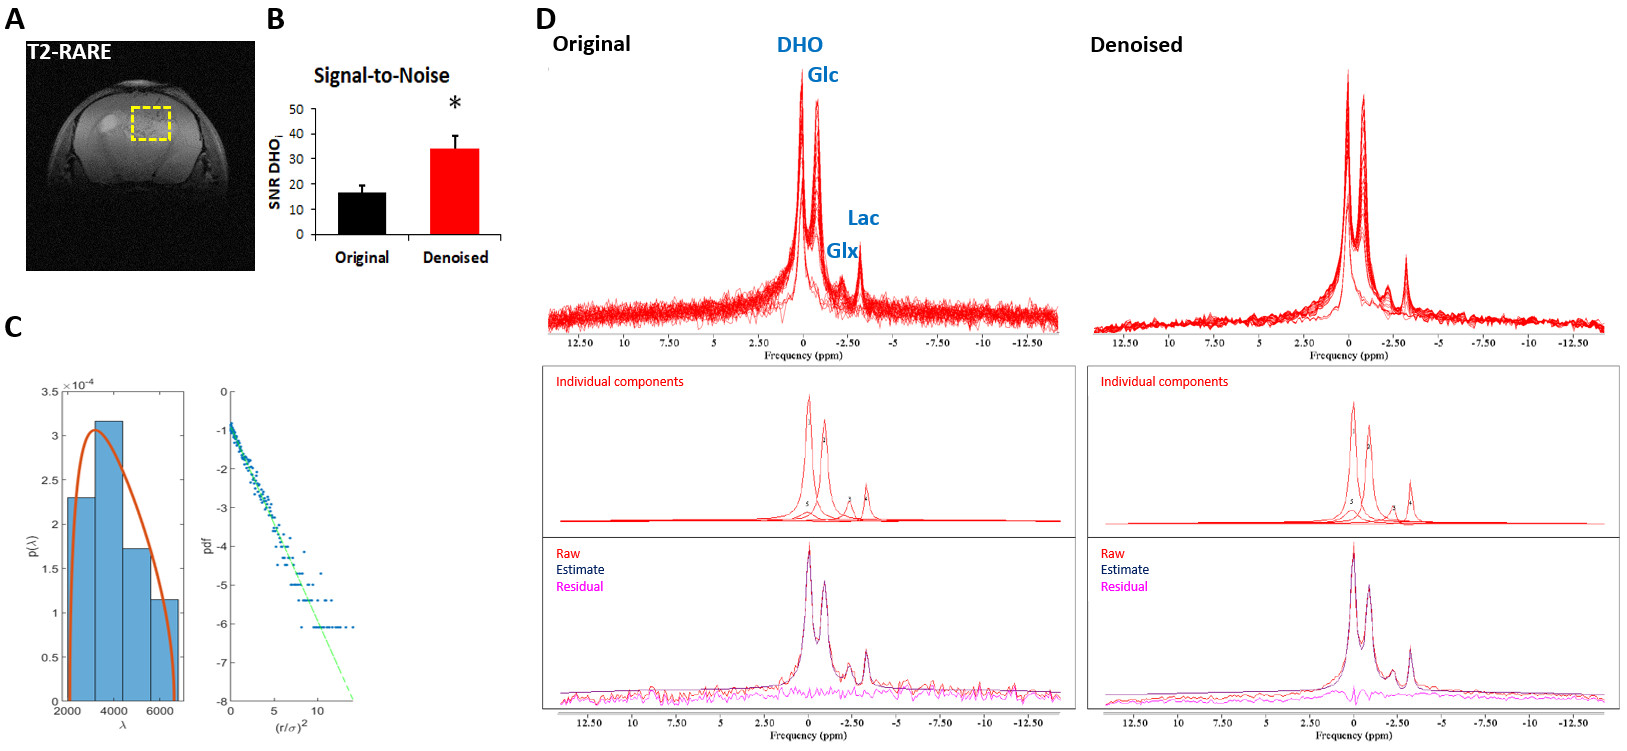
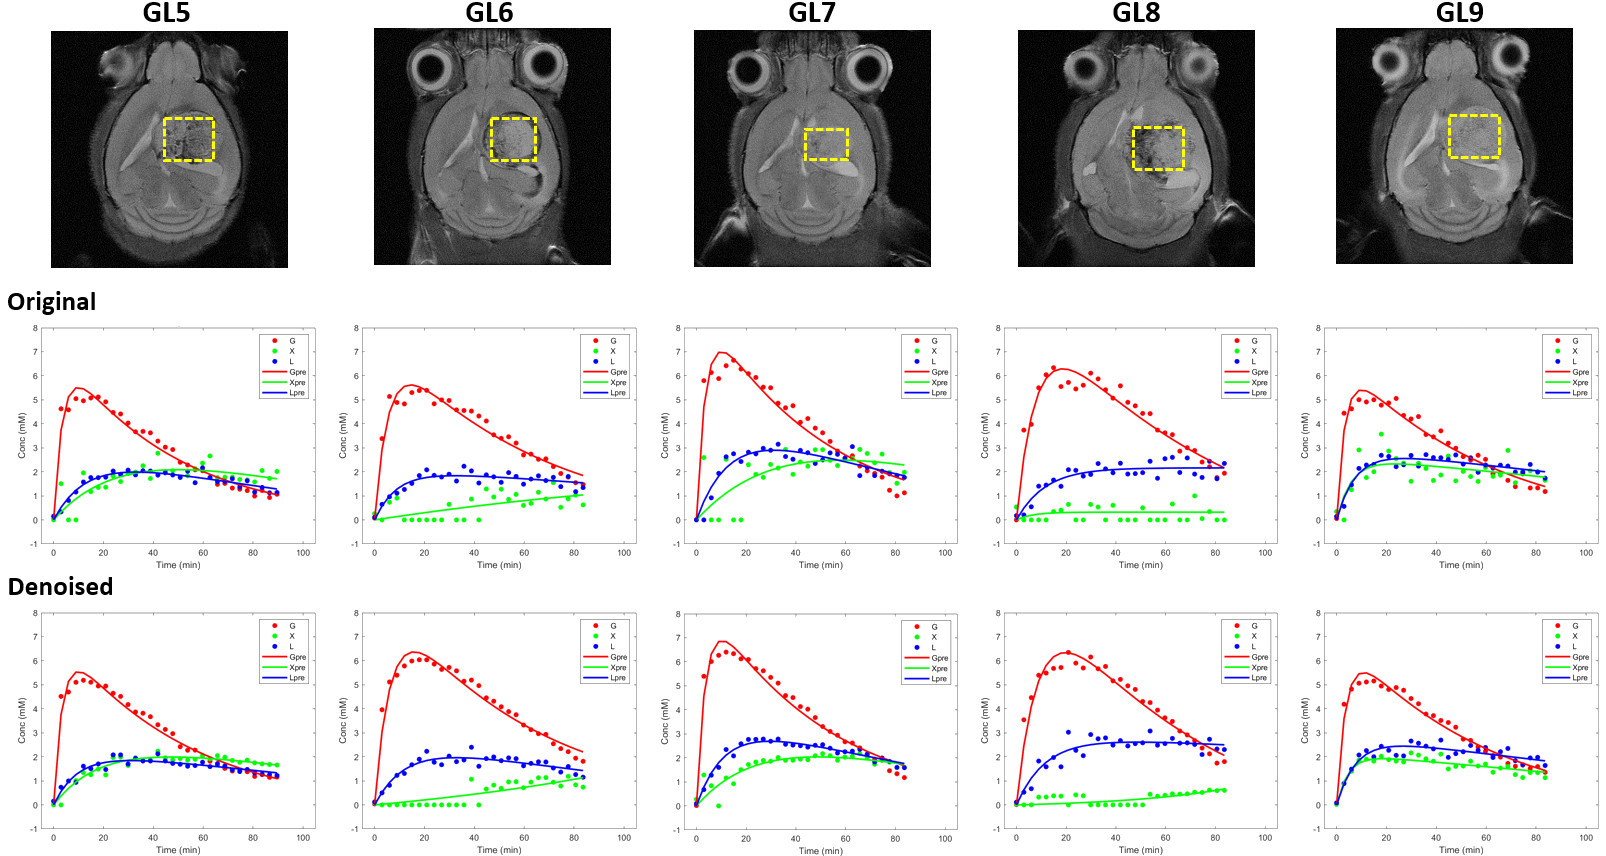
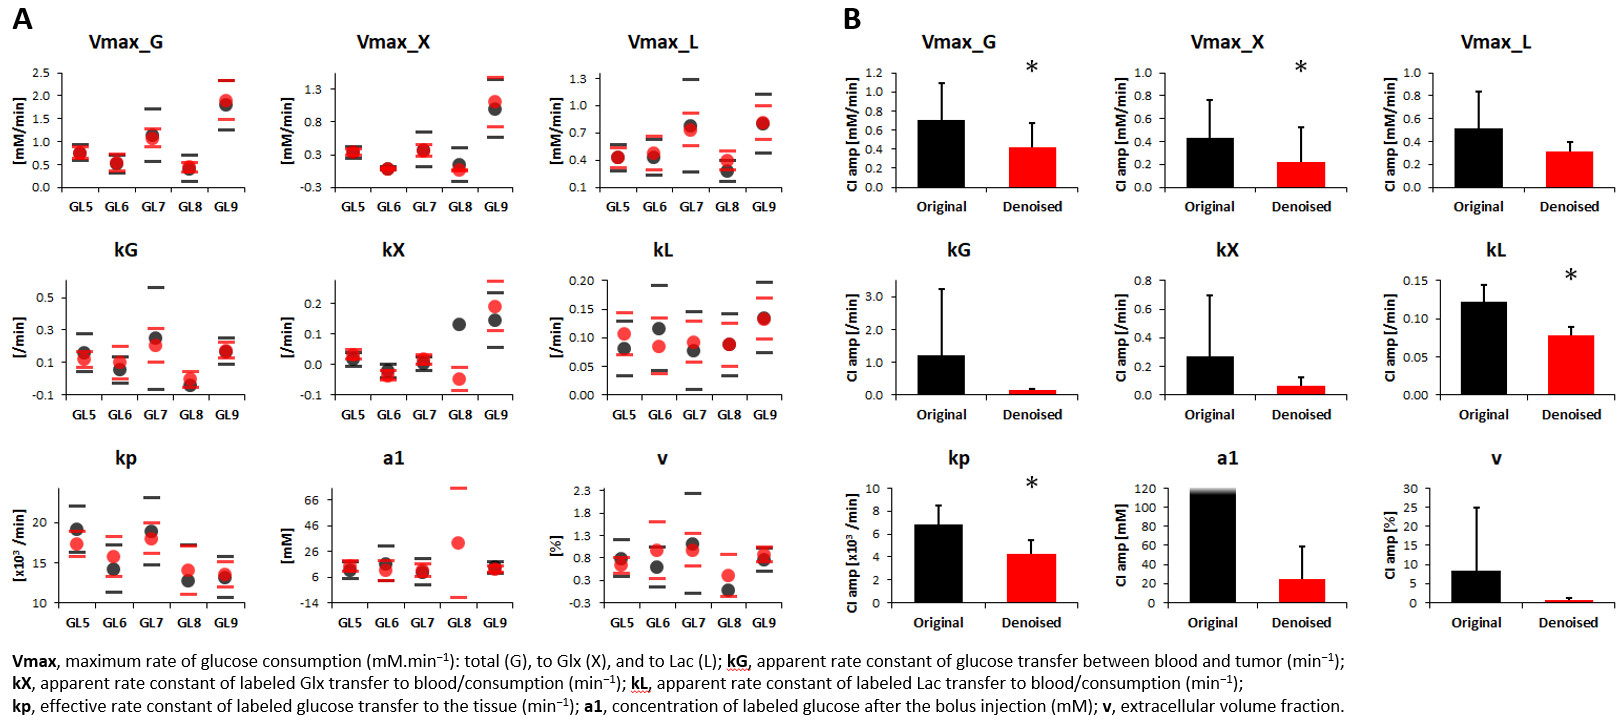
MRI/MRS data were processed in MATLAB® R2018b, ImageJ 1.53a, and jMRUI 6.0b. For each animal, the tumor region was manually delineated from T2w 1H-MRI data and pixel intensities from each slice normalized to a reference region (ROI in cortex, from contra-lateral hemisphere). Pixel distributions for each tumor were analyzed for skewness, kurtosis, and inter-quartile range (IQR). DGE 2H-MRS were averaged to 3 min temporal resolution, denoised with Marchenko–Pastur PCA [7], and analyzed by individual peak fitting using AMARES, with a basis set for DHO (0 ppm) and 2H-labelled: glucose (Glc, -0.95 ppm), glutamine-glutamate (Glx, -2.4 ppm), and lactate (Lac, -3.45 ppm). Original and denoised spectra (SNRDHOi>3) were quantified using DHO natural abundance as reference (DHOi, 13.88 mM), and metabolite concentrations (CRLB<50%) corrected for T1 and labeling-loss effects, according to the values reported by de Feyter et al [8] and de Graaf et al [9], respectively. Finally, ‘Glc->Glx+Lac’ time-course changes were fitted using a modified version of the ‘Glc->Lac’ model reported by Kreis et al [10], to estimate several kinetic parameters including the maximum rate of Glc consumption for Glx and Lac synthesis (Vmax_X and Vmax_L, respectively) and their confidence intervals (CI).
RESULTS
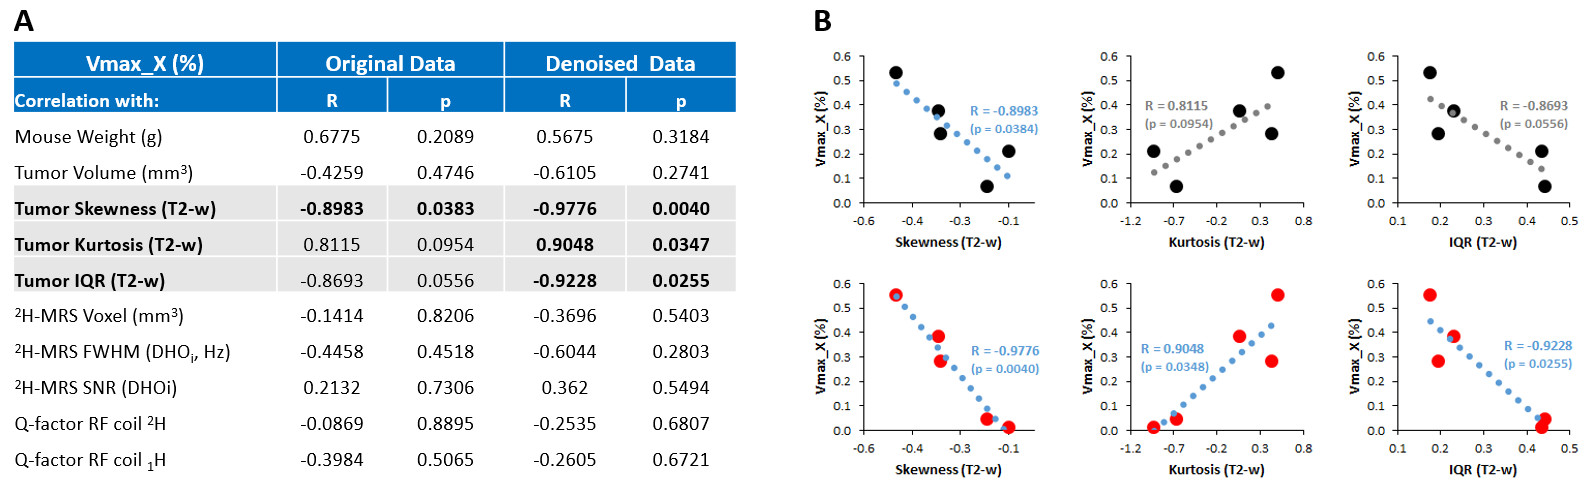
GL261 gliomas (GL5-9) demonstrated heterogeneity based on T2w 1H-MRI contrast, analyzed by pixel intensity distributions (Fig 1). DGE 2H-MRS revealed glucose turnover to lactate (glycolysis) and glutamate-glutamine (oxidation), which was easier to detect and monitor with MP-PCA denoising – significant 2-fold increase in SNRDHOi (Fig 2). Glucose, lactate and glutamate-glutamine time-course changes were modeled with good fitting performance in each tumor, and MP-PCA denoising improved the time-course detection of glutamate-glutamine without altering its kinetics (Fig 3). Accordingly, MP-PCA denoising improved the fitting precision, with estimated parameters always within the original CI range (Fig 4A) and overall decrease of their amplitudes (Fig 4B), e.g. significant 2-fold decrease in the CI of Vmax_X. The relative maximum rate of Glc consumption for Glx synthesis (Vmax_X/Vmax_G) varied across different gliomas and correlated with T2w pixel distribution metrics, more significant upon MP-PCA denoising (Fig 5).DISCUSSION
GL261 gliomas demonstrate heterogeneity in their microenvironment as detected in GBM patients, shown here by T2w 1H-MRI and DGE 2H-MRS. The latter revealed differences in glycolytic and glucose oxidation rates across different tumors, which could be quantified with higher precision following MP-PCA denoising of the spectra. Glucose oxidation rates demonstrated correlation with T2w 1H-MRI metrics associated with heterogeneity, consistent e.g. with increasing hypoxia during glioma progression. We are currently validating these results on a larger animal cohort.CONCLUSION
Functional metabolic heterogeneity can be assessed in mouse glioma with DGE 2H-MRS. This methodology can potentially be extended to other cancer models, holding strong potential for improving non-invasive cancer phenotyping and/or assessment of early therapeutic response.Acknowledgements
This work was developed with support from the vivarium of the Champalimaud Centre for the Unknown, a research infrastructure of CONGENTO co-financed by Lisboa Regional Operational Programme (Lisboa2020), under the PORTUGAL 2020 Partnership Agreement, through the European Regional Development Fund (ERDF) and Fundação para a Ciência e Tecnologia (Portugal), under the project LISBOA-01-0145-FEDER-022170. Funding Support: Champalimaud Foundation; H2020-MSCA-IF-2018, ref. 844776.References
1. Vander Heiden et al. Science. 2009; 324: 1029-33.
2. Gatenby and Gillies. Nat Rev Cancer. 2004; 4: 891-9.
3. Mashimo et al. Cell. 2014; 159: 603-14.
4. Tardito et al. Nat Cell Biol. 2015; 17: 1556-68.
5. Simões et al. Proc ISMRM 2020: 475.
6. Simões et al. NMR Biomed. 2008; 21: 251-64,
7. Veraart et al. Magn Reason Med. 2016; 76: 1582-93.
8. de Feyter et al. Sci Adv. 2018; 4: eaat7314.
9. de Graaf et al. Proc ISMRM 2020: 1959.
10. Kreis et al. Radiology. 2019; 294: 289-96
Figures