3717
Simultaneous 3D 1H-MRSI and PET Imaging Associates Neurometabolism with Beta-amyloid Aggregation in Alzheimer's Disease
Jialin Hu1, Miao Zhang2, Yaoyu Zhang1, Rong Guo3,4, Yudu Li3,4, Yibo Zhao3,4, Ziyu Meng1, Biao Li2, Jun Liu5, Binyin Li5, Jie Luo1, Chao Ma6, Georges El Fakhri6, Zhi-Pei Liang3,4, and Yao Li1
1School of Biomedical Engineering, Shanghai Jiao Tong University, Shanghai, China, 2Department of Nuclear Medicine, Ruijin Hospital, Shanghai Jiao Tong University School of Medicine, Shanghai, China, 3Beckman Institute for Advanced Science and Technology, University of Illinois at Urbana-Champaign, Urbana, IL, United States, 4Department of Electrical and Computer Engineering, University of Illinois at Urbana-Champaign, Urbana, IL, United States, 5Department of Neurology and Institute of Neurology, Ruijin Hospital, Shanghai Jiao Tong University School of Medicine, Shanghai, China, 6Gordon Center for Medical Imaging, Massachusetts General Hospital, Harvard Medical School, Boston, MA, United States
1School of Biomedical Engineering, Shanghai Jiao Tong University, Shanghai, China, 2Department of Nuclear Medicine, Ruijin Hospital, Shanghai Jiao Tong University School of Medicine, Shanghai, China, 3Beckman Institute for Advanced Science and Technology, University of Illinois at Urbana-Champaign, Urbana, IL, United States, 4Department of Electrical and Computer Engineering, University of Illinois at Urbana-Champaign, Urbana, IL, United States, 5Department of Neurology and Institute of Neurology, Ruijin Hospital, Shanghai Jiao Tong University School of Medicine, Shanghai, China, 6Gordon Center for Medical Imaging, Massachusetts General Hospital, Harvard Medical School, Boston, MA, United States
Synopsis
Beta-amyloid (Aβ) aggregation and neurometabolic changes are biomarkers for Alzheimer’s disease (AD) at early stage. But their underlying relationship in association with AD pathology is still not fully understood. In this study, we simultaneously acquired 3D high-resolution MRSI using SPICE and 18F-AV45-PET images on a PET-MR scanner. Concurrent changes in neurometabolite concentrations and Aβ deposition in healthy control, mild cognitive impairment, and AD groups were compared. An increase in myo-inositol and a decrease in N-acetylaspartate were found as dementia became more severe. Our findings may lay a foundation for further investigation of AD pathogenesis using multimodal metabolic imaging.
Introduction
Beta-amyloid (Aβ) aggregation measured by PET and neurometabolic changes measured by Magnetic Resonance Spectroscopy (MRS) have been used as pathological biomarkers for Alzheimer’s disease (AD) at early stage.1,2 For example, reduction in N-acetylaspartate (NAA), increase in myo-inositol (mI) and increase in Aβ plaques were closely related with disease progression in AD.3,4 However, the underlying relationship between these neurometabolites changes and Aβ aggregation associated with AD is still not fully understood. Magnetic resonance spectroscopic imaging (MRSI) has long been recognized as a potentially powerful tool for noninvasive neurometabolic imaging, but most existing MRSI studies in AD were performed using single-slice MRSI or single-voxel MRS techniques with low spatial resolution. Moreover, the concomitant Aβ and neurometabolic changes in AD have not been investigated yet due to the lack of imaging technology. In this study, we performed simultaneous 3D high-resolution 1H-MRSI and 18F-AV45-PET imaging on a PET-MR scanner. Neurometabolic mapping at 2.0 x 3.0 x 3.0 mm3 nominal resolution was achieved using the latest SPICE (SPectroscopic Imaging by exploiting spatiospectral CorrElation) sequence.5,6 Concurrent neurometabolites and Aβ deposition changes across healthy control (HC), mild cognitive impairment (MCI), and AD groups were compared both globally and locally. Their relationships with cognitive decline in AD patients were also investigated.Method
There were 26 healthy controls, 22 MCI patients and 35 AD patients recruited for this study. The PET/MRI scans were performed on a whole-body simulatenous PET/MR system (Biograph mMR; Siemens, Germany) with IRB approved by Ruijin Hospital, Shanghai, China. The MR scan protocols included 3D MRSI acquired by the SPICE sequence (2.0 × 3.0 × 3.0 mm3, FOV = 240 × 240 × 72 mm3, TR/TE = 160/1.6 ms) and 3D MPRAGE imaging (0.5 × 0.5 × 1.0 mm3, FOV = 256 × 256 × 192 mm3, TR/TE = 1900/2.44 ms). A union-of-subspaces model incorporating pre-learned spectral basis functions was performed for reconstruction of the spatiospectral functions of metabolites.5-7 Spectral quantification was done using an improved LCmodel-based algorithm that incorporated both spatial and spectral priors.6,8 Regions of interest (ROIs) masks were created based on T1-weighted images using FreeSurfer v6.0.The PET data were acquired at 45~60 mins post a bolus injection of 18F-AV-45 at 3.7 MBq/kg (matrix size = 344 × 344, voxel size = 2.1 × 2.1 × 2.0 mm3, 127 slices). After correction of random events, dead time, scattering and attenuation, the reconstructed PET images were preprocessed using a 2mm full width half-maximum (FWHM) Gaussian filter. Regional PET data were quantified using the standard uptake value ratio (SUVR) as the ratio to whole cerebellum mean uptake. The global cortical SUVR was calculated as the average of a composite region containing frontal, anterior/posterior cingulate, lateral parietal and lateral temporal regions. We used the global SUVR cutoff of 1.11 to determine amyloid positivity and classified the subjects into the Aβ+ and Aβ- groups.9 MRSI and processed PET images of each subject were coregistered to the T1-weighted image using affine transformation.
Between-group comparisons of metabolic levels were performed using univariate general linear models, adjusting for age, sex, education and regional volume. Partial regression analysis was used to evaluate the associations between neurometabolic levels and MMSE scores, controlled for age, sex and education level. All the statistical analyses were conducted using SPSS.
Results and Discussion
Figure 1 shows some representative neurometabolic maps and PET images of subjects from the HC, MCI, and AD groups, respectively. A global NAA reduction and mI elevation could be observed along with increased dementia severity. Figure 2 shows a comparison of spatially resolved spectra obtained from posterior cingulate cortex (PCC)/precuneus and hippocampus area from subjects of the HC, MCI and AD groups. Neurometabolic concentrations were compared among different groups in Figure 3. For the global composite regions with Aβ deposition, the mI/Cr concentration in AD patients was significantly higher than that in MCI patients, which was higher than that in the HC group. The NAA/Cr significantly reduced in AD group, but was not different between the MCI and HC groups. The changes of neurometabolic signals in PCC/precuneus followed a similar pattern to the global comparison. A different pattern of signal change was observed in hippocampus as a low Aβ deposition area.10 The comparisons of different metabolic biomarkers between the Aβ- and Aβ+ groups were shown in Fig. 4. There was a globally elevated mI/Cr and a reduced NAA/Cr in the Aβ+ group compared with the Aβ- group, consistent with previous literature.11 In hippocampus, mI/Cr elevated in the Aβ+ group although SUVR showed no differences between the two groups. Moreover, NAA/Cr was correlated with MMSE score in MCI/AD patients as shown in Fig. 5, indicating its contribution to patients’ cognitive deficits.Conclusion
This study demonstrated simultaneous 3D high-resolution MRSI and PET imaging and investigated association of neurometabolism with Aβ aggregation in HC, MCI and AD patients. An increase in mI and a decrease in NAA were found as dementia severity increased. Our findings may lay a foundation for further investigation of AD pathogenesis using multimodal metabolic imaging.Acknowledgements
Y. L. is funded by National Science Foundation of China (No.61671292 and 81871083) and Shanghai Jiao Tong University Scientific and Technological Innovation Funds (2019QYA12).References
- Jack CR Jr, Knopman DS, Jagust WJ, et al. Hypothetical model of dynamic biomarkers of the Alzheimer's pathological cascade. Lancet Neurol. 2010;9(1):119-128.
- Murray ME, Przybelski SA, Lesnick TG, et al. Early Alzheimer's disease neuropathology detected by proton MR spectroscopy. J Neurosci. 2014;34(49):16247-16255.
- Kantarci K, Jack CR Jr, Xu YC, et al. Regional metabolic patterns in mild cognitive impairment and Alzheimer's disease: A 1H MRS study. Neurology. 2000;55(2):210-217.
- Kantarci K, Knopman DS, Dickson DW, et al. Alzheimer disease: postmortem neuropathologic correlates of antemortem 1H MR spectroscopy metabolite measurements. Radiology. 2008;248(1):210-220.
- Lam F, Liang ZP. A subspace approach to high-resolution spectroscopic imaging. Magn Reson Med. 2014;71(4):1349-1357.
- Ma C, Lam F, Johnson CL, et al. Removal of nuisance signals from limited and sparse 1H MRSI data using a union-of-subspaces model. Magn Reson Med. 2016;75(2):488-497.
- Lam F, Ma C, Clifford B, et al. High-resolution 1H-MRSI of the brain using SPICE: data acquisition and image reconstruction. Magn Reson Med. 2016;76(4):1059-1070.
- Li Y, Lam F, Clifford B, et al. A subspace approach to spectral quantification for MR spectroscopic imaging. IEEE Trans Biomed Eng. 2017;64(10):2486-2489.
- Mattsson N, Insel PS, Donohue M, et al. Independent information from cerebrospinal fluid amyloid-β and florbetapir imaging in Alzheimer's disease. Brain. 2015;138(Pt 3):772-783.
- Braak H, Braak E. Neuropathological stageing of Alzheimer-related changes. Acta Neuropathol. 1991;82(4):239-259.
- Sheikh-Bahaei N, Sajjadi SA, Manavaki R, et al. Positron emission tomography-guided magnetic resonance spectroscopy in Alzheimer disease. Ann Neurol. 2018;83(4):771-778.
Figures
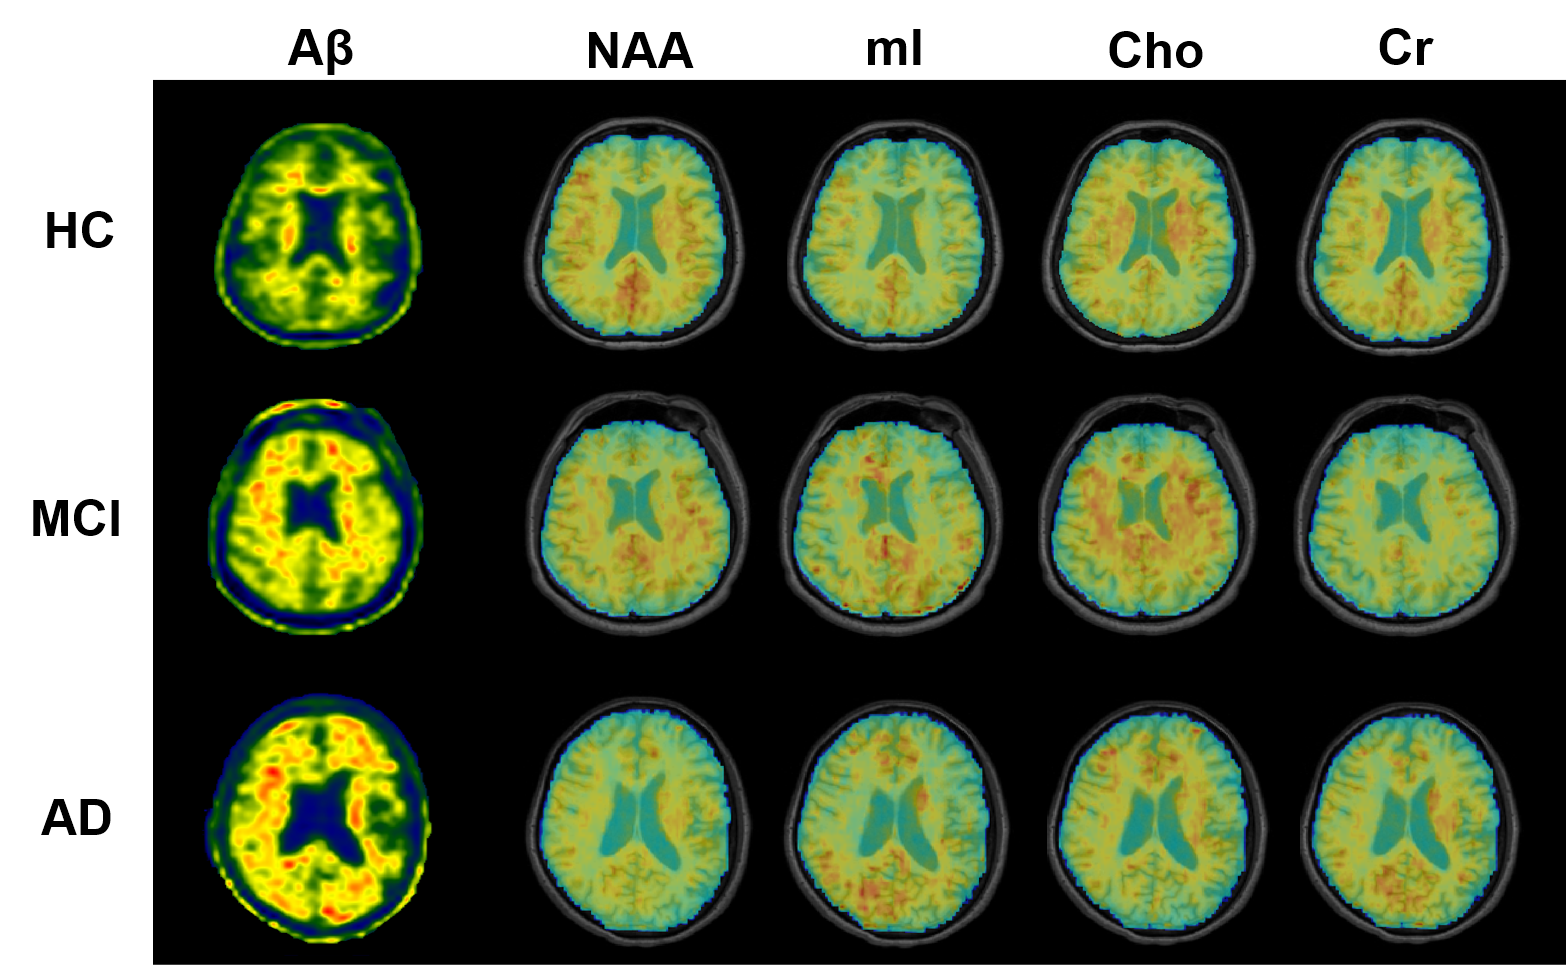
Figure 1. High-resolution metabolite maps and
PET images simultaneously acquired from a HC, an MCI patient, and an AD patient,
respectively. A global NAA reduction and mI elevation were observed with the
increased dementia severity.
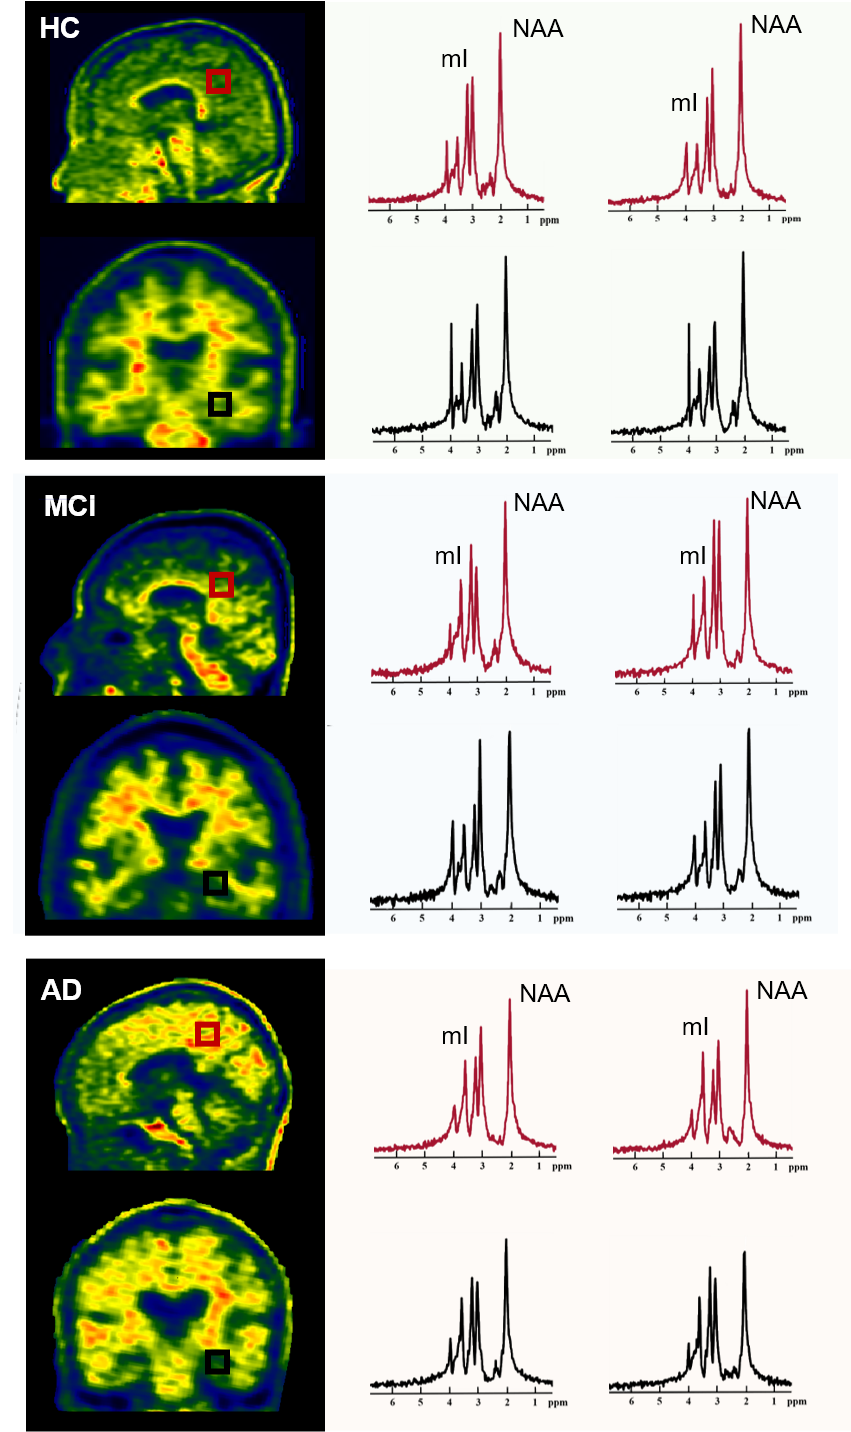
Figure 2. Spatially resolved spectra from the
posterior cingulate cortex (PCC)/precuneus and hippocampus of a HC, an MCI and an
AD patient. Note the reduction in NAA and increase in mI in both areas with
disease severity increased.
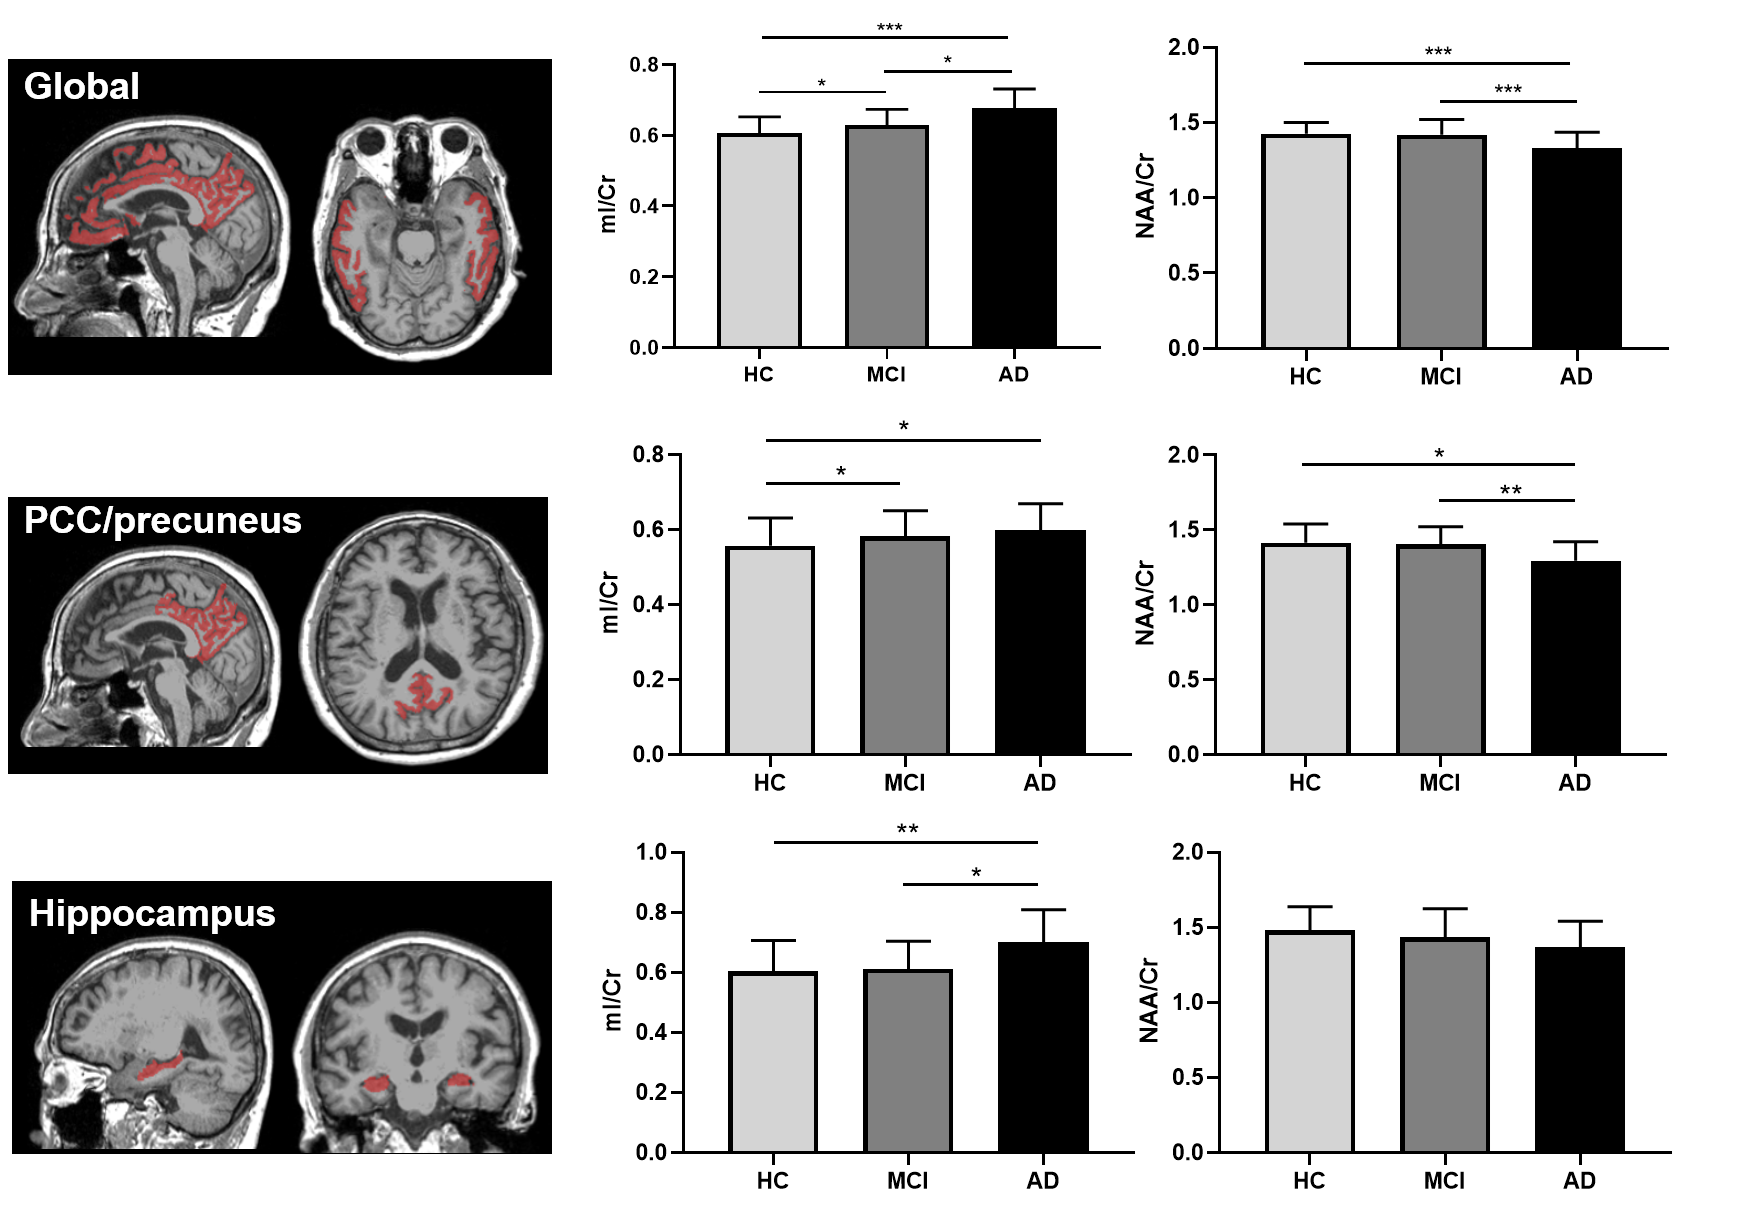
Figure 3. Comparisons of neurometabolic concentrations
among the HC, MCI, and AD groups for the global composite regions (top),
PCC/precuneus (middle) and hippocampus (bottom). * p<0.05, ** p<0.01, ***
p<0.001.
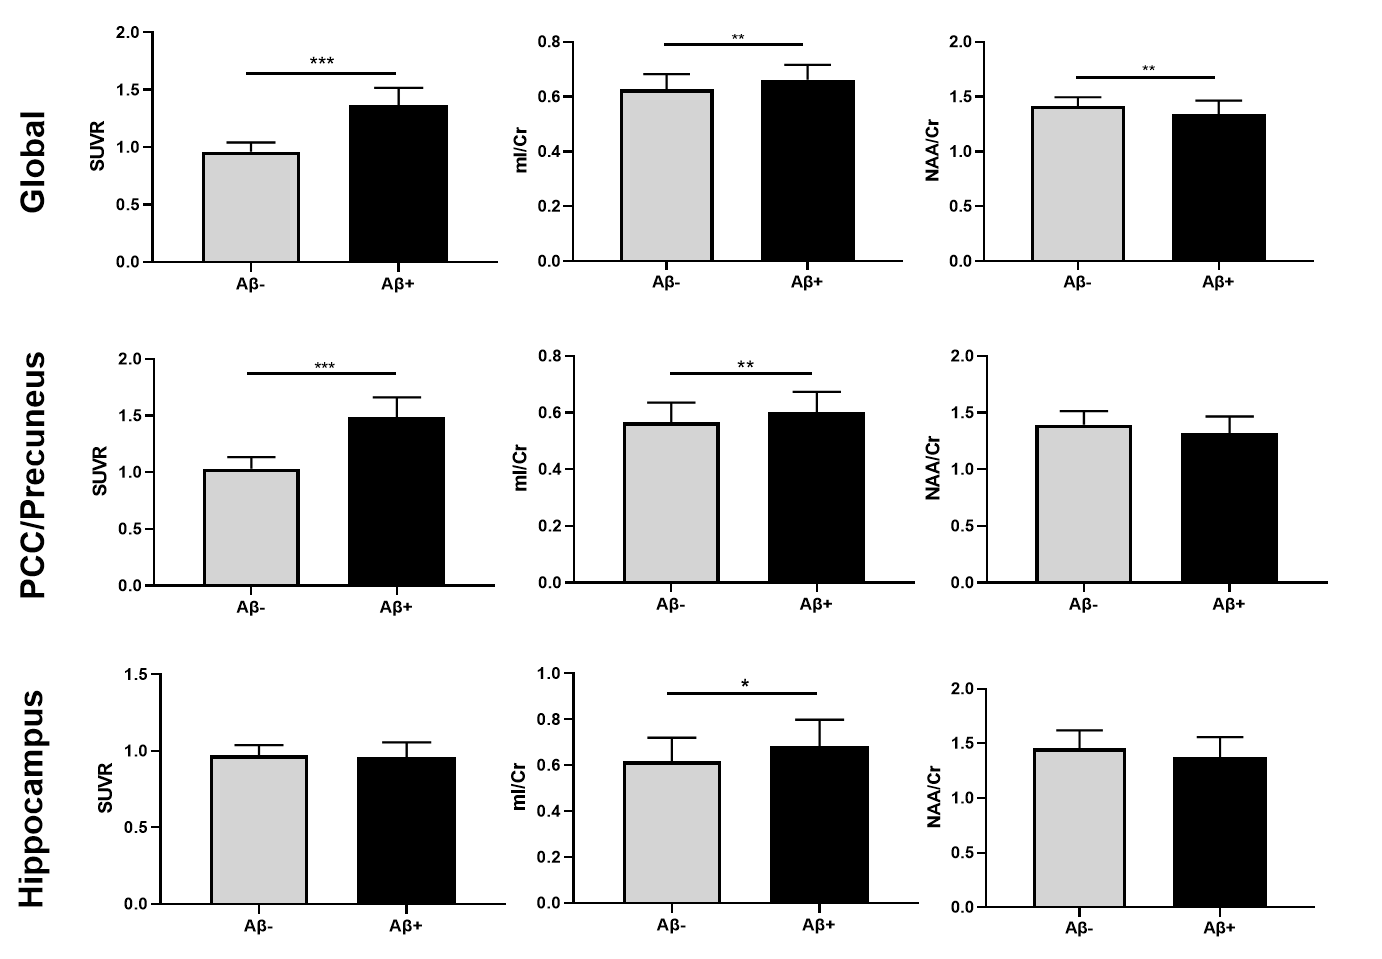
Figure 4. Comparison of global and regional neurometabolic
levels and SUVR values between Aβ- and
Aβ+ groups. *
p<0.05, ** p<0.01, *** p<0.001.
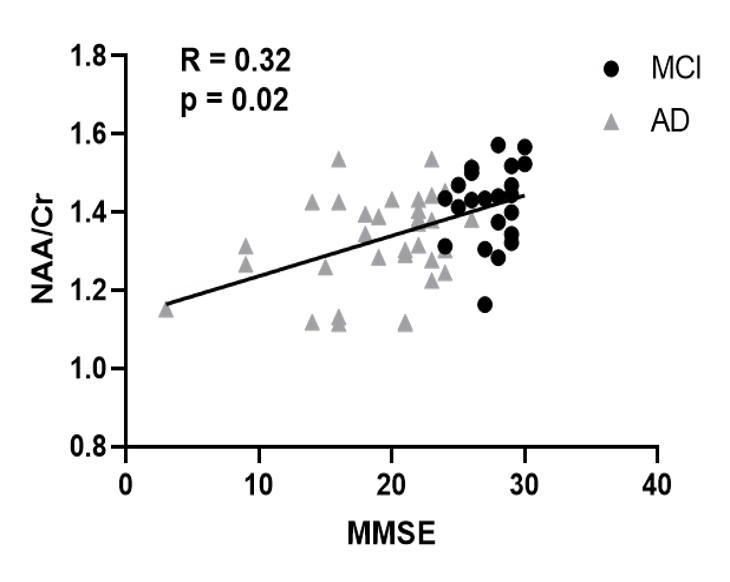
Figure 5. NAA/Cr was positively
correlated with MMSE scores in MCI and AD patients.