3716
Dopamine Directional Circuits Detected by Metabolic Effective Connectivity and Granger Causality using Integrated PET/MR1Nuclear Medicine, Tangdu Hospital of Air Force Medical University, Xi'an, China
Synopsis
The commonly used granger causality (GC) and the metabolic effective connection (MEC) methods, had been compared the efficacy in identifying the directional pathways of dopamine system on the base of simultaneous PET/MR data. GC and MEC both identified different directed pathways of dopamine system. GC identified more long pathways from cortex to nucleus than MEC, while MEC did better job in identifying subtentorial pathways. The unidirectional frontostriatal pathways identified by MEC was more inline with existing researches than GC, the latter reported bidirectional interaction pathways there. MEC was recommended in region-wise research when PET/MR is available.
Introduction
The human brain has long been recognized as a continuously communicating directional network. Granger causality (GC)1,2 and Metabolic effective connectivity3 (MEC)analysis are two commonly used approach to reveal the directionality between brain regions. Dopamine (DA) system plays a crucial role in motivation and reinforcement4, and has been well researched. Integrated positron emission tomography and magnetic resonance (PET/MR) technology brings opportunity to explore the “efficacy” of GC and MEC with the simultaneously collected multimodal data. Here, “efficacy” refers to the sensitivity in identifying the directed pathways and the consistency of the results with priori knowledge. This study applied the two methods to DA system then compared the efficacy, based on the PET/MR data.Methods
Datasets were downloaded from OpenNeuro (Monash rs-PET/MR dataset5), which involved 27 healthy young participants (age range 18-23, 21 female). All participants undertook PET/MR scan to obtain simultaneous rs-fMRI data and 18F-fluorodeoxyglucose (FDG) PET data, as well as T1 3D MPRAGE data. The first 10min block of rs-fMRI blood oxygen level dependent (BOLD) data and corresponding PET data were preprocessed and analyzed. CONN6 toolbox was used for BOLD data preprocessing, with ordinary pipelines. Ten regions of interest (ROI) were generated by FSL7 built-in Harvard-Oxford probability atlas (thresholded at 50%) and Talairach Daemon atlas, including the bilateral thalamus, nucleus accumbens (NAc), caudate, orbital frontal cortex (OFC) and substantia nigra (SN). Functional Connectivity (FC) matrices were calculated and group-level pathways were tested by One-sample t-test. The pair-wise GC indices (GCI) of each ROI were calculated along each FC pathway. The lag of vector auto-regression model was 2 according to Bayesian information criterion1. Static PET image was preprocessed using FSL, including registration and normalization to MNI152 space. After preprocessing, standard uptake value ratio (SUVr) maps were converted (cerebellum gray matter as the reference region). Both of SUVr maps and BOLD data were used to calculate MEC3. One-sample Wilcoxon signed rank test and t-test were conducted separately for GCI matrices and MEC matrices. The significance level for within group statistical analysis was set at p<0.05, false discovery rate (FDR) corrected.Results
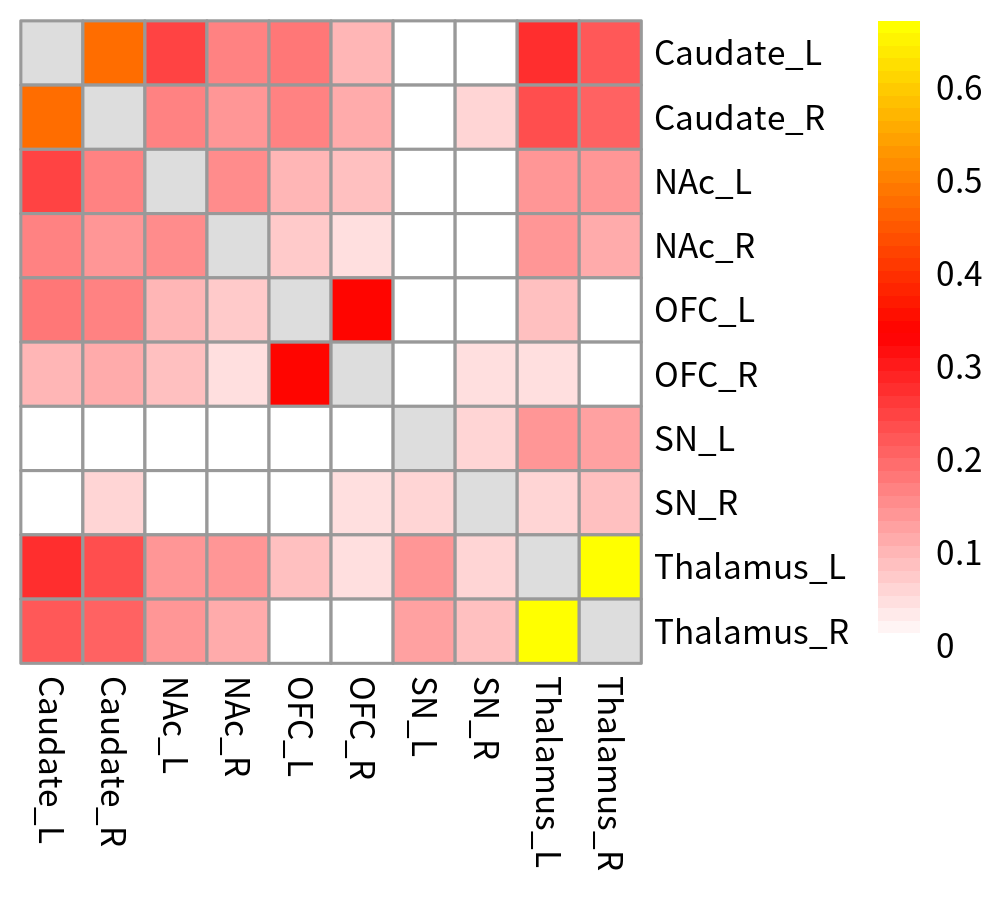
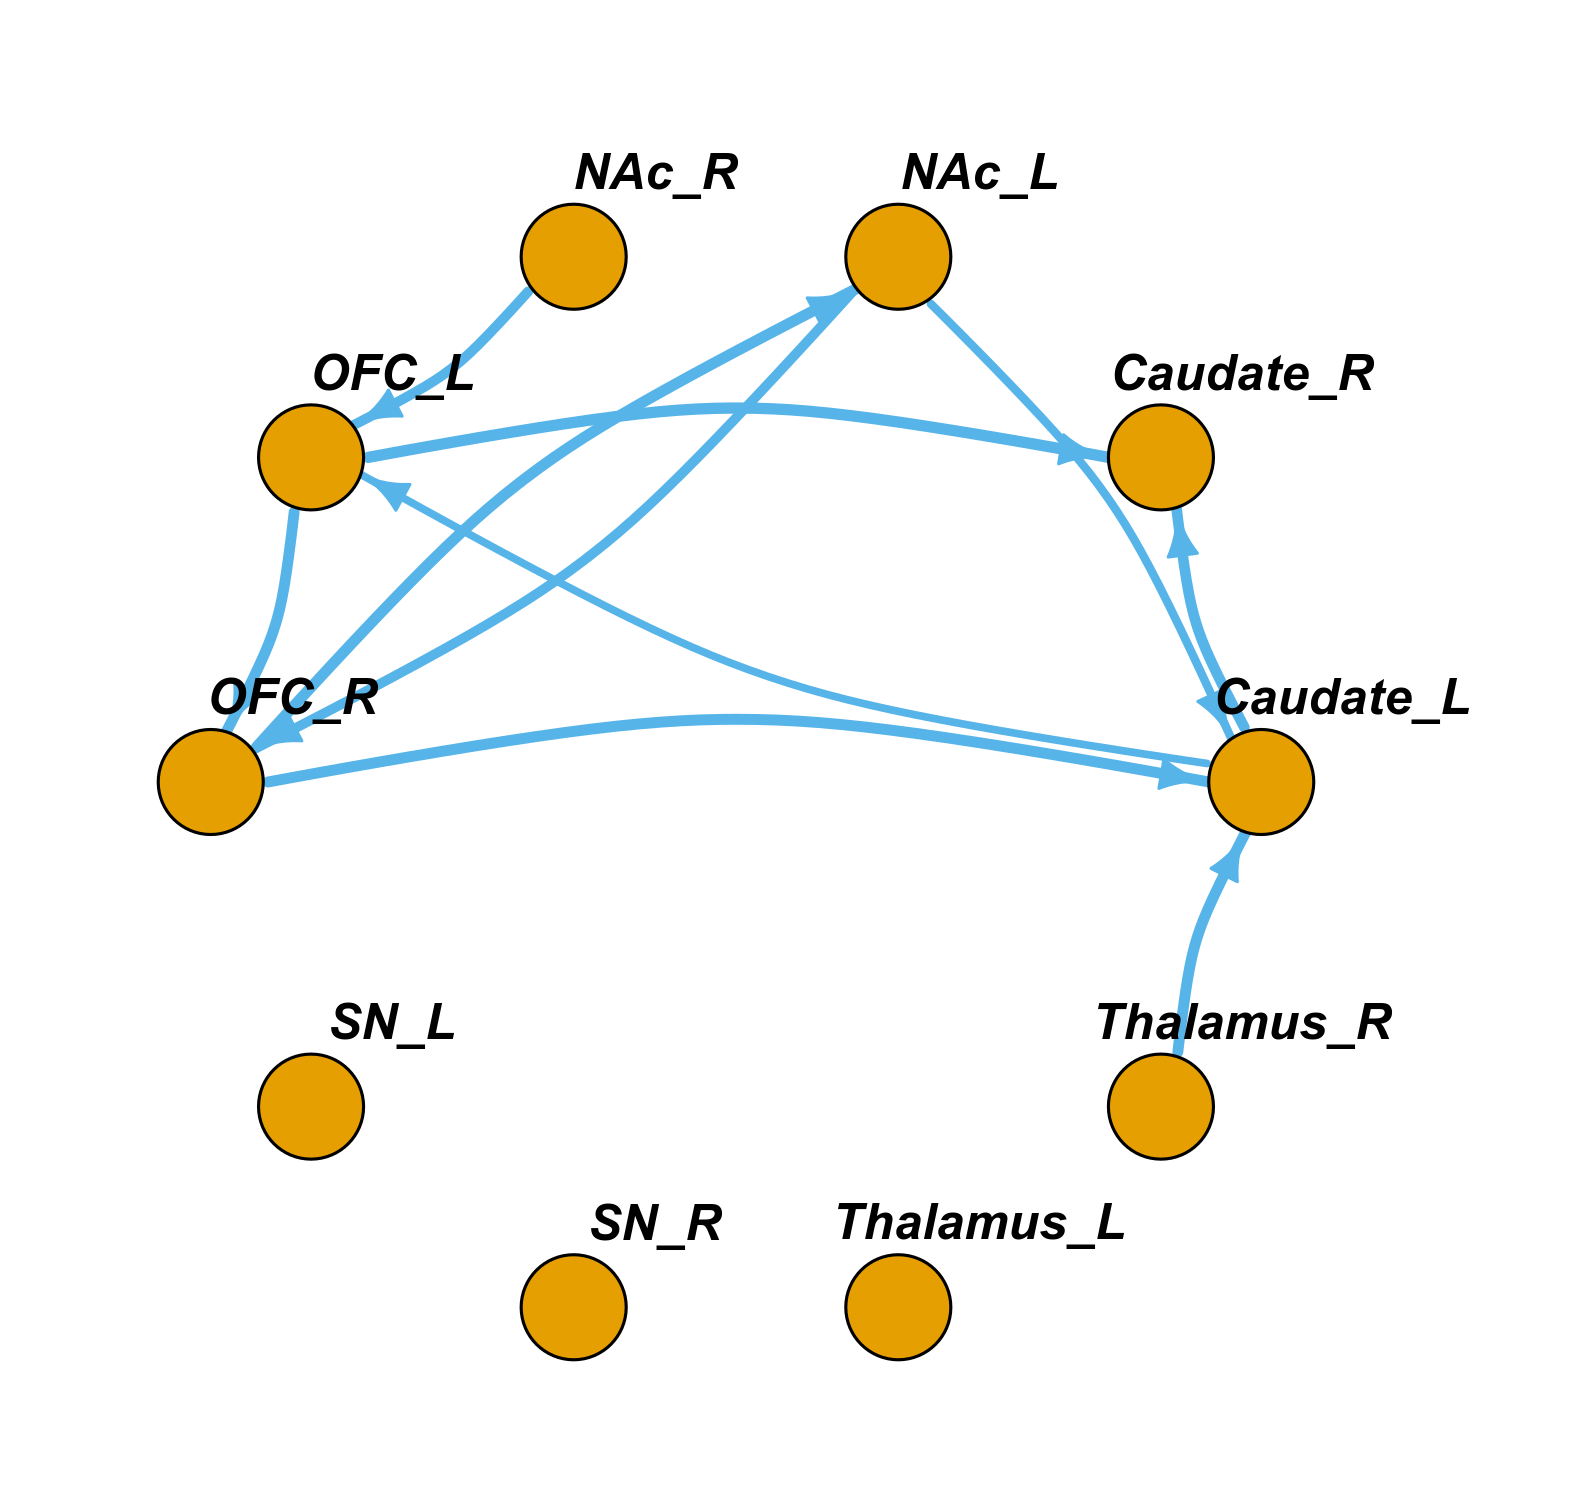
For FC, there were significant pairwise connections between bilateral OFC, caudate, NAc and thalamus ROIs, while the connections between right thalamus and bilateral OFC were not significant. For connections involved SN ROIs, only the connections between bilateral SN and thalamus, between right SN and left SN, right OFC and right caudate were significant. (Fig1, One-sample t-test, p<0.05, fdr corrected)For significant GC directed connections, there was a bidirectional connection between left NAc and right OFC. Besides, 8 significant unidirectional connections were: from right thalamus to left caudate, from left caudate to right caudate, from left caudate to left OFC, from left NAc to left caudate, from right OFC to left caudate, from left OFC to right caudate, from right NAc to left OFC, and from left OFC to right OFC. (Fig2, One-sample Wilcoxon signed rank test, p<0.05, fdr corrected)
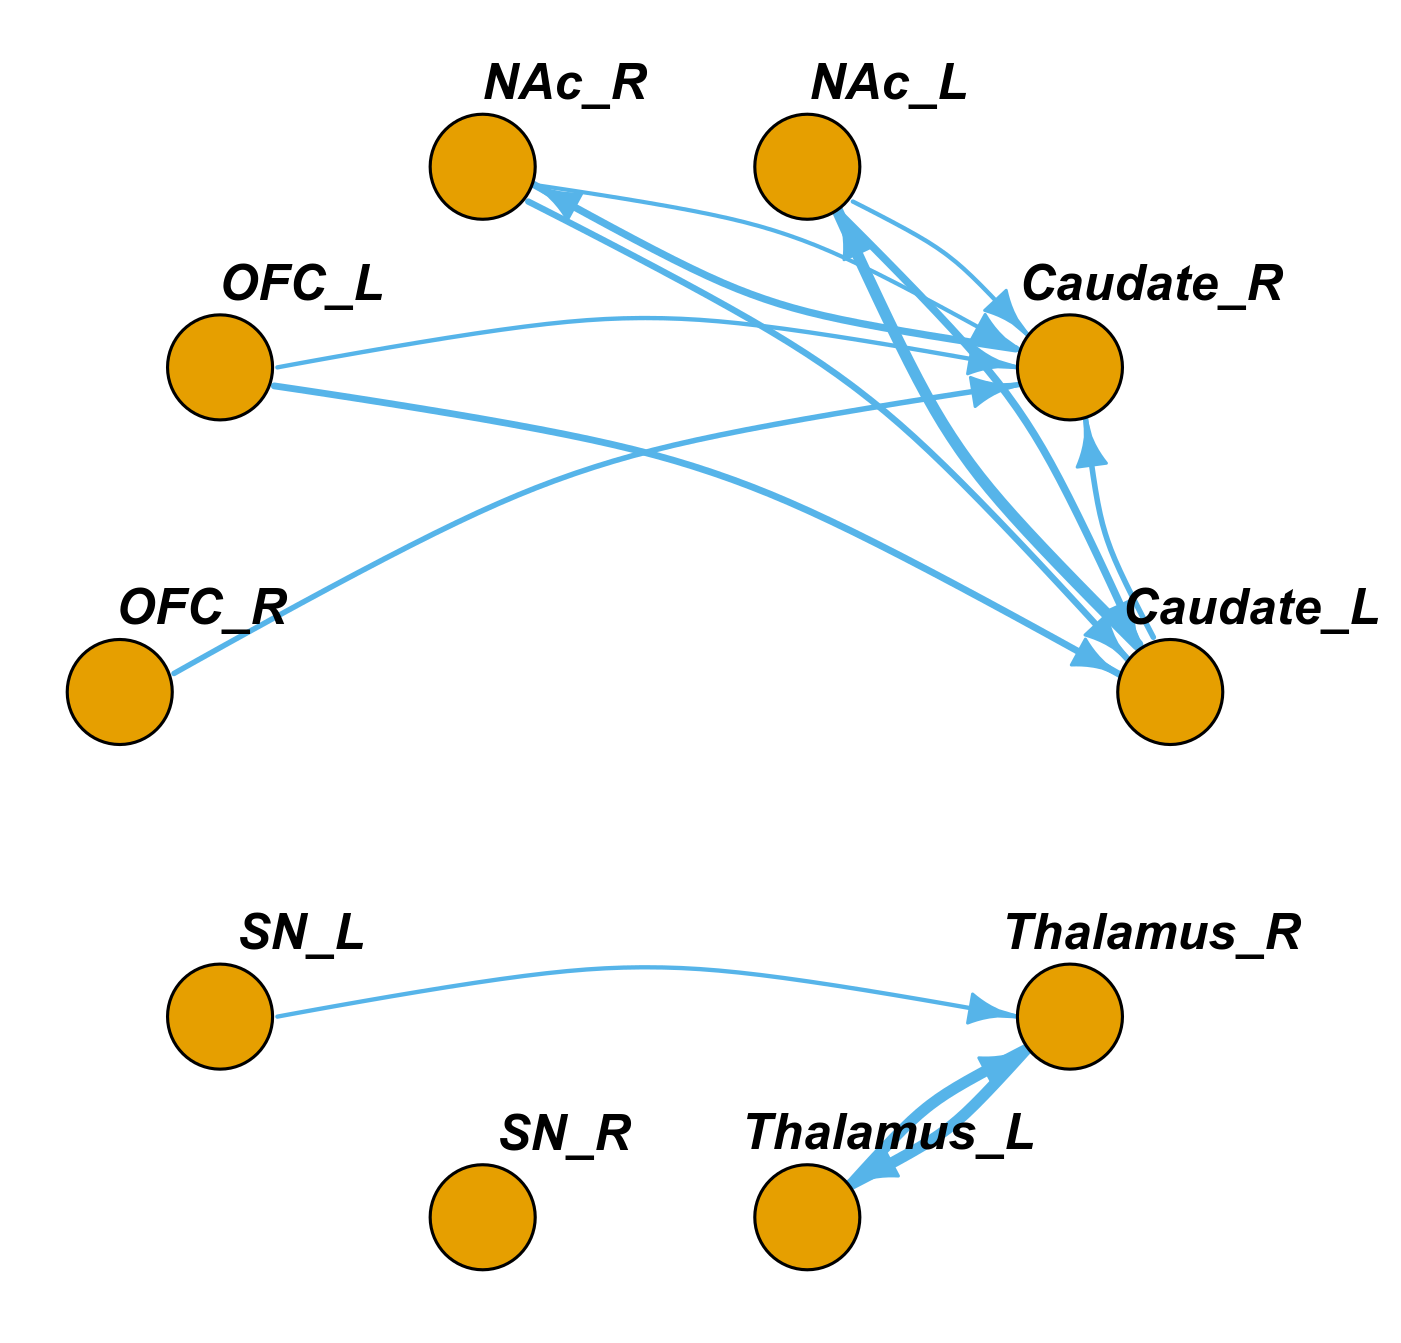
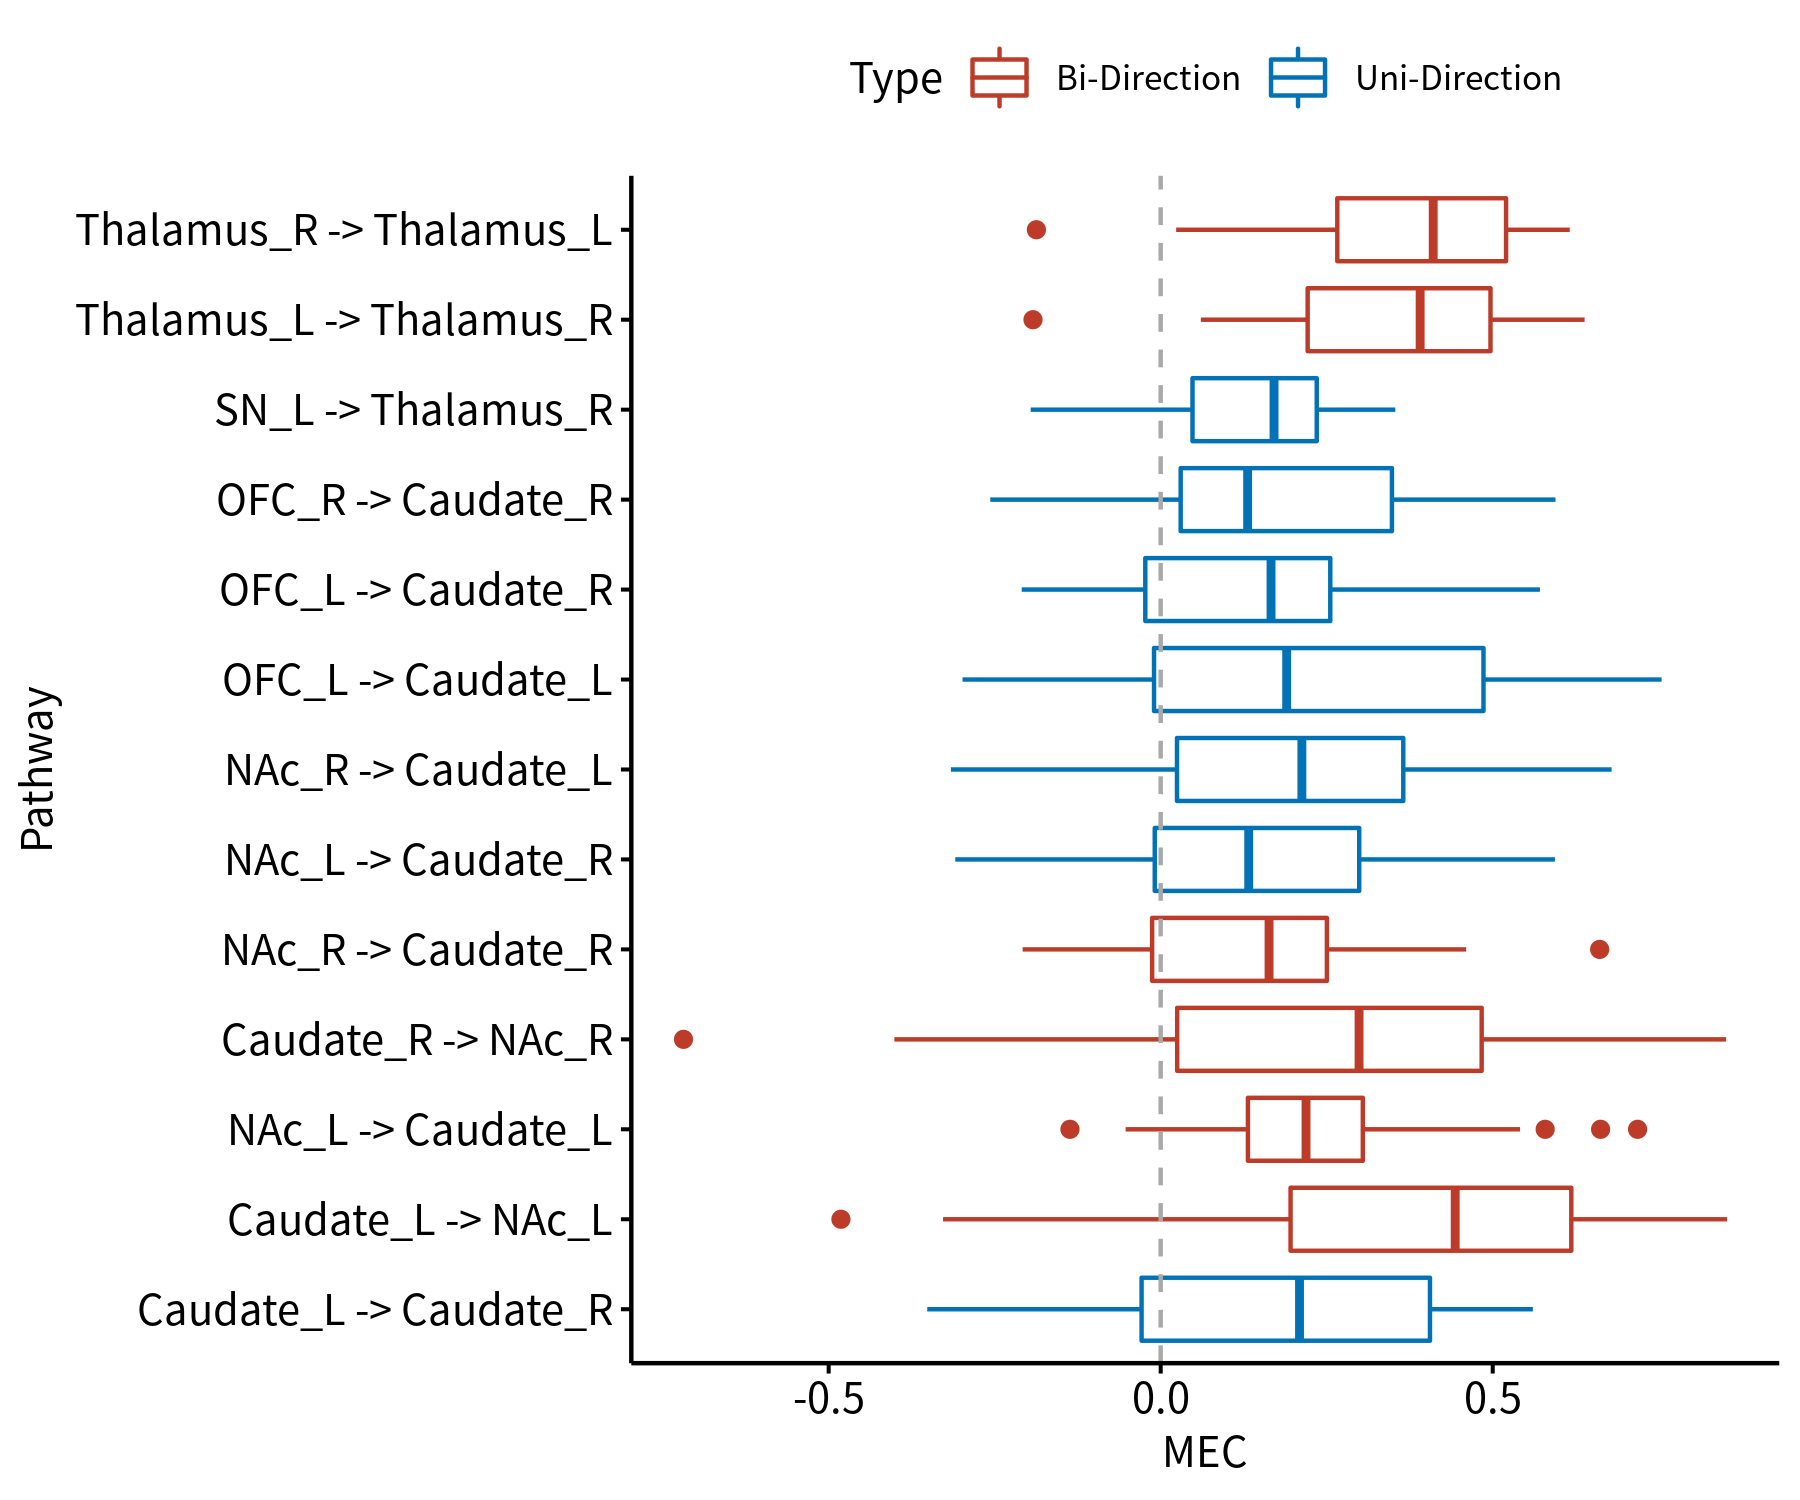
For MEC directed significant connections, there were 3 bidirectional connections: between bilateral thalamus, between left caudate and left NAc, and between right caudate and right NAc. There were 7 unidirectional connections existed: from left SN to right thalamus, from right OFC to right caudate, from left OFC to bilateral caudate, from right NAc to bilateral caudate, and from left caudate to right caudate. (Fig3 & Fig4, One-sample t-test, p<0.05, fdr corrected)
Discussion
GC and MEC identified directed pathways within DA system, with different patterns. 1) GC tends to identify long range connections from the cortex to subcortical nucleus better than MEC. 2) Unlike GC, MEC revealed a clear regulation by cortex to striatum. This is consistent with frontostriatal DA pathways in reward circuit, that OFC is the main source of afferent inputs to ventral stratum8. 3) Few connections were identified in subtentorial areas, GC in particular, the thalamus and SN were isolated from each other. MEC better identified the information interactions between bilateral thalamus, and the projection pathway from SN to thalamus. The reason for the different pathways and directions identified by GC and MEC may lay on their principle nature. GC relies on prediction, not necessarily mean “true causality”9. MEC, on the other hand, uses the principle of neuron synaptic energy consumption to infer the direction of the signal transfer3, which reveals results closer to real causality. Besides, BOLD signal quality of the subtentorial area is often poorer than other brain regions when scanning, GC relies on BOLD signal quality, get worse performance than MEC. MEC combined high quality FDG map to low quality BOLD, should get some compensations than unimodal BOLD calculations. MEC still have limitations, this method can only give ROI-wise inference, while GC can be applied to analysis from voxel-level to brain region-level. Lots of researches made improvements to classical GC, such as conditional GC and partial GC10. MEC methodology should get more attention and improvements in future.Conclusion
Further researches are still needed, our preliminary results showed that MEC is more reliable than GC when integrated PET/MR technology is available. MEC incorporates both metabolic and rs-fMRI data, gives more reasonable effective pathways than GC. The results given by both methods need to be interpreted with caution.Acknowledgements
No acknowledgement found.References
1. Zhang YE, Li Q, Wen X, et al. Granger causality reveals a dominant role of memory circuit in chronic opioid dependence. Addict Biol. 2017;22(4):1068-1080.
2. Seth AK, Barrett AB, Barnett L. Granger Causality Analysis in Neuroscience and Neuroimaging. J Neurosci. 2015;35(8):3293-3297.
3. Riedl V, Utz L, Castrillón G, et al. Metabolic connectivity mapping reveals effective connectivity in the resting human brain. Proc Natl Acad Sci. 2016;113(2):428-433.
4. Volkow ND, Wise RA, Baler R. The dopamine motive system: implications for drug and food addiction. Nat Rev Neurosci. 2017;18(12):741-752.
5. Jamadar SD, Ward PGD, Close TG, et al. Simultaneous BOLD-fMRI and constant infusion FDG-PET data of the resting human brain. Sci Data. 2020;7(1):363.
6. Whitfield-Gabrieli S, Nieto-Castanon A. Conn: a functional connectivity toolbox for correlated and anticorrelated brain networks. Brain Connect. 2012;2(3):125-141.
7. Jenkinson M, Beckmann CF, Behrens TEJ, Woolrich MW, Smith SM. FSL. NeuroImage. 2012;62(2):782-790.
8. Haber SN. Corticostriatal Circuitry. In: Pfaff DW, Volkow ND, eds. Neuroscience in the 21st Century. Springer New York; 2016:1-21.
9. Cekic S, Grandjean D, Renaud O. Time, frequency, and time-varying Granger-causality measures in neuroscience. Stat Med. 2018;37(11):1910-1931.
10. Wang X, Wang R, Li F, Lin Q, Zhao X, Hu Z. Large-Scale Granger Causal Brain Network based on Resting-State fMRI data. Neuroscience. 2020;425:169-180.
Figures