3715
Multimodal 1H-MRSI and 18F-FDG-PET in Temporal Lobe Epilepsy1School of Biomedical Engineering, Shanghai Jiao Tong University, Shanghai, China, 2Department of Nuclear Medicine, Ruijin Hospital, Shanghai Jiao Tong University School of Medicine, Shanghai, China, 3Department of Electrical and Computer Engineering, University of Illinois at Urbana Champaign, Urbana, IL, United States, 4Beckman Institute for Advanced Sciences and Technology, University of Illinois at Urbana Champaign, Urbana, IL, United States, 5Department of Neurosurgery, Ruijin Hospital, Shanghai Jiao Tong University School of Medicine, Shanghai, China
Synopsis
NAA decrease and FDG low uptake in cortical and subcortical regions of the limbic system are among the most common findings in temporal lobe epilepsy (TLE) patients. In addition, tissue susceptibility changes in the deep nuclei, myelin water fraction and NAA decrease in white matter bundles might offer complementary information for lateralization. We demonstrated the feasibility of simultaneous high-resolution 1H-MRSI (2.0 x 3.0 x 3.0 mm3), MWF, QSM, and 18F-FDG-PET and investigated potential of the multimodal information for detecting metabolic and microstructural changes in subcortical, cortical and white matter regions for TLE, with results consistent with literature for each modality.
Introduction
The most common form of drug-resistant epilepsies is the temporal lobe epilepsy (TLE). Accurate lateralization and localization of epileptogenic zone is critical for presurgical planning, which becomes particularly challenging when the patient has non-identifiable lesion in the routine MRI scan.1 MR spectroscopy, multiple advanced MR imaging modalities as well as FDG-PET have been recognized as potentially powerful imaging tools to detect and lateralize the structural and metabolic alterations, providing complementary information.2-4 For example, cortical and subcortical volume decrease, reduction in NAA, and low FDG uptakes (measured by PET) are among the most common findings of brain tissue alterations associated with epilepsy.3,4 In addition, white matter also plays an important role in the network disorder of epilepsy, which could be revealed by diffusion imaging5 and myelin imaging.6 Tissue magnetic susceptibility has also been reported with sensitivity to cortical damage in focal cortical dysplasia patients.7 In this study, with the multimodal imaging capability of SPICE (SPectroscopic Imaging by exploiting spatiospectral CorrElation) on a PET/MR scanner, we investigated the feasibility and potential of multimodal imaging for lateralization of both MR-positive and MR-negative TLE patients in cortical, subcortical, and white matter regions.Method
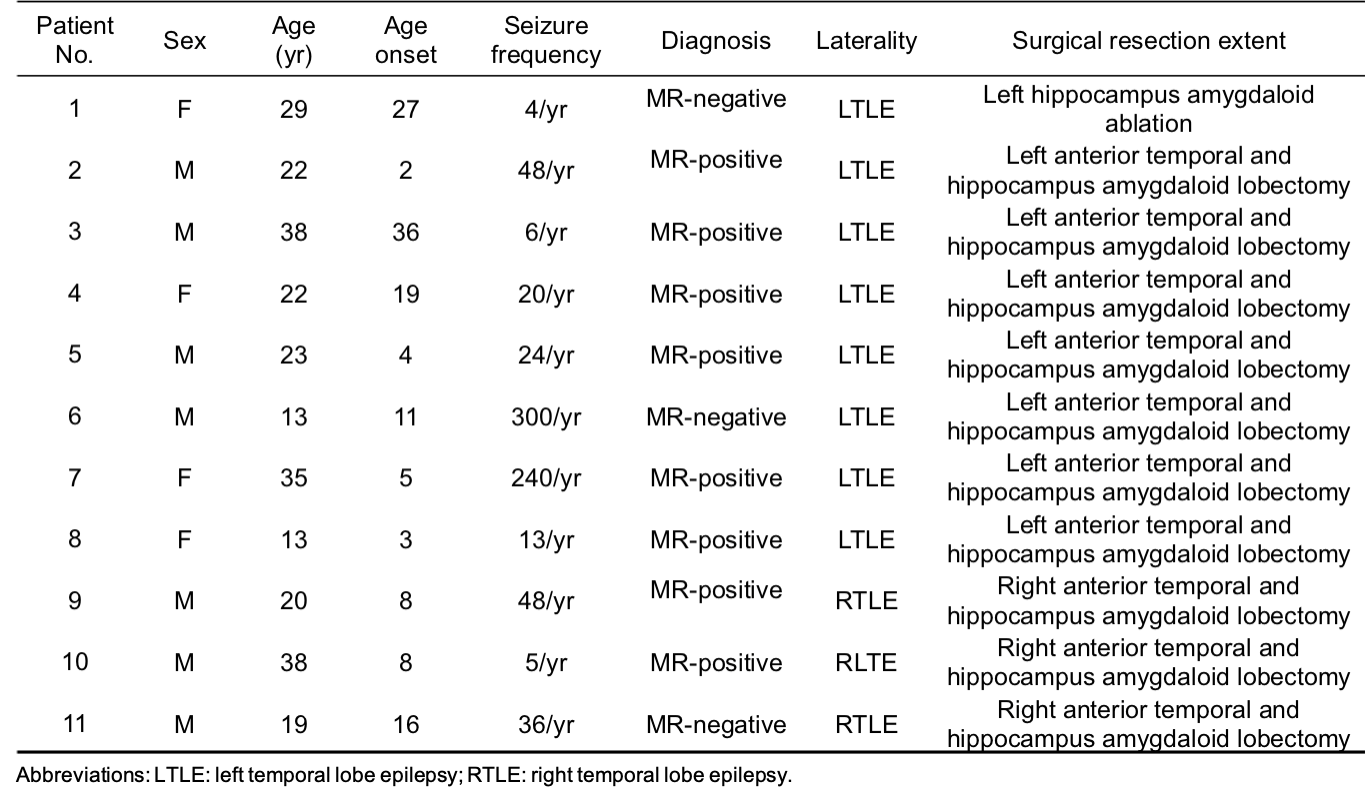
Data acquisition:In this IRB approved study, eleven drug-resistant TLE patients were recruited, with demographics listed in Table 1. In addition, fourteen age-matched healthy volunteers were recruited for MR scans and twenty-one for PET scans. Simultaneous PET/MR scans were performed on a PET/MR scanner (Biograph mMR; Siemens Healthcare, Erlangen, Germany) at Ruijin Hospital, Shanghai, China. PET images were obtained at 15 minutes post a bolus injection of 18F-FDG (mean dose of 3.7 MBq/kg, matrix size = 344 x 344, voxel size = 2.0 x 2.0 x 2.0 mm3, 127 slices). The MR experimental protocols included high-resolution MRSI scans using SPICE (2.0 x 3.0 x 3.0 mm3, FOV = 240 x 240 x 72 mm3, TR/TE = 160/1.6 ms, 7 minutes) and T1-weighted anatomical images using MPRAGE (1.0 x 1.0 x 1.0 mm3, TR/TE = 1900/2.44 ms, matrix size = 256 x 256, 192 slices). All patients had radiological readings and clinical diagnosis after video-SEEG monitoring.
Data processing and data analysis:
The FDG uptakes (SUVRs) were obtained using intensity normalization by the cerebellar scaling of PET images, and were coregistered to the T1w-MPRAGE space. Reconstruction of the spatiospectral functions of metabolites from the SPICE data was performed using a union-of-subspaces model, incorporating pre-learned spectral basis functions as described in previous publications.8-10 Spectral quantification was done using an improved LCModel-based algorithm that incorporated both spatial and spectral priors,11 which generated metabolite maps of NAA, Cho, Cr, and Ins. Quantitative susceptibility maps (QSM) and myelin water fraction (MWF) maps were both generated from the water signals reconstructed from the sparsely sampled data using a union-of-subspaces model. The QSM was calculated by solving the inverse dipole model.12,13 MWF estimation was done using an improved 3-pool model fitting algorithm that incorporated pre-learned parameter distributions and low-rank signal structures.14 Gray matter volumes were extracted from the T1w-MPRAGE, which were subsequently normalized with the intracranial volume. Cortical and subcortical regions were extracted from T1w-MPRAGE using FreeSurfer (v7.0 package), while white matter bundles were extracted based on the Eve atlas15 using ANTs (Advanced Normalization Tools). Wilcoxon matched-pairs signed rank test was used to compare structural and metabolic changes in the ipsilateral and contralateral brain regions across all patients.
Results and Discussion
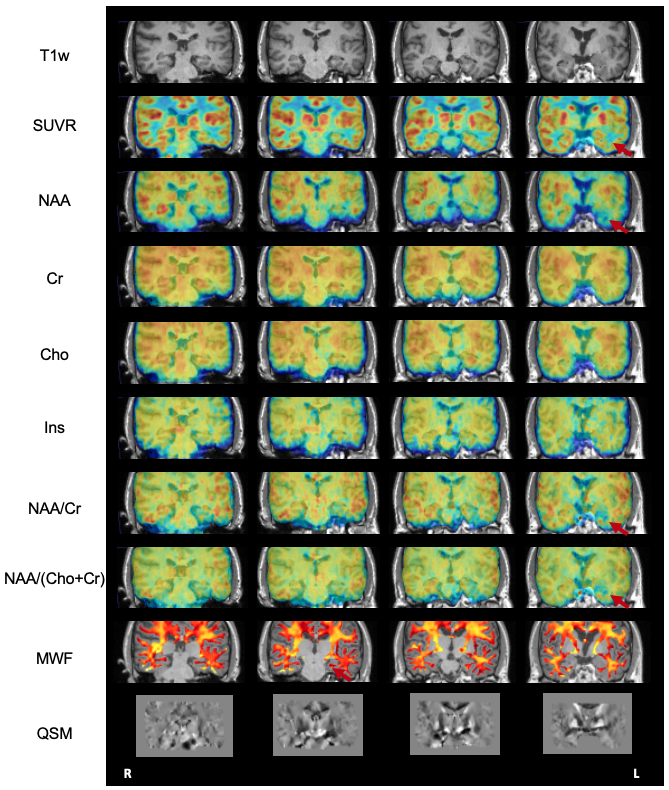
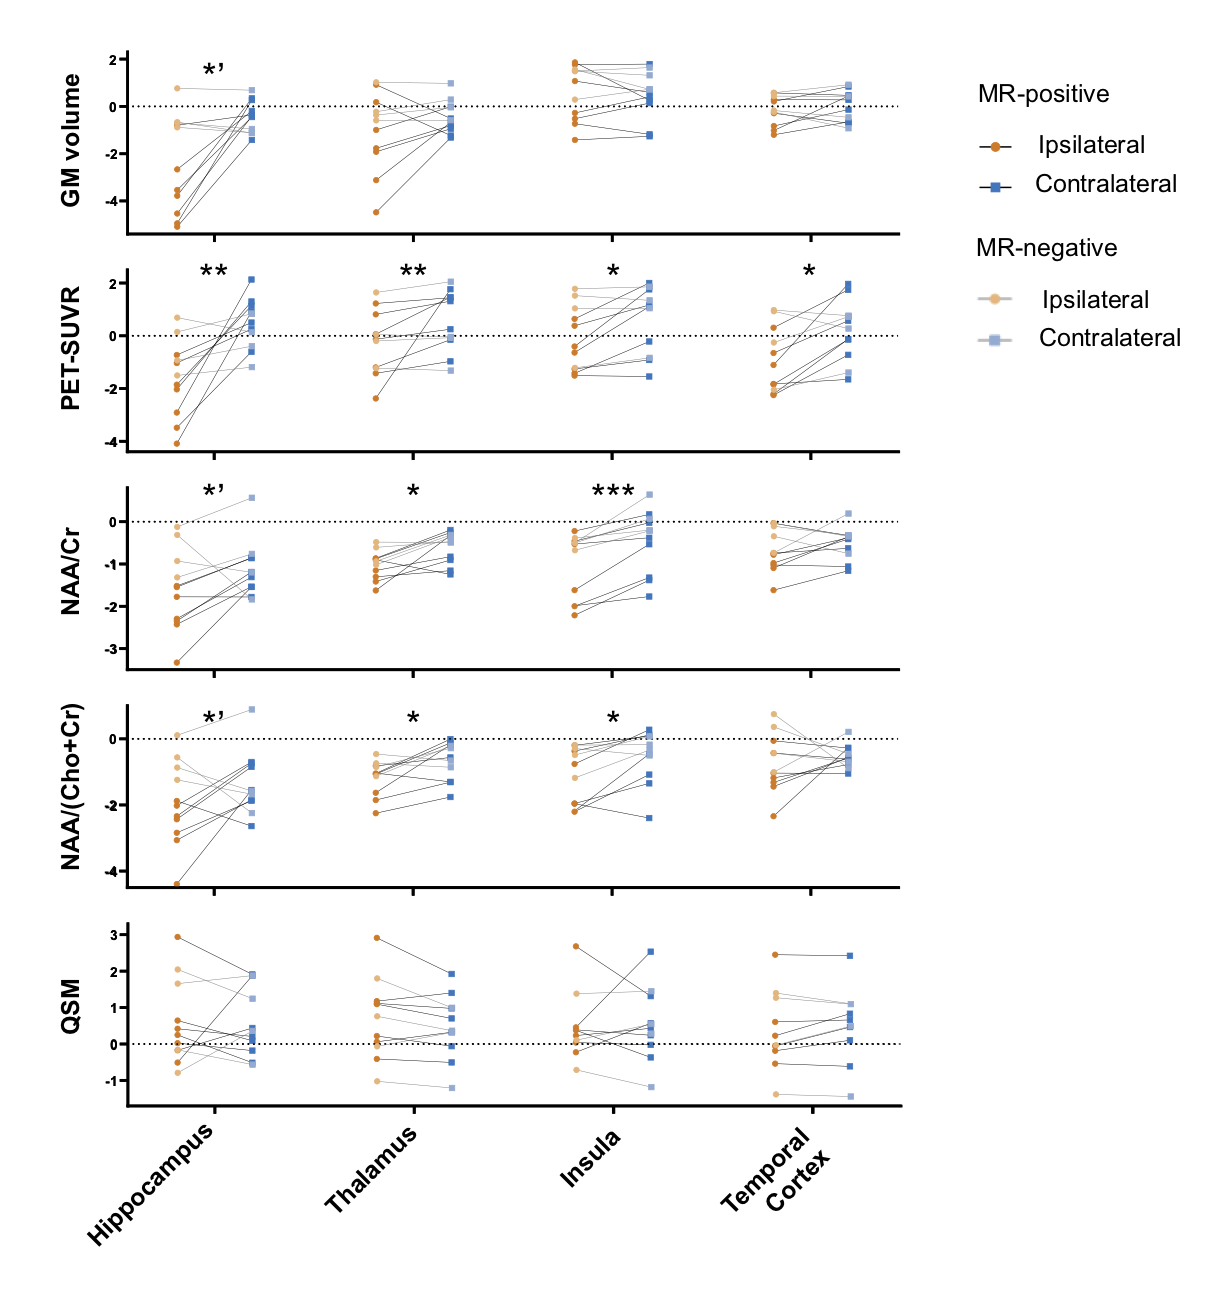
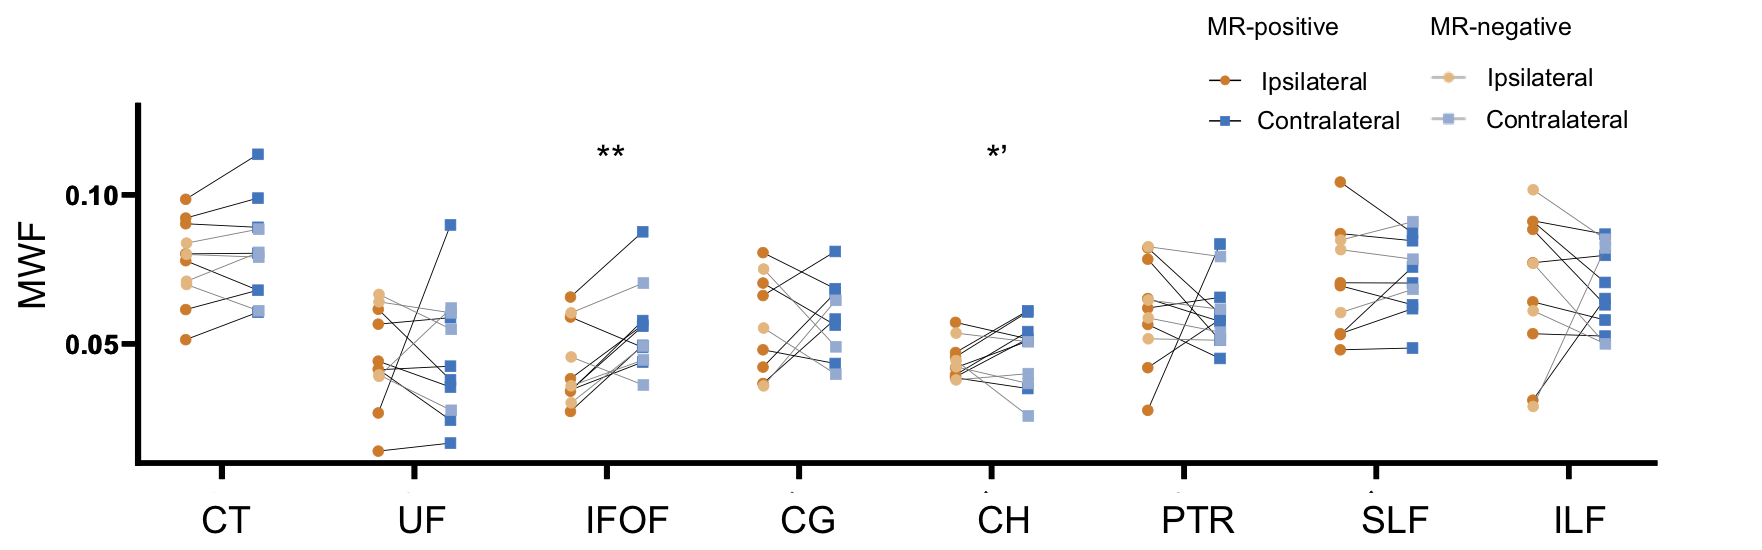
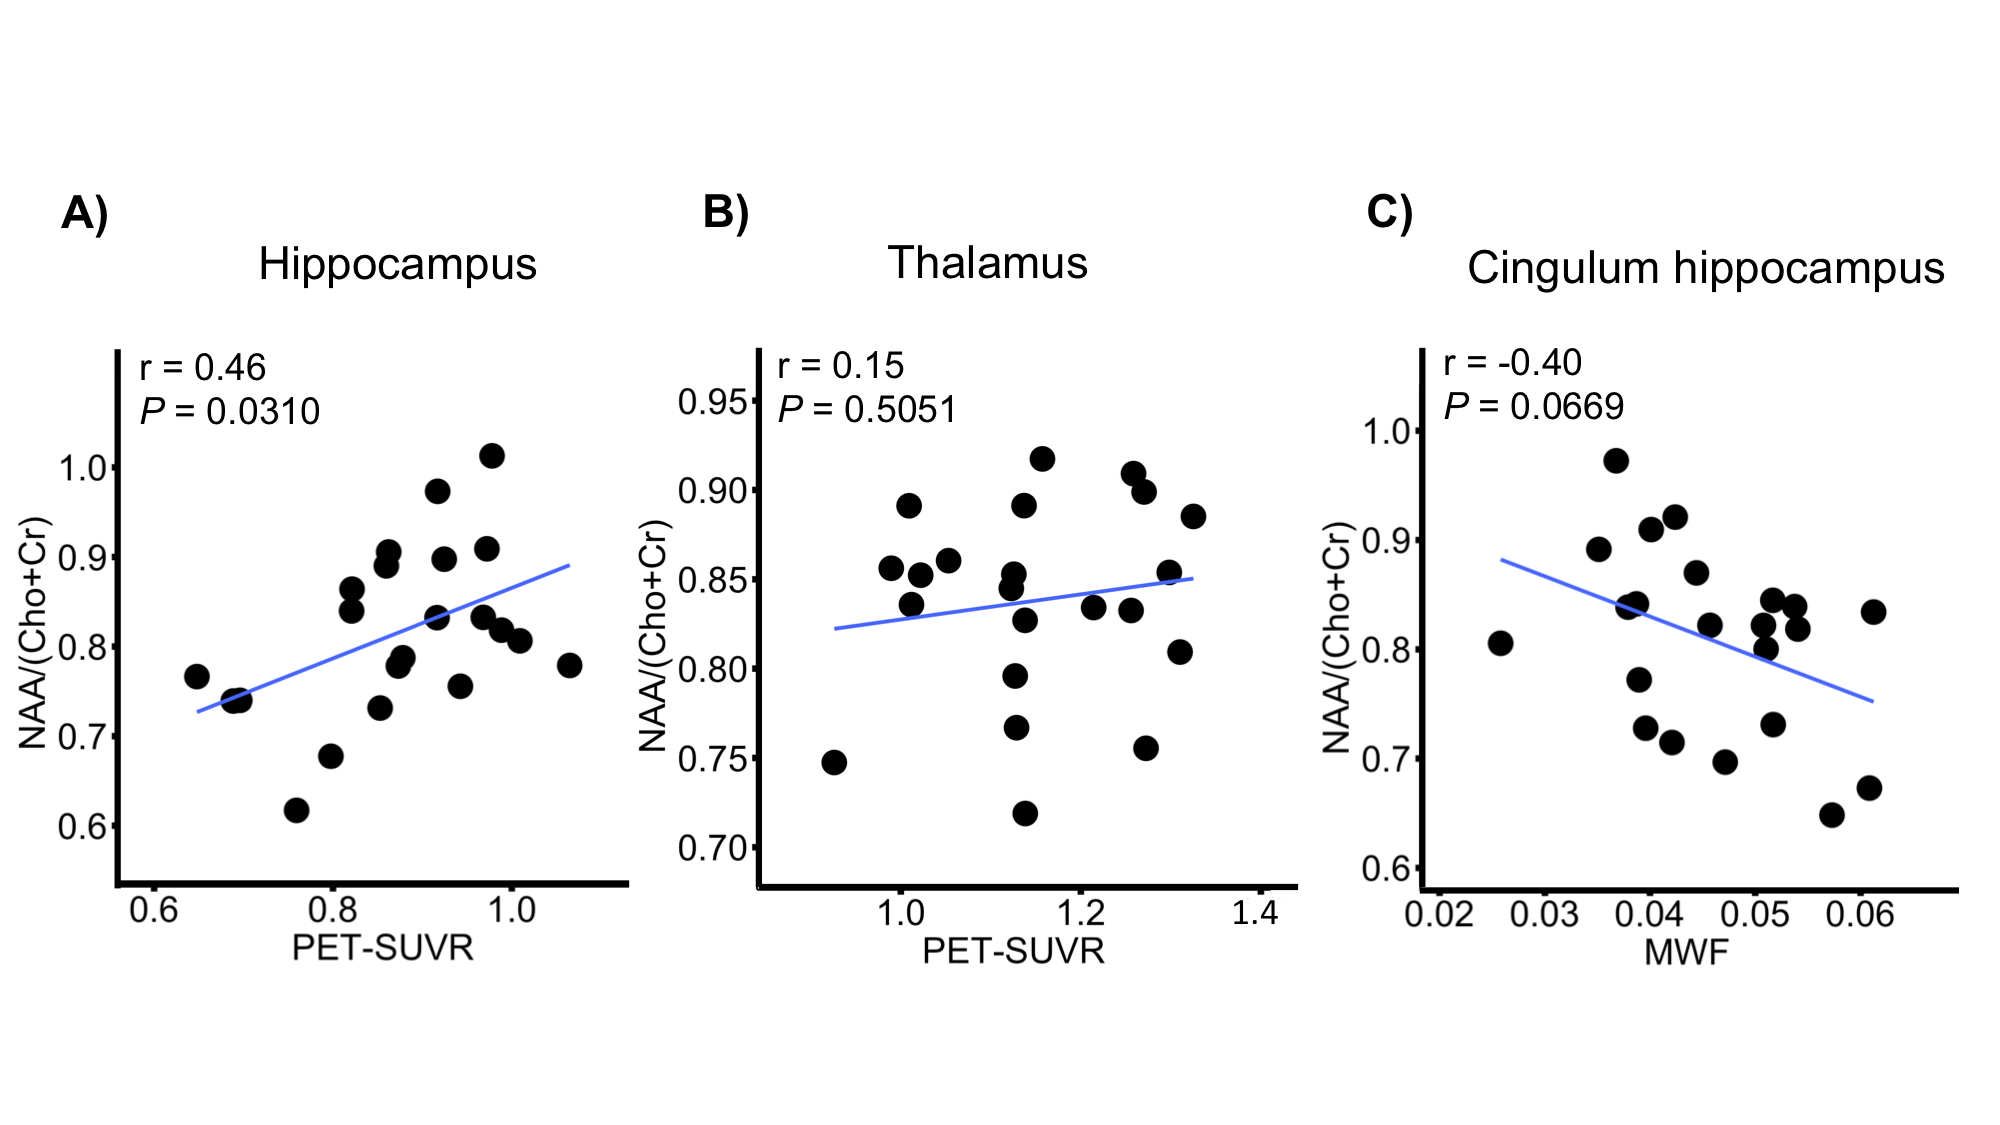
The high-resolution NAA, Cho, Cr, Ins, QSM, MWF maps, and PET-SUVR of bilateral hippocampi of patient #3 are shown in Fig. 1A, where the reduction of NAA, NAA/(Cho+Cr) and low-uptake FDG were seen in the ipsilateral hippocampus. Among other subcortical regions, thalamus also showed significance (paired t- test) in NAA decrease and lower FDG uptake, consistent with previous findings (Fig. 2).3,4,15 Interestingly, NAA/(Cho+Cr) was found to be positively associated in hippocampus but not in thalamus (Fig. 4A and 4B). The QSM showed tendency of increasing susceptibility in the ipsilateral thalamus, which might indicate increased iron deposition. The lateralities found in the temporal cortices and the insula showed consistent trend with the findings in hippocampal regions, based on the NAA level and FDG uptake. Though no significant changes of cortical or subcortical regions were found in MWF, the MWF was significantly decreased in the genu of corpus callosum (P < 0.05). In addition, MWF was also significantly decreased in the ipsilateral IFOF (inferior fronto-occipital fasciculus), and in the cingulum HC bundle on the ipsilateral side for MR-positive patients (Fig. 3). Though current sample size did not give us enough power to reach statistical significance for any brain regions of MR-negative patients, the trend of each modality can be visualized in Fig. 2 and Fig. 3.Conclusions
We investigated simultaneous high-resolution 1H-MRSI (2.0 x 3.0 x 3.0 mm3), MWF map, QSM map, and 18F-FDG-PET in TLE. Consistent with the literature on single-modal imaging study,3,4 our PET data indicated tissue hypometabolism while 1H-MRSI data showed decreased NAA in the hippocampus ipsilateral to seizure onset zone. In addition, NAA, QSM and MWF seemed to offer additional information in the thalamus, and white matter tracts. These findings may lay a foundation for further investigation of the lateralization and localization of epileptogenic zone using high-resolution multimodal imaging.Acknowledgements
References
1. Spencer DD, Gerrard JL, Zaveri HP. The roles of surgery and technology in understanding focal epilepsy and its comorbidities. Lancet Neurol. 2018; 17(4):373-382.
2. Zijlmans M, Zweiphenning W, van Klink N. Changing concepts in presurgical assessment for epilepsy surgery. Nat Rev Neurol. 2019; 15:594-606.
3. Kirov II , Kuzniecky R , Hetherington HP, et al. Whole brain neuronal abnormalities in focal quantified with proton MR spectroscopy. Epilepsy Res. 2017; 139:85.
4. Tenney JR, Rozhkov L, Horn P, et al., Cerebral glucose hypometabolism is associated with mitochondrial dysfunction in patients with intractable epilepsy and cortical dysplasia. Epilepsia. 2014;55(9):1415-1422.
5. Otte WM, Van Eijsden P, Sander JW, et al., A meta-analysis of white matter changes in temporal lobe epilepsy as studied with diffusion tensor imaging. Epilepsia, 53 (2012), pp. 659-667.
6. Drenthen GS, Backes WH, Aldenkamp AP, et al., On the merits of non-invasive myelin imaging in epilepsy, a literature review. Journal of Neuroscience Methods 2020;338:108687
7. Lorio S, Sedlacik J, So PW, et al., Quantitative MRI susceptibility mapping reveals cortical signatures of changes in iron, calcium and zinc in malformations of cortical development in children with drugresistant epilepsy. medRxiv preprint doi: https://doi.org/10.1101/2020.09.15.20157123
8. Lam F, Liang ZP. A subspace approach to high-resolution spectroscopic imaging. Magn Reson Med. 2014; 71(4):1349-1357.
9. Lam F, Ma C, Clifford B, Johnson CL, Liang ZP. High-resolution 1H-MRSI of the brain using SPICE: Data acquisition and image reconstruction. Magn Reson Med. 2016; 76(4):1059-1070.
10. Ma C, Lam F, Johnson C L, et al. Removal of Nuisance Signals from Limited and Sparse 1H MRSI Data Using a Union-of-Subspaces Model. Magn Reson Med. 2016; 75(2):488-497.
11. Li Y, Lam F, Clifford B, et al. A subspace approach to spectral quantification for MR spectroscopic imaging. IEEE Trans Biomed Eng. 2017;64(10):2486-2489.
12. Peng X, Lam F, Li Y, et al. Simultaneous QSM and metabolic imaging of the brain using SPICE. Magn Reson Med. 2018;79:13-21.
13. Guo R, Zhao Y, Li Y, et al. Simultaneous QSM and metabolic imaging of the brain using SPICE: Further improvements in data acquisition and processing. Magn Reson Med, 2020;85(2):970-977.
14. Li Y, Guo R, Zhao Y, et al. A Model-Based Method for Estimation of Myelin Water Fractions. Proc. Intl. Soc. Magn. Reson. Med. 2019, p. 4902.
15. Hetherington HP, Kuzniecky RI, Vives K, et al. A subcortical network of dysfunction in TLE measured by magnetic resonance spectroscopy. Neurology. 2007;69:2256–65.
Figures