3713
Fast High-Resolution 1H-MRSI of the Human Brain at 7T1Department of Electrical and Computer Engineering, University of Illinois at Urbana-Champaign, Urbana, IL, United States, 2Beckman Institute for Advanced Science and Technology, University of Illinois at Urbana-Champaign, Urbana, IL, United States, 3Imaging Institute, Cleveland Clinic, Cleveland, OH, United States, 4Center for Magnetic Resonance Research, University of Minnesota, Minneapolis, MN, United States, 5School of Biomedical Engineering, Shanghai Jiao Tong University, Shanghai, China
Synopsis
Ultrahigh field systems provide significant SNR benefits to MRSI, but also bring new challenges for accelerated MRSI due to increased spectral bandwidth and larger B0/B1 inhomogeneities. We have managed to overcome these problems and developed a SPICE-based data acquisition and processing technique for rapid, high-resolution spectroscopic imaging of the human brain without water-suppression at 7T. The proposed method can simultaneously obtain metabolite signals at 3.0×3.0×3.0 mm3 resolution and companion water signals at 1.0×1.0×3.0 mm3 resolution with high SNR in a single 8 min scan.
Introduction
The potential of using ultrahigh field systems for MRSI has long been recognized.1,2 However, the increased magnetic field requires higher sampling bandwidth to avoid spectral aliasing, which is an obstacle for implementing some of the spatiotemporal sampling trajectories like EPSI and spiral MRSI 3,4 and for sparse sampling of (k, t)-space.5 In addition, the increased SAR, shorter $$$\mathrm{T_2^*}$$$ values and higher B0 and B1 inhomogeneities also make MRSI at ultrahigh fields more challenging.Several techniques have been proposed for MRSI at 7T, producing encouraging results.2,5,6 Using FID acquisition with concentric ring trajectories, it has been shown that metabolite maps can be obtained at a nominal resolution around 3 mm in about 15 minutes.6 It has also been shown that 7T MRSI data provide more accurate metabolite measurements than those from 3T and 1.5T.7
In this work, we developed a rapid, high-resolution non-water-suppressed MRSI technique at 7T using the SPICE framework for data acquisition and processing.8 The proposed method achieved high readout resolution using EPSI trajectories without the limitation of resolution-bandwidth tradeoff. The companion water signals were used to correct the system imperfections including B0 and B1 inhomogeneities. In a single 8 min scan, metabolite maps at 3.0×3.0×3.0 mm3 resolution, water images, tissue susceptibility map (QSM) and tissue relaxation map ($$$\mathrm{T_2^*}$$$) at 1.0×1.0×3.0 mm3 resolution were obtained simultaneously from the MRSI data acquired in healthy human brains at 7T.
Methods
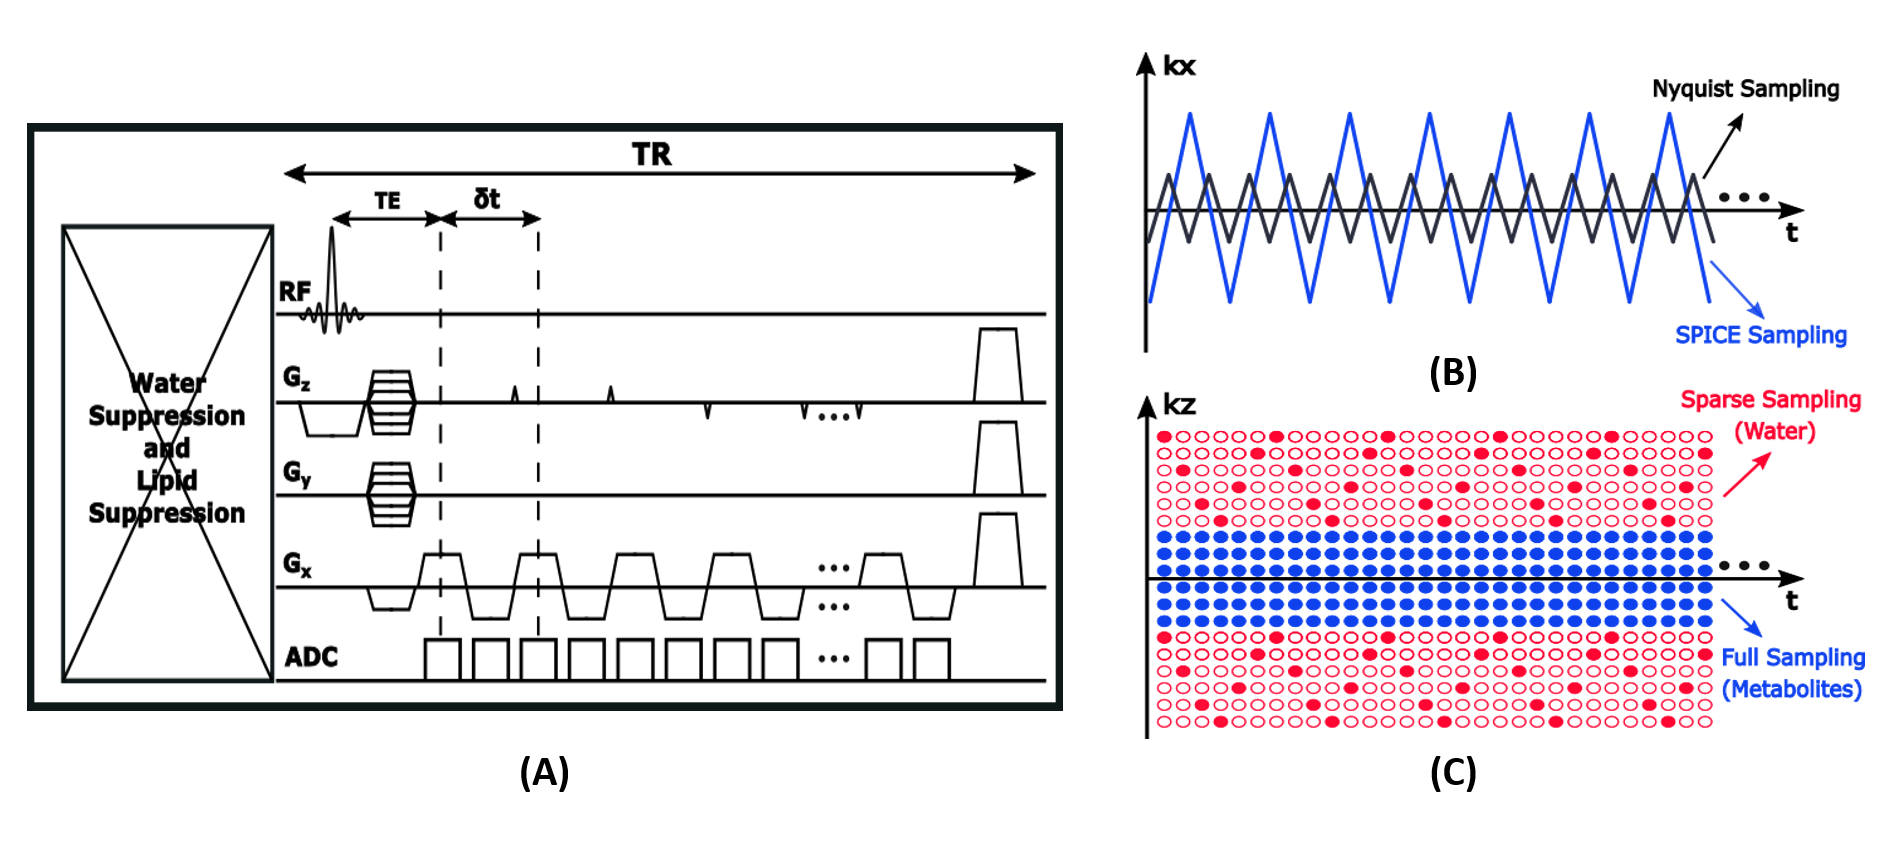
The proposed acquisition sequence is illustrated in Figure 1, which has the following key features. First, EPSI trajectories with a large echo-space (1.04 ms) and ramp sampling were used to achieve high resolution in the readout direction (3 mm); the problem associated with sub-Nyquist sampling was overcome using subspace modeling as was done in SPICE at 3T.8,9 Second, FID-based acquisition with ultrashort TE (1.6 ms) and short TR (160 ms) was used, which reduced the effect of shortened $$$\mathrm{T_2^*}$$$ at 7T, RF power deposition, and the overall scan time. Third, no water suppression was applied, which further reduced RF power deposition and also provided useful information for the correction of system imperfections like B0 and B1 inhomogeneities through the companion water signals. Fourth, central k-space region was fully sampled for metabolic imaging while peripheral (k, t)-space was sparsely sampled by a factor of 36 below the Nyquist sampling density using CAIPIRINHA trajectories so as to achieve high resolution for the water signals.10 As a result, for an FOV of 240×240×72 mm3, metabolite signals at 3.0×3.0×3.0 mm3 resolution and water signals at 1.0×1.0×3.0 mm3 resolution were obtained simultaneously in 8 minutes. Other parameters used are: bandwidth: 200 kHz, echo space: 1.04 ms, matrix size: 78×78×24 for metabolite signals and 78×216×72 for water signals. In this study, both phantom and in vivo experiments were performed on 7T Siemens MR scanners. Healthy adult volunteers were scanned with approvals from local Institutional Review Boards.The processing procedure followed the SPICE processing pipeline at 3T: (1) reconstruction of high-resolution water signals from sparsely sampled (k, t)-space data using the union-of-subspaces model;10 (2) estimation of high-resolution QSM and $$$\mathrm{T_2^*}$$$ maps from the reconstructed water signals using HSVD fitting and standard QSM processing pipeline;10 (3) removal of water, lipid and sideband signals using the union-of-subspaces model incorporating spatiospectral priors;11 (4) reconstruction of metabolite signals from the noisy nuisance-removed data incorporating pre-learned spectral basis functions.8-13 The B0 and B1 effects were corrected using the high-resolution B0 field map and B1 weighting map estimated from the water signals using HSVD fitting and spatial polynomial fitting, respectively.
Results
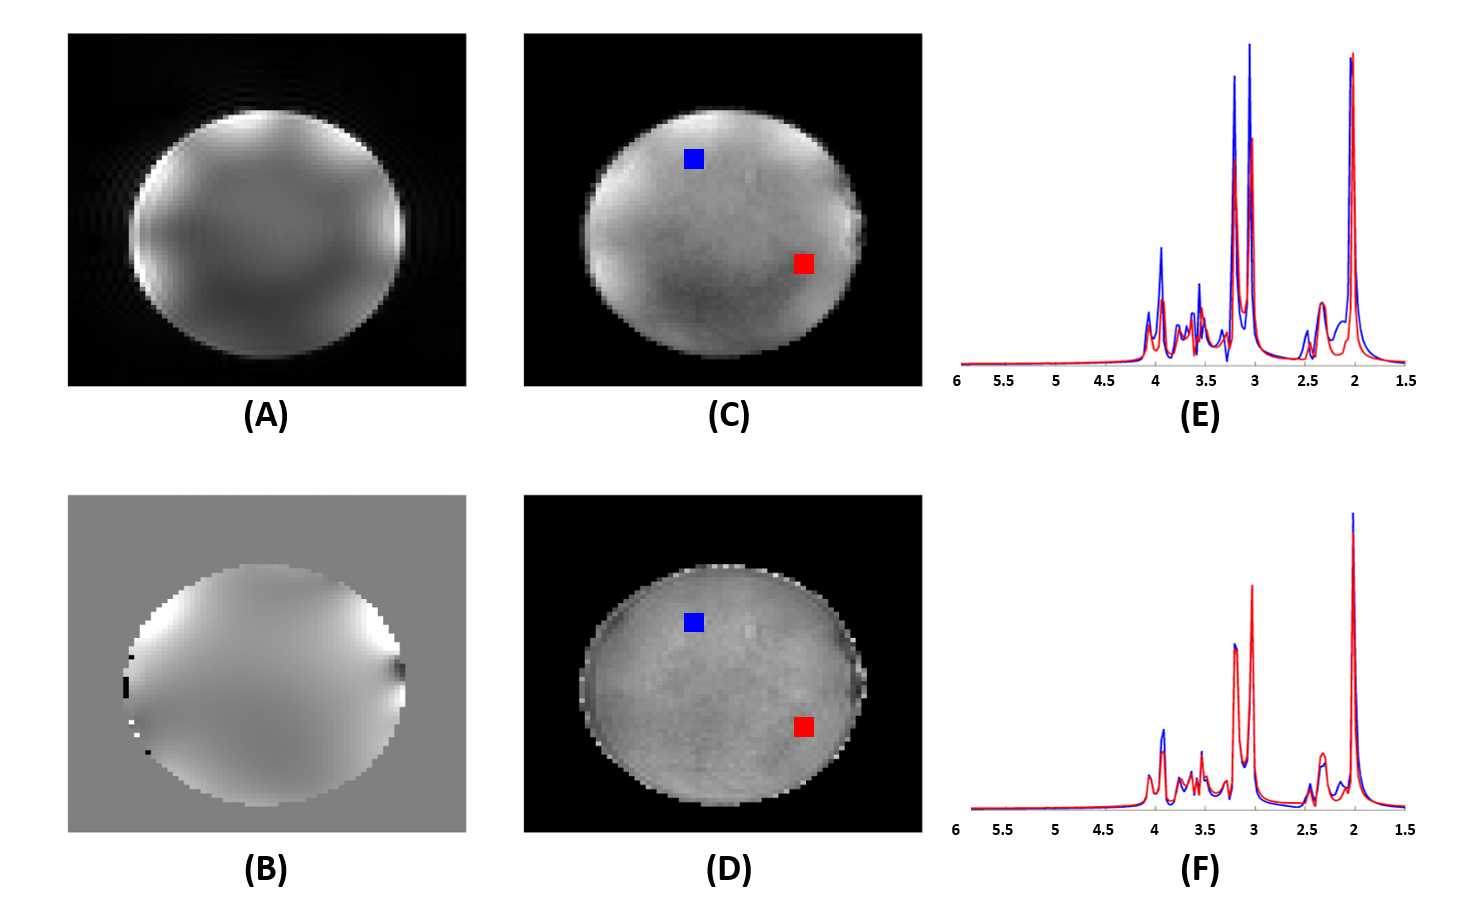
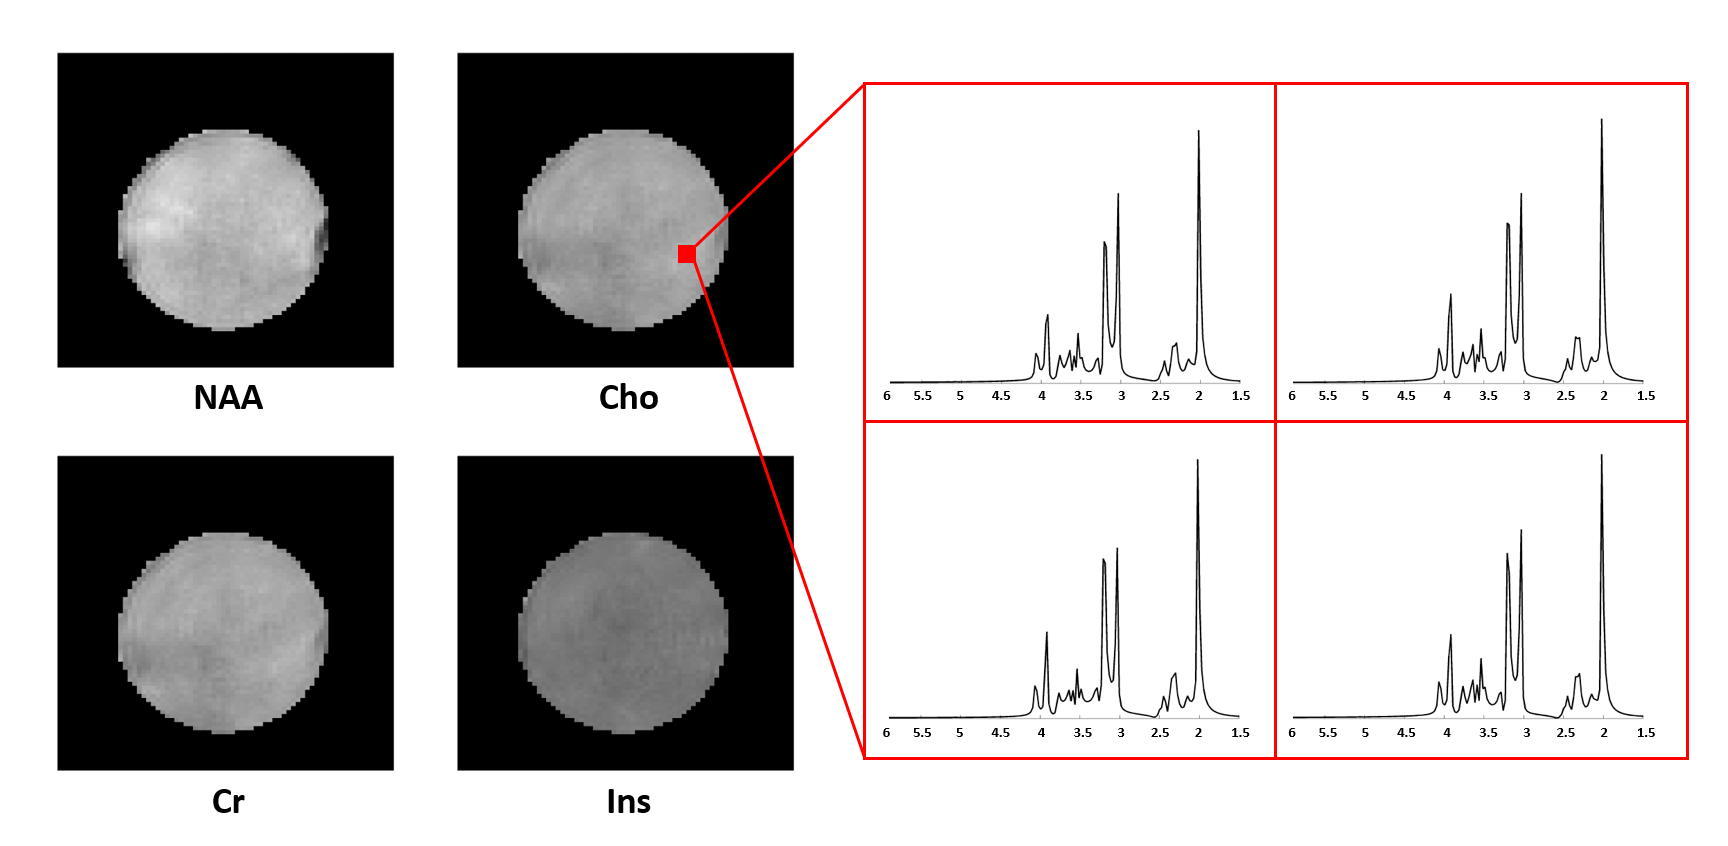
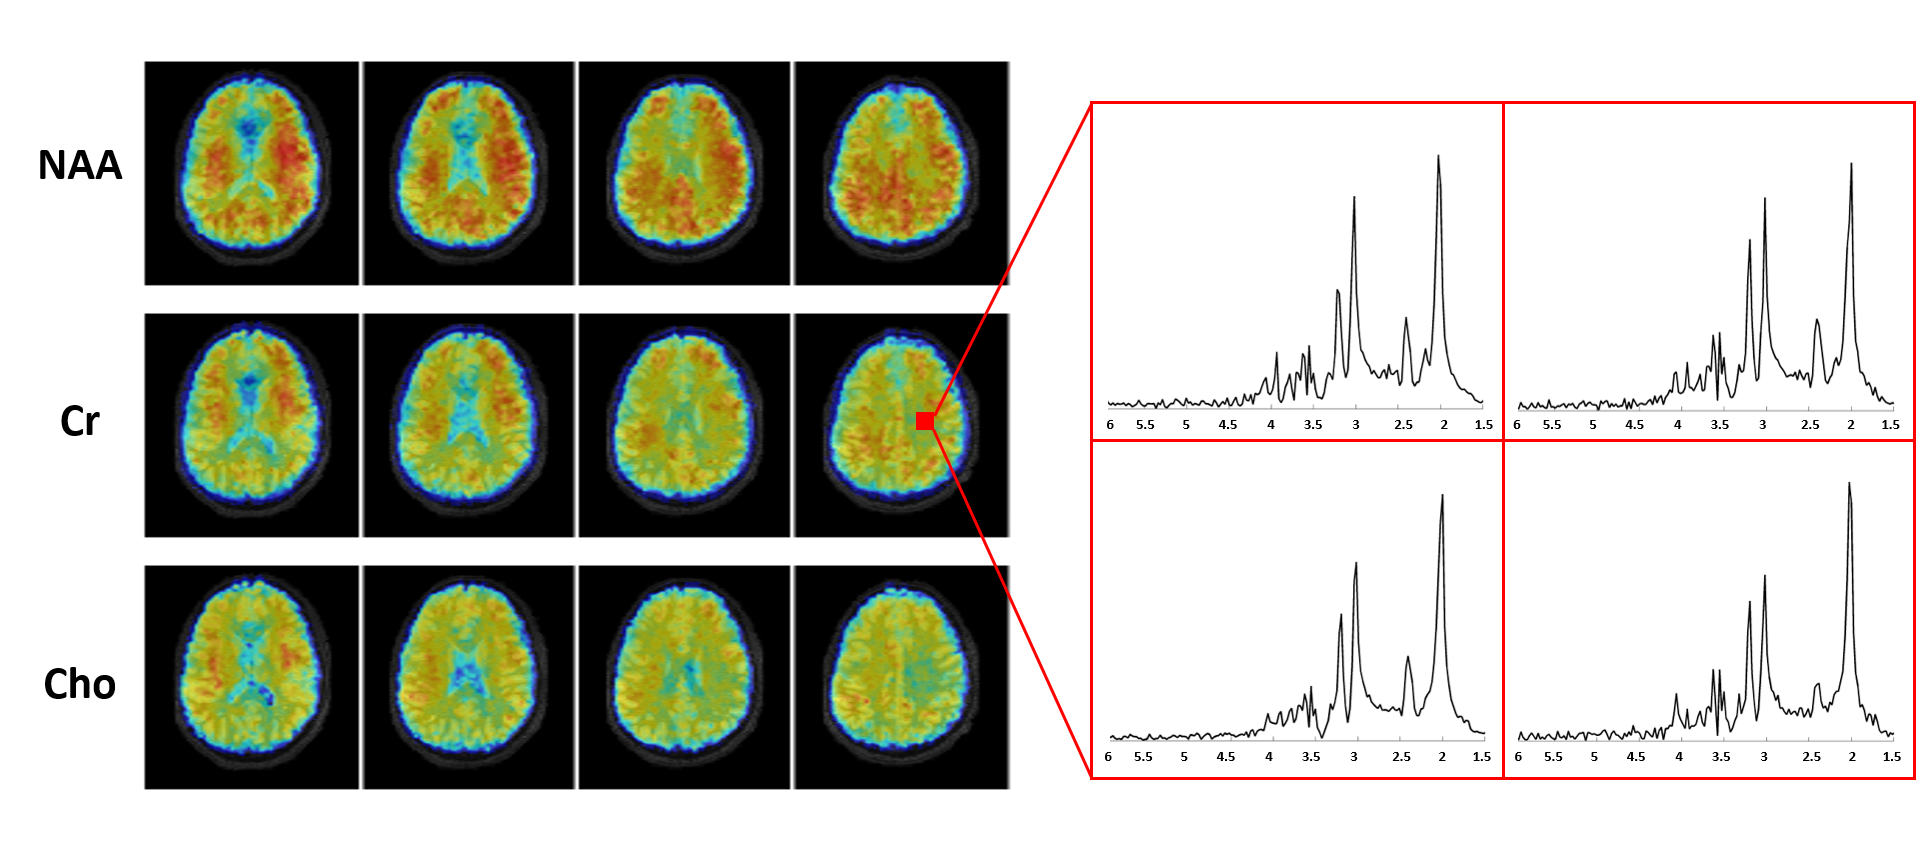
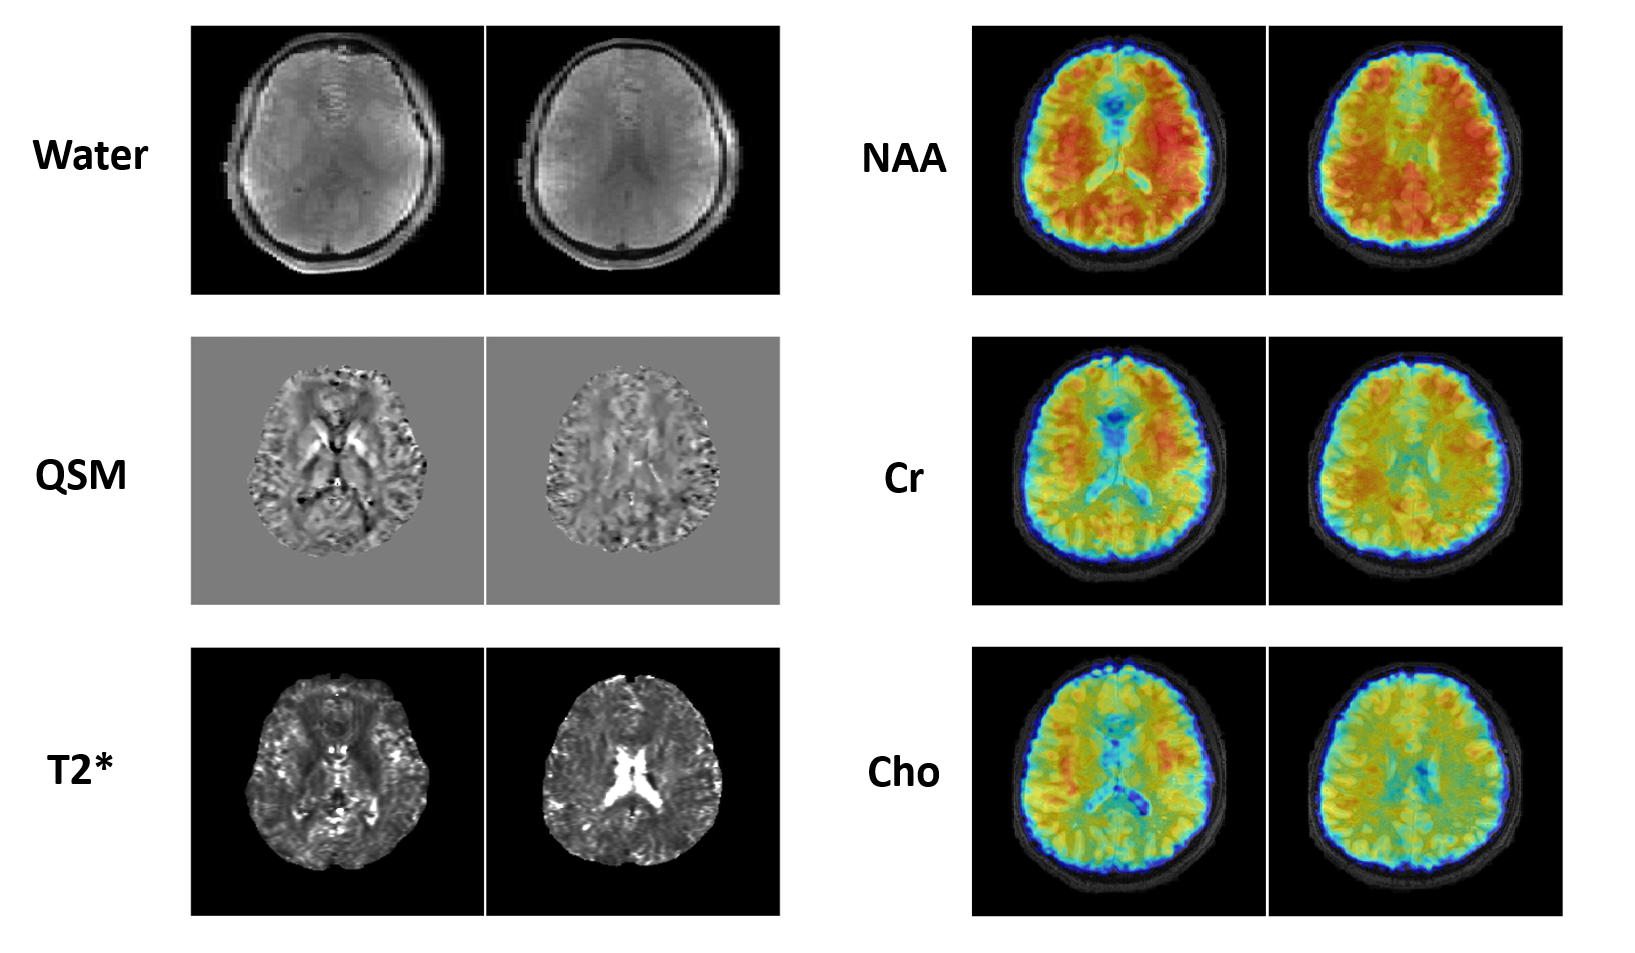
Figures 2 and 3 show some representative MRSI results obtained from a uniform spherical spectroscopy phantom (BRAINO phantom). From the Cr map and localized spectra shown in Figure 2(C) and (E), we can see the significant effect of B0 and B1 inhomogeneity at 7T. After corrections using the water image (Figure 2(A)) and field map (Figure 2(B)) estimated from the water signals, both spatial and spectral distributions of the metabolite signals were more uniform (Figure 2(D, F)). The resulting metabolite maps of NAA, Cr, Cho and Ins and spectra from an ROI were displayed in Figure 3.Figure 4 shows a set of representative in vivo results. As can be seen, high-quality 3D metabolite maps and localized spectra were obtained using the proposed SPICE method. Besides the high-resolution metabolite maps (3.0×3.0×3.0 mm3), higher-resolution water structural images, QSM and $$$\mathrm{T_2^*}$$$ maps (1.0×1.0×3.0 mm3) were simultaneously obtained from the SPICE data acquired in a single 8 min scan, as shown in Figure 5.
Conclusion
Accelerated MRSI using both sparse sampling of (k, t)-space and rapid scanning in EPSI trajectories was possible at 7T using the SPICE framework for data acquisition and processing. Our technique was able to produce high-quality metabolite maps at 3.0×3.0×3.0 mm3 resolution and water signals at 1.0×1.0×3.0 mm3 resolution using 8 minutes of data acquisition time. With further improvement, the technique may provide a powerful tool for high-quality metabolic imaging of the human brain at 7T under healthy and diseased states.Acknowledgements
This work reported in this paper was supported, in part, by the National Institutes of Health (R21-EB023413, R01-CA24095, U01-EB026978, P41-EB027061 and P30-NS076408).References
1. Henning A. Proton and multinuclear magnetic resonance spectroscopy in the human brain at ultra-high field strength: a review. NeuroImage. 2018;168:181-198.
2. Hangel G, Strasser B, Považan M, et al. Ultra-high resolution brain metabolite mapping at 7 T by short-TR Hadamard-encoded FID-MRSI. NeuroImage. 2018;168:199-210.
3. Posse S, Tedeschi G, Risinger R, et al. High speed 1H spectroscopic imaging in human brain by echo planar spatial‐spectral encoding. Magn Reson Med. 1995;33(1):34–40.
4. Adalsteinsson E, Irarrazabal P, Topp S, et al. Volumetric spectroscopic imaging with spiral‐based k‐space trajectories. Magn Reson Med. 1998;39(6):889–898.
5. Strasser B, Povazan M, Hangel G, et al. (2+1)‐CAIPIRINHA accelerated MR spectroscopic imaging of the brain at 7T. Magn Reson Med. 2017;78(2):429‐440.
6. Hingerl L, Strasser B, Moser P, et al. Clinical high-resolution 3D-MR spectroscopic imaging of the human brain at 7 T. Invest Radiol. 2020;55(4):239-248.
7. Motyka S, Moser P, Hingerl L, et al. The influence of spatial resolution on the spectral quality and quantification accuracy of whole‐brain MRSI at 1.5 T, 3T, 7T, and 9.4 T. Magn Reson Med. 2019;82(2):551-565.
8. Lam F, Liang ZP. A subspace approach to high‐resolution spectroscopic imaging. Magn Reson Med. 2014;71(4):1349-1357.
9. Liang ZP. Spatiotemporal imaging with partially separable functions. Proc IEEE Int Symp Biomed Imaging. 2007:988–991.
10. Guo R, Zhao Y, Li Y, et al. Simultaneous QSM and metabolic imaging of the brain using SPICE: Further improvements in data acquisition and processing. Magn Reson Med. 2020;85: 970– 977.
11. Ma C, Lam F, Johnson CL, et al. Removal of nuisance signals from limited and sparse 1H MRSI data using a union‐of‐subspaces model. Magn Reson Med. 2016;75(2):488-497.
12. Lam F, Li Y, Guo R, et al. Ultrafast magnetic resonance spectroscopic imaging using SPICE with learned subspaces. Magn Reson Med. 2019;83(2):377-390.
13. Li Y, Lam F, Clifford B, et al. A subspace approach to spectral quantification for MR spectroscopic imaging. IEEE Trans Biomed Eng. 2017;64(10):2486-2489.
Figures