3712
Prediction of the response to induction chemotherapy using Amide Proton Transfer MRI in nasopharyngeal carcinoma1Department of Radiology, Sun Yat-sen University Cancer Center, State Key Laboratory of Oncology in Southern China, Guangzhou, China, 2Central Research Institute, United Imaging Healthcare, Shanghai, China
Synopsis
Nasopharyngeal carcinoma (NPC) prevails in Southeast Asia. Induction chemotherapy (IC) is recommended as the effective treatment for patients with NPC. However, not all patients respond well to IC. Pretreatment identification of the non-responders may help to make treatment more personalized. The amide proton transfer (APT) MRI can give contrast due to exchangeable backbone amide protons of endogenous mobile proteins and peptides, and APT value in tumor has been reported higher. Therefore, the aim of this study is to evaluate whether APT value before treatment correlate to IC response in NPC.
Introduction:
Nasopharyngeal carcinoma (NPC) is the most common head and neck cancer in Southeast Asia. Concurrent chemoradiation has become a standard of care for NPC1. It has been reported that the use of induction chemotherapy (IC) prior to chemo-radiation therapy reduced the rate of distant metastasis2. Furthermore, tumor response to IC was an independent prognostic factor for survival in NPC3. However, not all patients respond well to IC, and lack of ideal clinical features or biological biomarker is available for non-responders. The pretreatment identification of non-responders may help more personalized treatment selection, avoiding unnecessary side effects, toxicity and costs. The validity of amide proton transfer (APT) MRI has been established in head and neck tumors, which can give contrast due to exchangeable backbone amide protons of endogenous mobile proteins and peptides4,5. Early reports showed that APT values were higher in tumors compared to normal tissues6. Moreover, increased tumor cellularity was associated with an increase in abnormal protein synthesis and overexpression of several proteins and peptides which were rich in amide protons7, and a positive correlation was observed between APT values and cellularity8. To date, however, no study has reported the role of APT-weighted (APTw) imaging for the prediction of IC response in NPC. In this work, we aim to evaluate whether pre-treatment APT values are associated with response to IC.Methods:
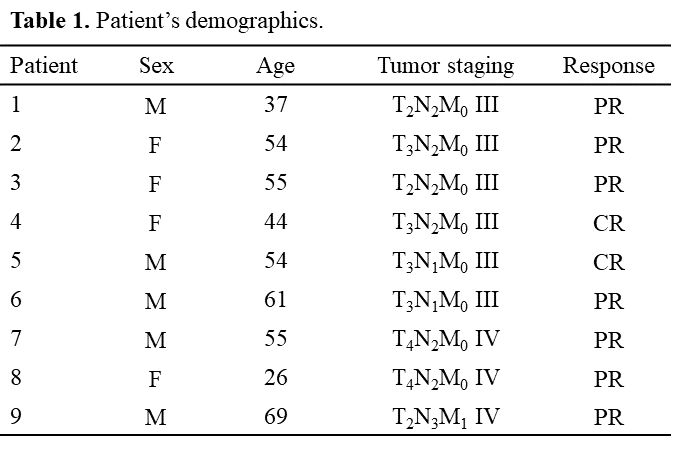
Participants: Nine patients with histologically confirmed NPC who were treated with IC (Docetaxel and Lobaplatin, two cycle, 3 weeks apart) between Sep 2020 and Dec 2020 were enrolled. The patients’ demographics was showed in Table 1. Patients were categorized as complete response (CR) with no evidence of disease (n = 2) and partial response (PR) with evidence of residual disease or disease relapse (n = 7), based on the RECIST (version 1.1) criteria9.MRI Protocols: Two MR examinations were performed on a 3.0T scanner (uMR 790, United Imaging Healthcare, Shanghai, China) with a 24-channel head and neck coil. One before treatment, and one after treatment (5-10 days after the end of IC). Conventional anatomical MR protocols including a T2-weighted fast spin echo sequence, and a dynamic three-dimensional T1 weighted gradient echo sequence. APTw protocol was: radiofrequency excitation pulses with an amplitude of 2.0μT and duration of 500ms were used for saturation. Imaging covered saturation frequency offsets between -6ppm and 6ppm in 0.4ppm increments. The magnetization transfer ratio asymmetry (MTRasym) measured at the offset of 3.5ppm produced the APTw image (field of view = 230mm × 230mm; slice thickness = 4mm; resolution = 1.8mm2; echo time = 38.8ms; repetition time = 4000ms). A baseline image with no saturation pulse was acquired during the same scan. The whole scan time was approximately 3min.
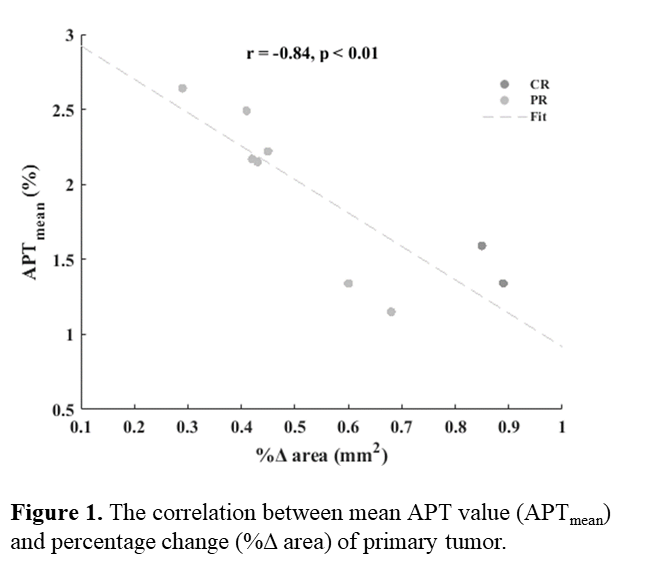
Data Analysis and Statistics: Using T2-weighted MRI, the largest cross section of primary tumor was selected for APTw imaging. The area of the single representative slice through the primary tumor was outlined manually on both pre-treatment and post-treatment anatomical images by two radiologists. The percentage change (%Δ area) was calculated by dividing the difference between pre-treatment area and post-treatment area by pre-treatment area. APTw image processing was performed using an in-house Matlab (2020a) program. The primary tumor was manually contoured on the APTw image with reference to the anatomical images. The mean (APTmean), 90th percentile (APT90), kurtosis (APTkurtosis) and skewness (APTskewness) of APT values were extracted for histogram analysis. Finally, the percentage change of primary tumor size was correlated with pre-treatment APT values using the Pearson’s correlation coefficient, and p-value was considered significant if it was 0.05 or less.
Results:
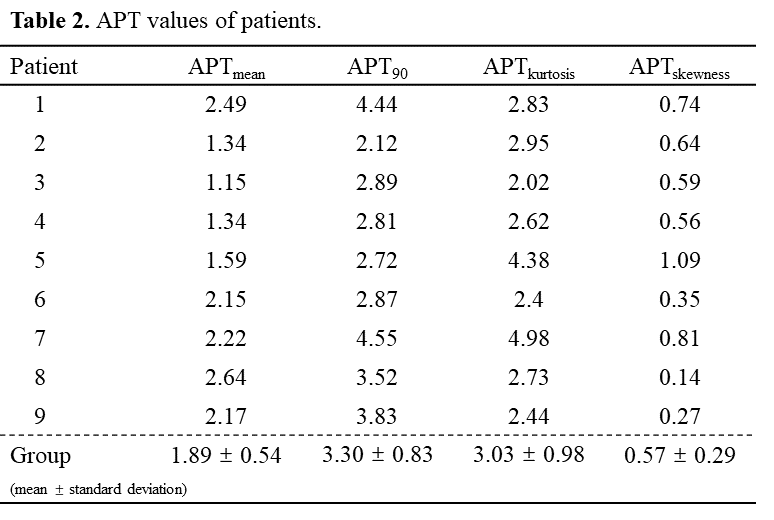
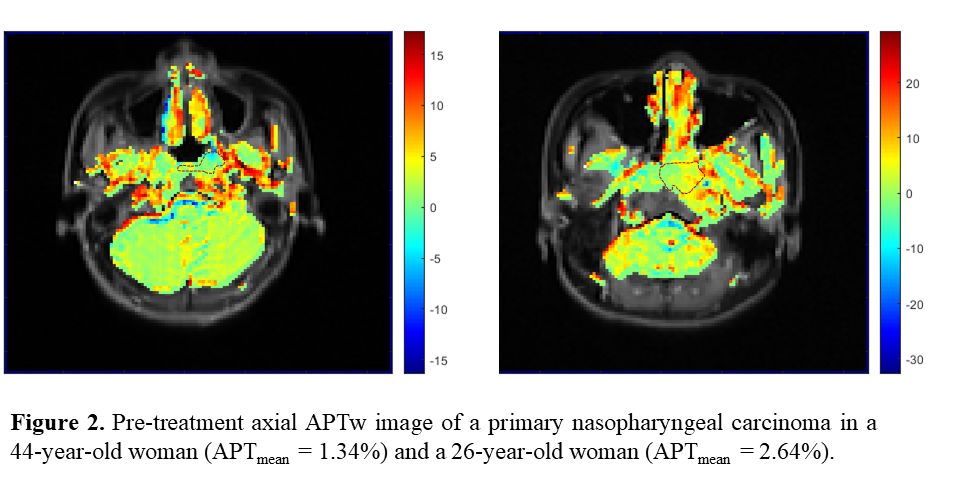
The APTmean, APT90, APTkurtosis and APTskewness of NPC patients were showed in Table 2. The APT values of NPC group were 1.89 ± 0.54, 3.30 ± 0.83, 3.03 ± 0.98 and 0.57 ± 0.29, respectively. The association between pre-treatment APTmean and %Δ area was showed in Figure 1. The correlation coefficient (r) was -0.84 and P < 0.01. The pre-treatment axial APTw imaging of CR and PR were showed in Figure 2. The APTmean of NPC in a 44-year-old female (with 89 %Δ area) and a 26-year-old female (with 29 %Δ area) were 1.34 and 2.64.Discussion:
APT characterized amide protons in cancer proteins and peptides by using chemical exchange saturation transfer (CEST) MRI10, and intracellular pH has comparatively less influence on APT levels than protein concentrations11. Previous study has shown treatment-induced cell death would decrease protein synthesis and the overexpression of proteins and peptides rich in amide protons, leading to a decrease in APT4. Furthermore, high pretreatment APTmean were reported to predict poorly response, due to high tumor APT reflect rapidly proliferating tumor cells and abnormal protein synthesis5. The above results indicate that the NPC pre-treatment APT value from APTw imaging can be a useful indicator of response in IC. In the future, our work will be further validated through more samples.Conclusion:
In this work, we evaluated the association between the pre-treatment APT values and the response to IC. Our results showed that the pre-treatment mean APT value was correlated to percentage change of primary tumor size negatively. It indicated that the NPC pre-treatment APT value from APTw imaging might be a useful indicator of the response in IC.Acknowledgements
No acknowledgement found.References
[1]. Al-Sarraf M, LeBlanc M, Giri PG, et al. Chemoradiotherapy versus radiotherapy in patients with advanced nasopharyngeal cancer: phase III randomized Intergroup study 0099. J Clin Oncol. 1998;16(4):1310-1317. doi:10.1200/JCO.1998.16.4.1310
[2]. Hatakenaka M, Nakamura K, Yabuuchi H, et al. Pretreatment apparent diffusion coefficient of the primary lesion correlates with local failure in head-and-neck cancer treated with chemoradiotherapy or radiotherapy. Int J Radiat Oncol Biol Phys. 2011;81(2):339-345. doi:10.1016/j.ijrobp.2010.05.051
[3]. Peng H, Chen L, Zhang Y, et al. The Tumour Response to Induction Chemotherapy has Prognostic Value for Long-Term Survival Outcomes after Intensity-Modulated Radiation Therapy in Nasopharyngeal Carcinoma. Sci Rep. 2016;6:24835. Published 2016 Apr 21. doi:10.1038/srep24835
[4]. Qamar S, King AD, Ai QY, et al. Amide proton transfer MRI detects early changes in nasopharyngeal carcinoma: providing a potential imaging marker for treatment response. Eur Arch Otorhinolaryngol. 2019;276(2):505-512. doi:10.1007/s00405-018-5231-x
[5]. Qamar S, King AD, Ai QH, et al. Pre-treatment amide proton transfer imaging predicts treatment outcome in nasopharyngeal carcinoma. Eur Radiol. 2020;30(11):6339-6347. doi:10.1007/s00330-020-06985-5
[6]. Yuan J, Chen S, King AD, et al. Amide proton transfer-weighted imaging of the head and neck at 3 T: a feasibility study on healthy human subjects and patients with head and neck cancer. NMR Biomed. 2014;27(10):1239-1247. doi:10.1002/nbm.3184
[7]. Cairns RA, Harris IS, Mak TW. Regulation of cancer cell metabolism. Nat Rev Cancer. 2011;11(2):85-95. doi:10.1038/nrc2981
[8]. Togao O, Yoshiura T, Keupp J, et al. Amide proton transfer imaging of adult diffuse gliomas: correlation with histopathological grades. Neuro Oncol. 2014;16(3):441-448. doi:10.1093/neuonc/not158
[9]. Eisenhauer EA, Therasse P, Bogaerts J, et al. New response evaluation criteria in solid tumours: revised RECIST guideline (version 1.1). Eur J Cancer. 2009;45(2):228-247. doi:10.1016/j.ejca.2008.10.026
[10]. Law BKH, King AD, Ai QY, et al. Head and Neck Tumors: Amide Proton Transfer MRI. Radiology. 2018;288(3):782-790. doi:10.1148/radiol.2018171528
[11]. Ray KJ, Simard MA, Larkin JR, et al. Tumor pH and Protein Concentration Contribute to the Signal of Amide Proton Transfer Magnetic Resonance Imaging. Cancer Res. 2019;79(7):1343-1352. doi:10.1158/0008-5472.CAN-18-2168
Figures