3711
Comparison of Capability for Molecular-Based Assessment between 3D Gradient Echo-Based and 2D Spin Echo-Based CEST Imaging for Brain Tumors11) Joint Research Laboratory of Advanced Medical Imaging, Fujita Health University School of Medicine, Toyoake, Japan, 2Radiology, Fujita Health University School of Medicine, Toyoake, Japan, 3Canon Medical Systems Corporation, Otawara, Japan, 4Radiology, Fujita Health University Hospital, Toyoake, Japan
Synopsis
No major reports have been evaluated the capability for the molecular-based assessment by 3D chemical exchange saturation transfer (CEST) imaging and compared with 2D CEST imaging. We hypothesized that 3D CEST imaging had equal or better potential for the molecular-based assessment in various brain tumor patients, when compared with 2D CEST imaging. The purpose of this study was to directly compare the capability for molecular-based assessment between 2D and 3D CEST imaging in patients with various brain tumors.
Introduction
In the last decade, some investigators have suggested that histopathological grades prediction and/or therapeutic effect assessment in patients with solid brain tumors could be performed with single-slice two-dimensional (2D) chemical exchange saturation transfer (CEST) imaging as one of the metabolic imaging (1-6). However, 2D CEST imaging has not been able to obtain whole brain CEST data at 3.5 ppm as a single examination and may be time consuming for assessing whole brain CEST information in not only academic, but also clinical researches (1-6). Recently, 3D CEST imaging at 3.5 ppm is developed and suggested as a new technique for assessment of whole brain CEST information as a single examination. Moreover, this technique can determine regional difference of CEST information as well as tumor tissue heterogeneity. However, no major reports have been compared the capability for the molecular-based assessment between 2D and 3D CEST imaging in patients with various brain tumors. We hypothesized that 3D CEST imaging has equal or better potential for the molecular-based assessment in various brain tumors, when compared with 2D CEST imaging. The purpose of this study was to directly compare the capability for molecular-based assessment between 2D and 3D CEST imaging in patients with various brain tumors.Materials and Methods
50 consecutive patients with 54 pathologically diagnosed brain tumors (23 males and 27 females; mean age 59.4 year; age range 19-80 years) underwent CEST imaging by 2D spin-echo and 3D gradient-echo sequences at a 3T MR system (Vantage Galan 3T / ZGO, Canon Medical Systems Corporation, Otawara, Japan). In addition, all lesions were pathologically divided into three groups as follows: 7 benign intra-axial tumors (low-grade gliomas [n=7]), 26 malignant intra-axial tumors (high-grade gliomas [n=17] and malignant lymphoma [n=5] and metastases [n=4]) and 21 extra-axial tumors (meningiomas [n=21]). From 2D and 3D CEST data in each patient, magnetization transfer ratio asymmetry at 3.5 ppm (MTRasym at 3.5ppm) was calculated from z-spectra in each pixel, and MTRasym at 3.5ppm map was computationally generated. Then, MTRasym at 3.5ppm in each primary lesion was measured by ROI measurements. To determine the relationship of MTRasym between two methods, Spearman’s rank correlation was performed. Then, Bland-Altman analysis was performed to evaluating the limits of agreement of MTRasym at 3.5 ppm between two methods. To determine MTRasym at 3.5 ppm difference among three groups, MTRasym at 3.5ppm was compared by Tukey’s HSD test. A p value less than 0.05 was considered as significant in this study.Results
Representative cases are shown in Figures 1. Results of correlation and Bland-Altman plot analysis between two methods are shown in Figure 2. On correlation of MTRasym at 3.5 ppm between two methods, 3D CEST imaging had significant and excellent correlation with 2D CEST imaging (r=0.80, p<0.0001). The limits of agreement between 2D and 3D CEST imaging was small enough for clinical purpose (mean±1.96 × standard deviation, -0.012±0.73 %). Compared results of MTRasym at 3.5 ppm among all tumors from both methods are shown in Figure 3. MTRasym of benign intra-axial tumors was significantly lower than that of malignant intra-axial tumors and extra-axial tumors on both methods (2D CEST imaging: p<0.0001, 3D CEST imaging: p<0.0001), although there was no significant difference of MTRasym between malignant intra-axial tumors and extra-axial tumors on both methods (p>0.05).Conclusion
3D CEST imaging has equal to or higher potentials for molecular-based assessment and can be considered at least as valuable as 2D CEST imaging in patients with various brain tumors.Acknowledgements
This study was financially and technically supported by Canon Medical Systems Corporation.References
- Togao O, Yoshiura T, Keupp J, et al. Neuro Oncol. 2014 Mar;16(3):441-8.
- Mehrabian H, Desmond KL, Soliman H, et al. Clinical Cancer Research 2017;23(14):3667-3675.
- Zhou J, Zhu H, Lim M, et al. J Magn Reson Imaging 2013;38(5):1119-1128.
- Zhou J, Tryggestad E, Wen Z, et al. Nature medicine 2011;17(1):130-134.
- Park KJ, Kim HS, Park JE, et al. Eur Radiol 2016;26(12):4390-4403.
- Ma B, Blakeley JO, Hong X, et al. J Magn Reson Imaging 2016;44(2):456-462.
Figures
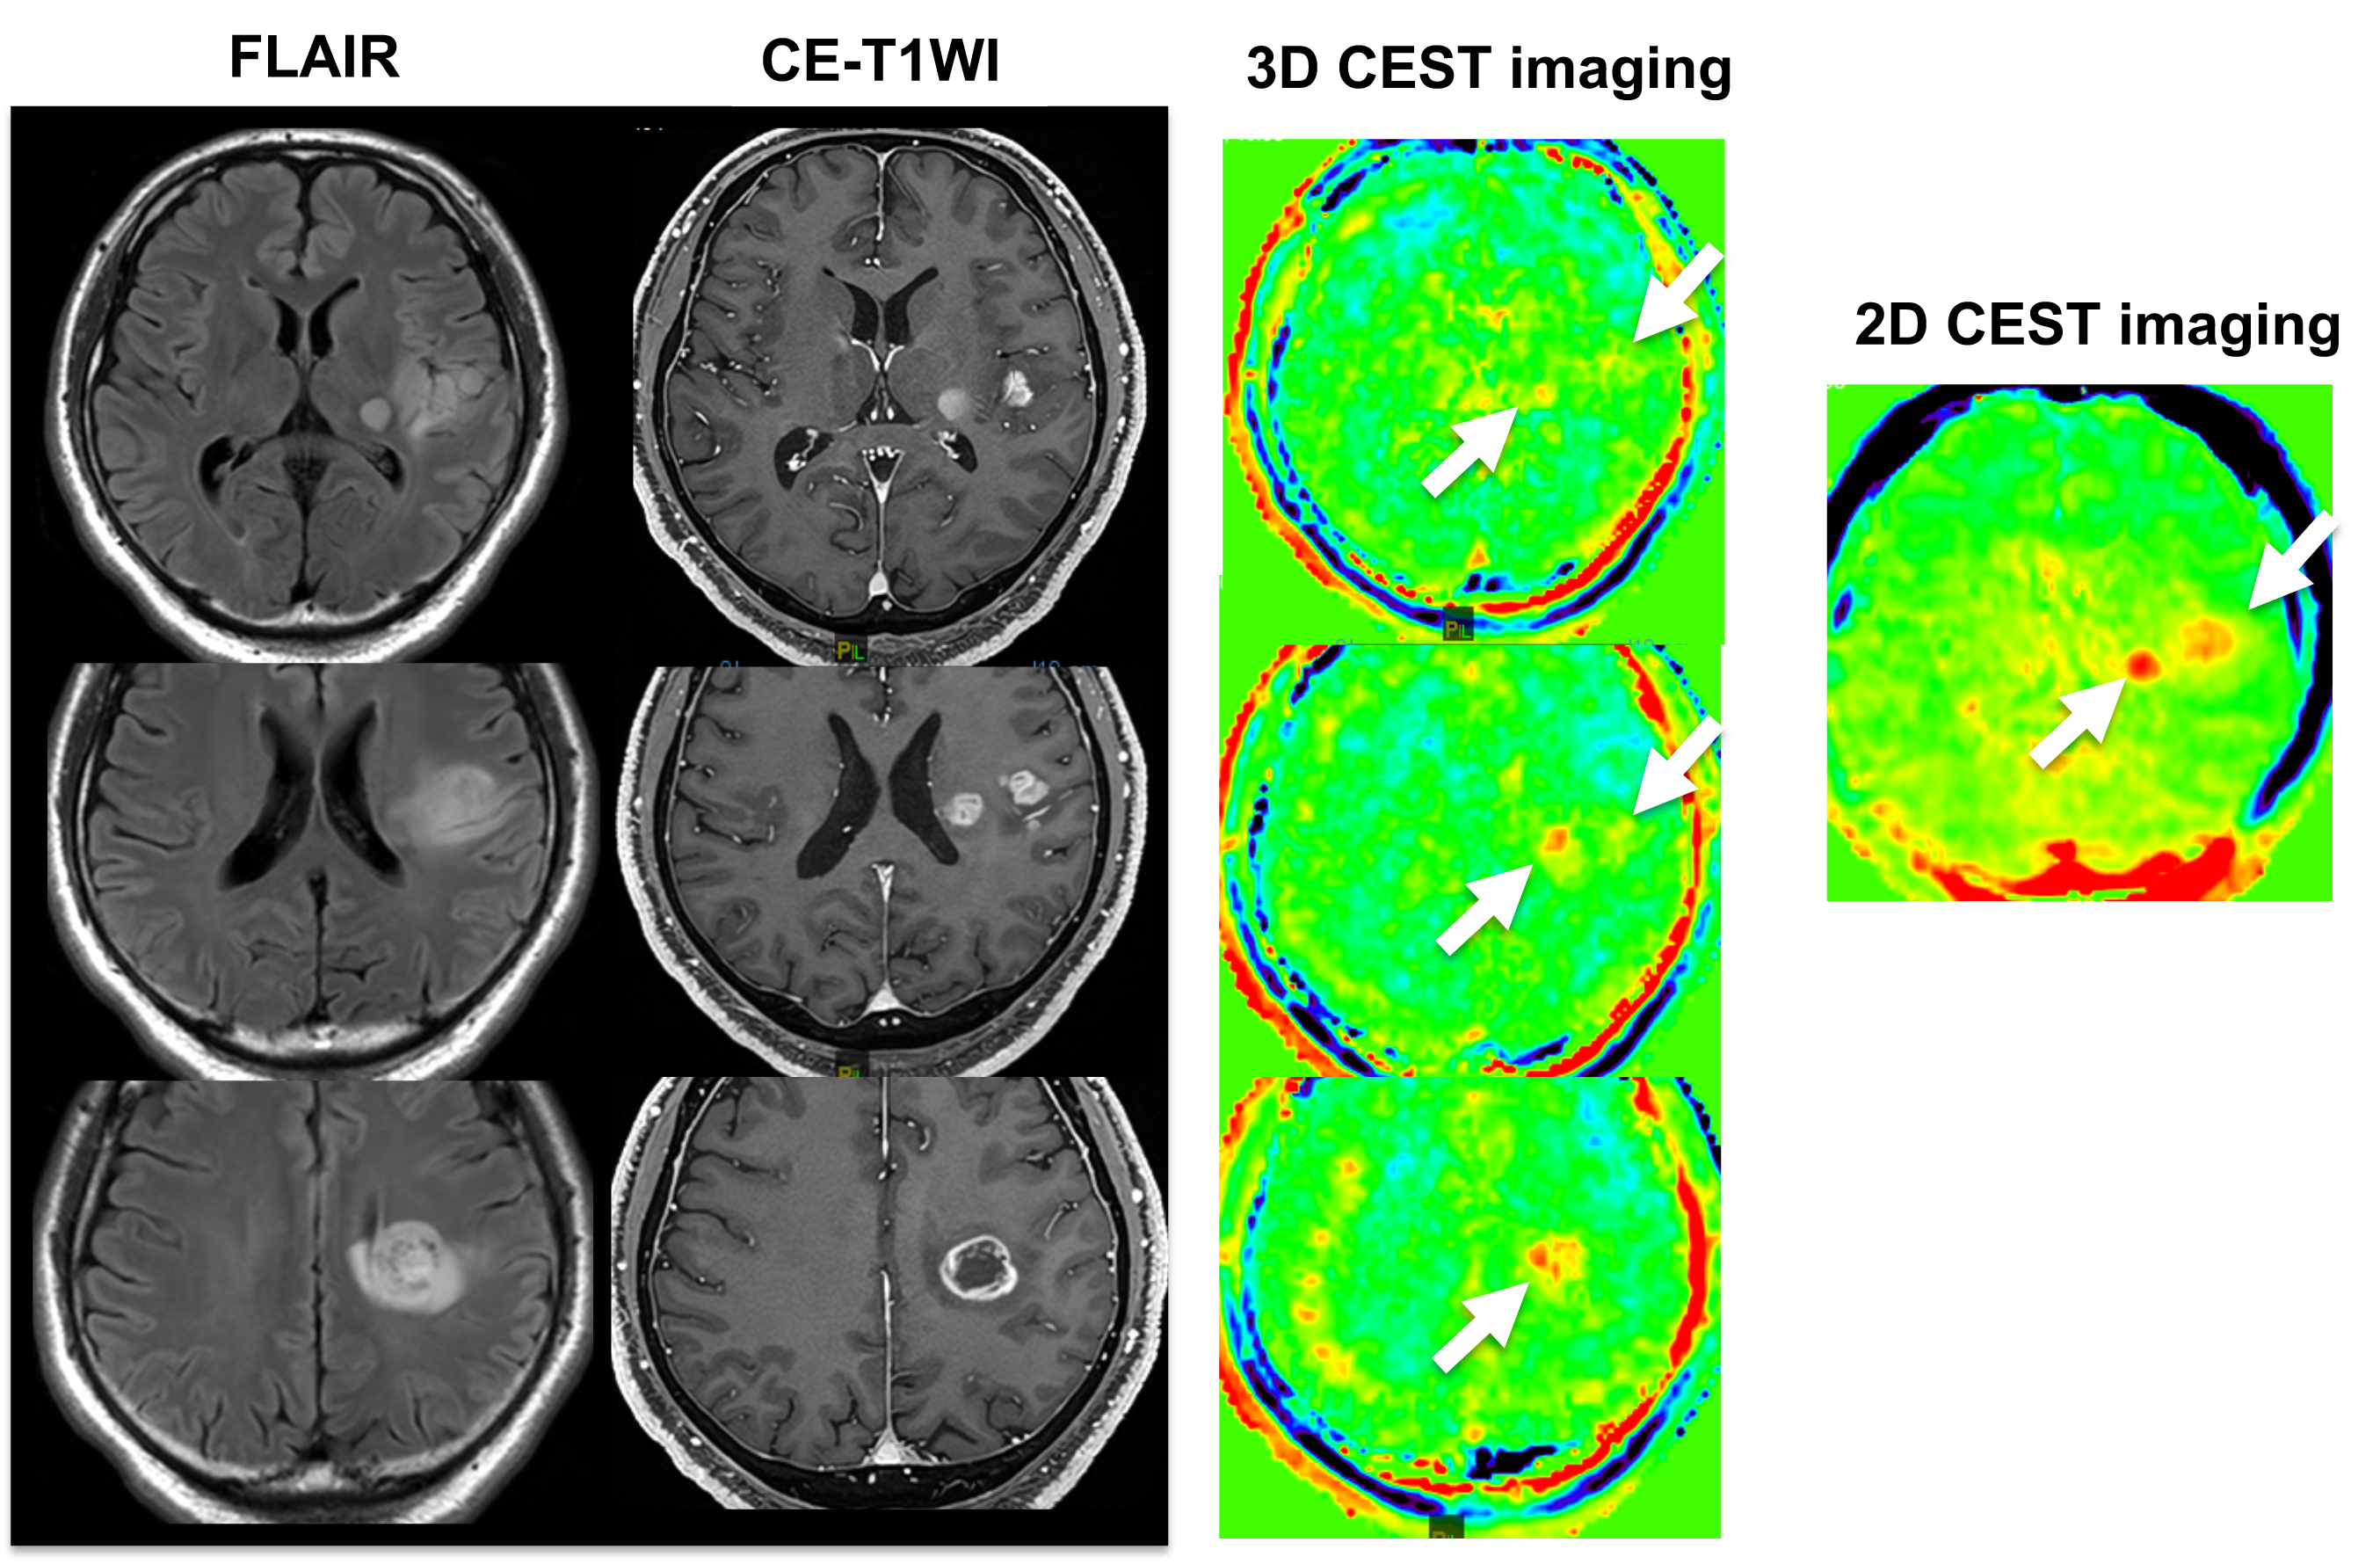
Figure 1. 50-year old male with glioblastoma (Grade Ⅳ).
Glioblastoma (arrow) is shown in the left temporal cerebral suubcortical and white matter on Fluid-attenuated inversion recovery (FLAIR), Contrast-enhanced T1-weighted imaging (CE-T1WI) and CEST imaging. 3D CEST imaging can cover the whole lesion as compared with 2D CEST imaging. MTRasym at 3.5ppm in this case were 2.12% (2D CEST imaging) and 1.69% (3D CEST imaging). 2D and 3D CEST imaging were diagnosed as glioblastoma (grade Ⅳ).
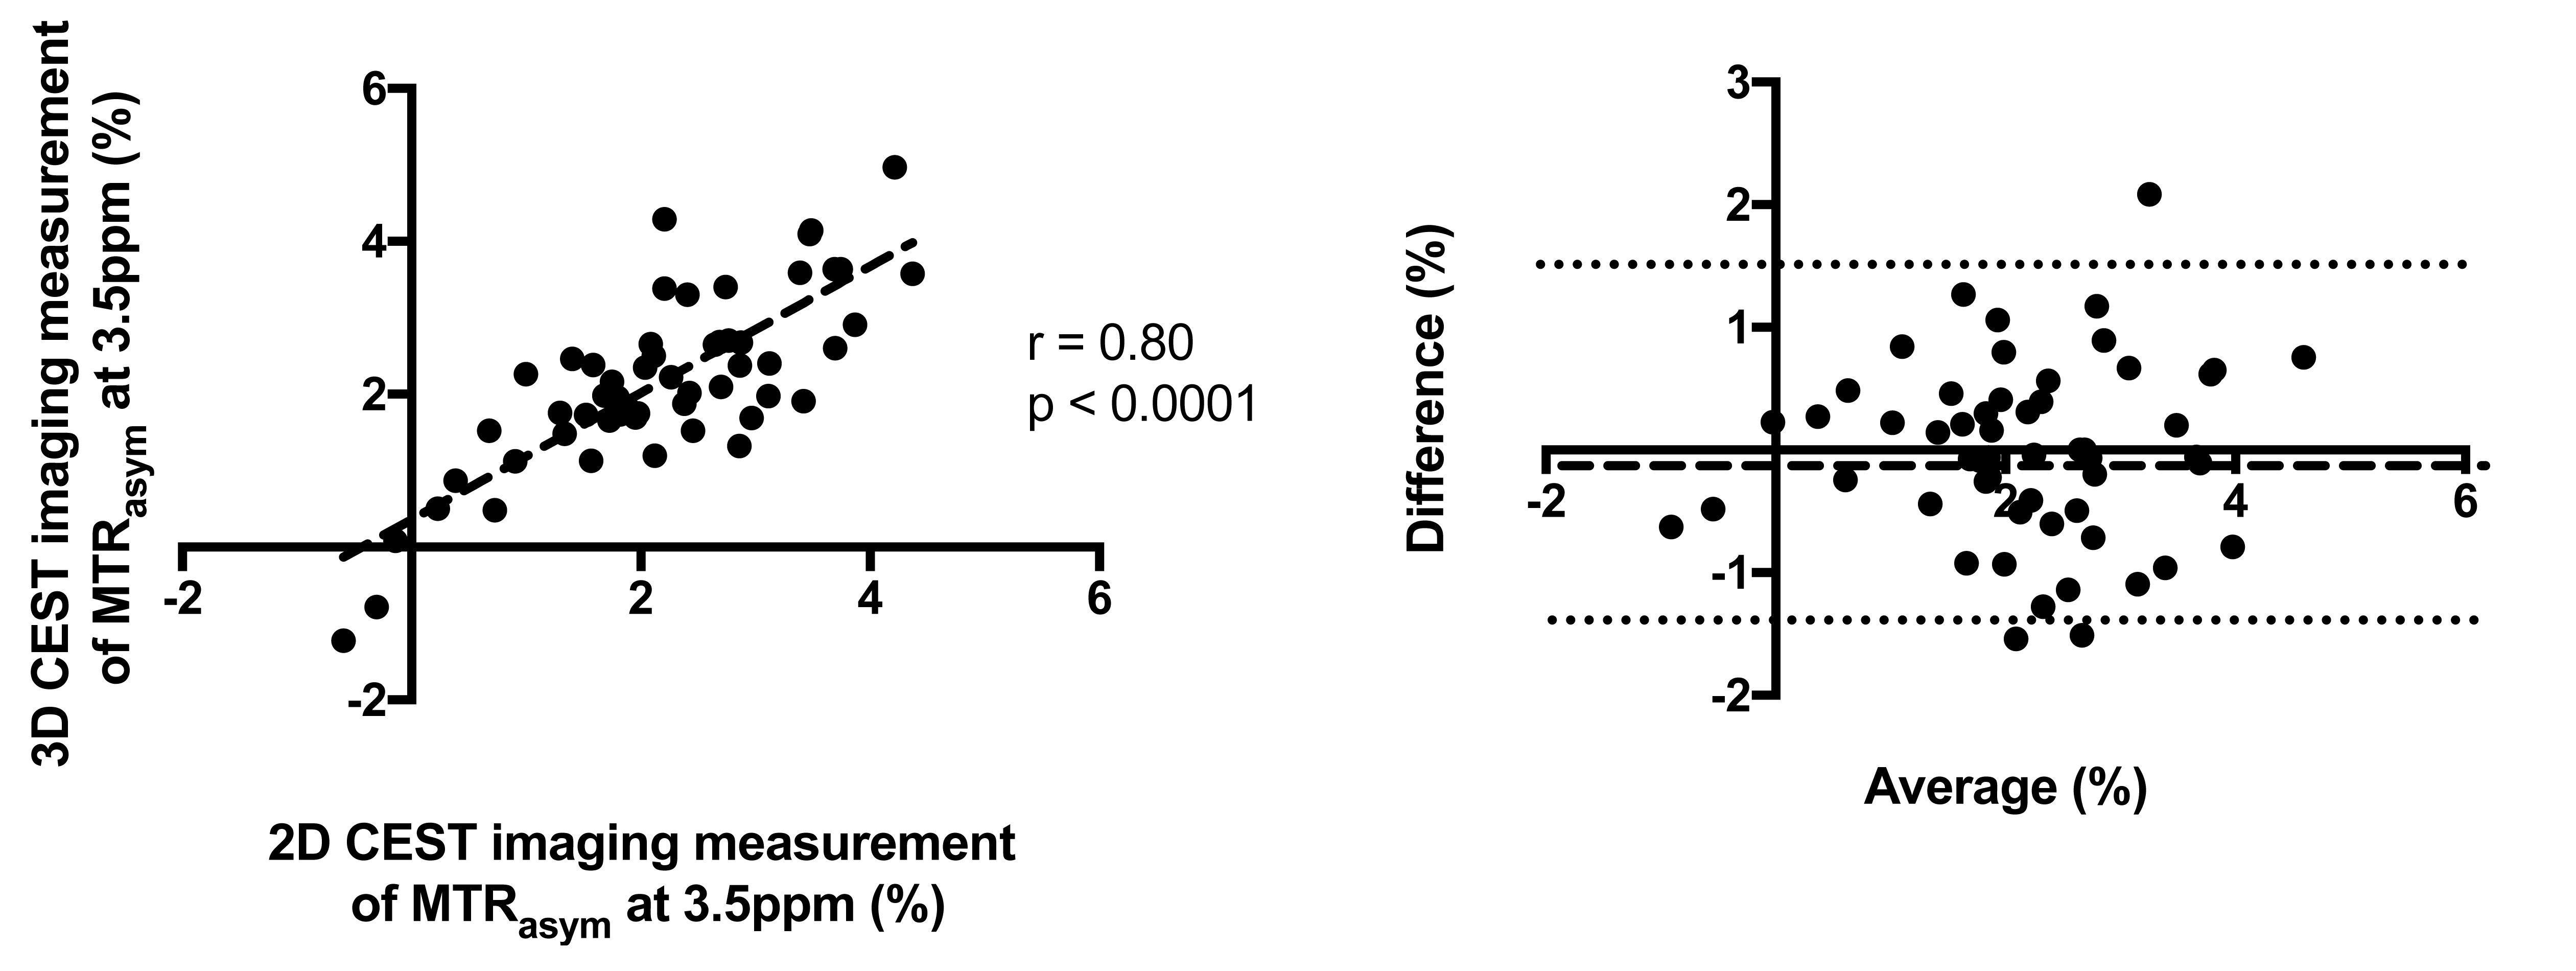
Figure 2. Results of correlation and Bland-Altman plot analysis between 2D and 3D CEST imaging measurement of MTRasym (at 3.5 ppm) for all lesions.
3D CEST imaging had significant and excellent correlation with 2D CEST imaging (r=0.80, p<0.0001). The limits of agreement between 2D and 3D CEST imaging was -0.012±0.73 (mean±1.96 × standard deviation) %.
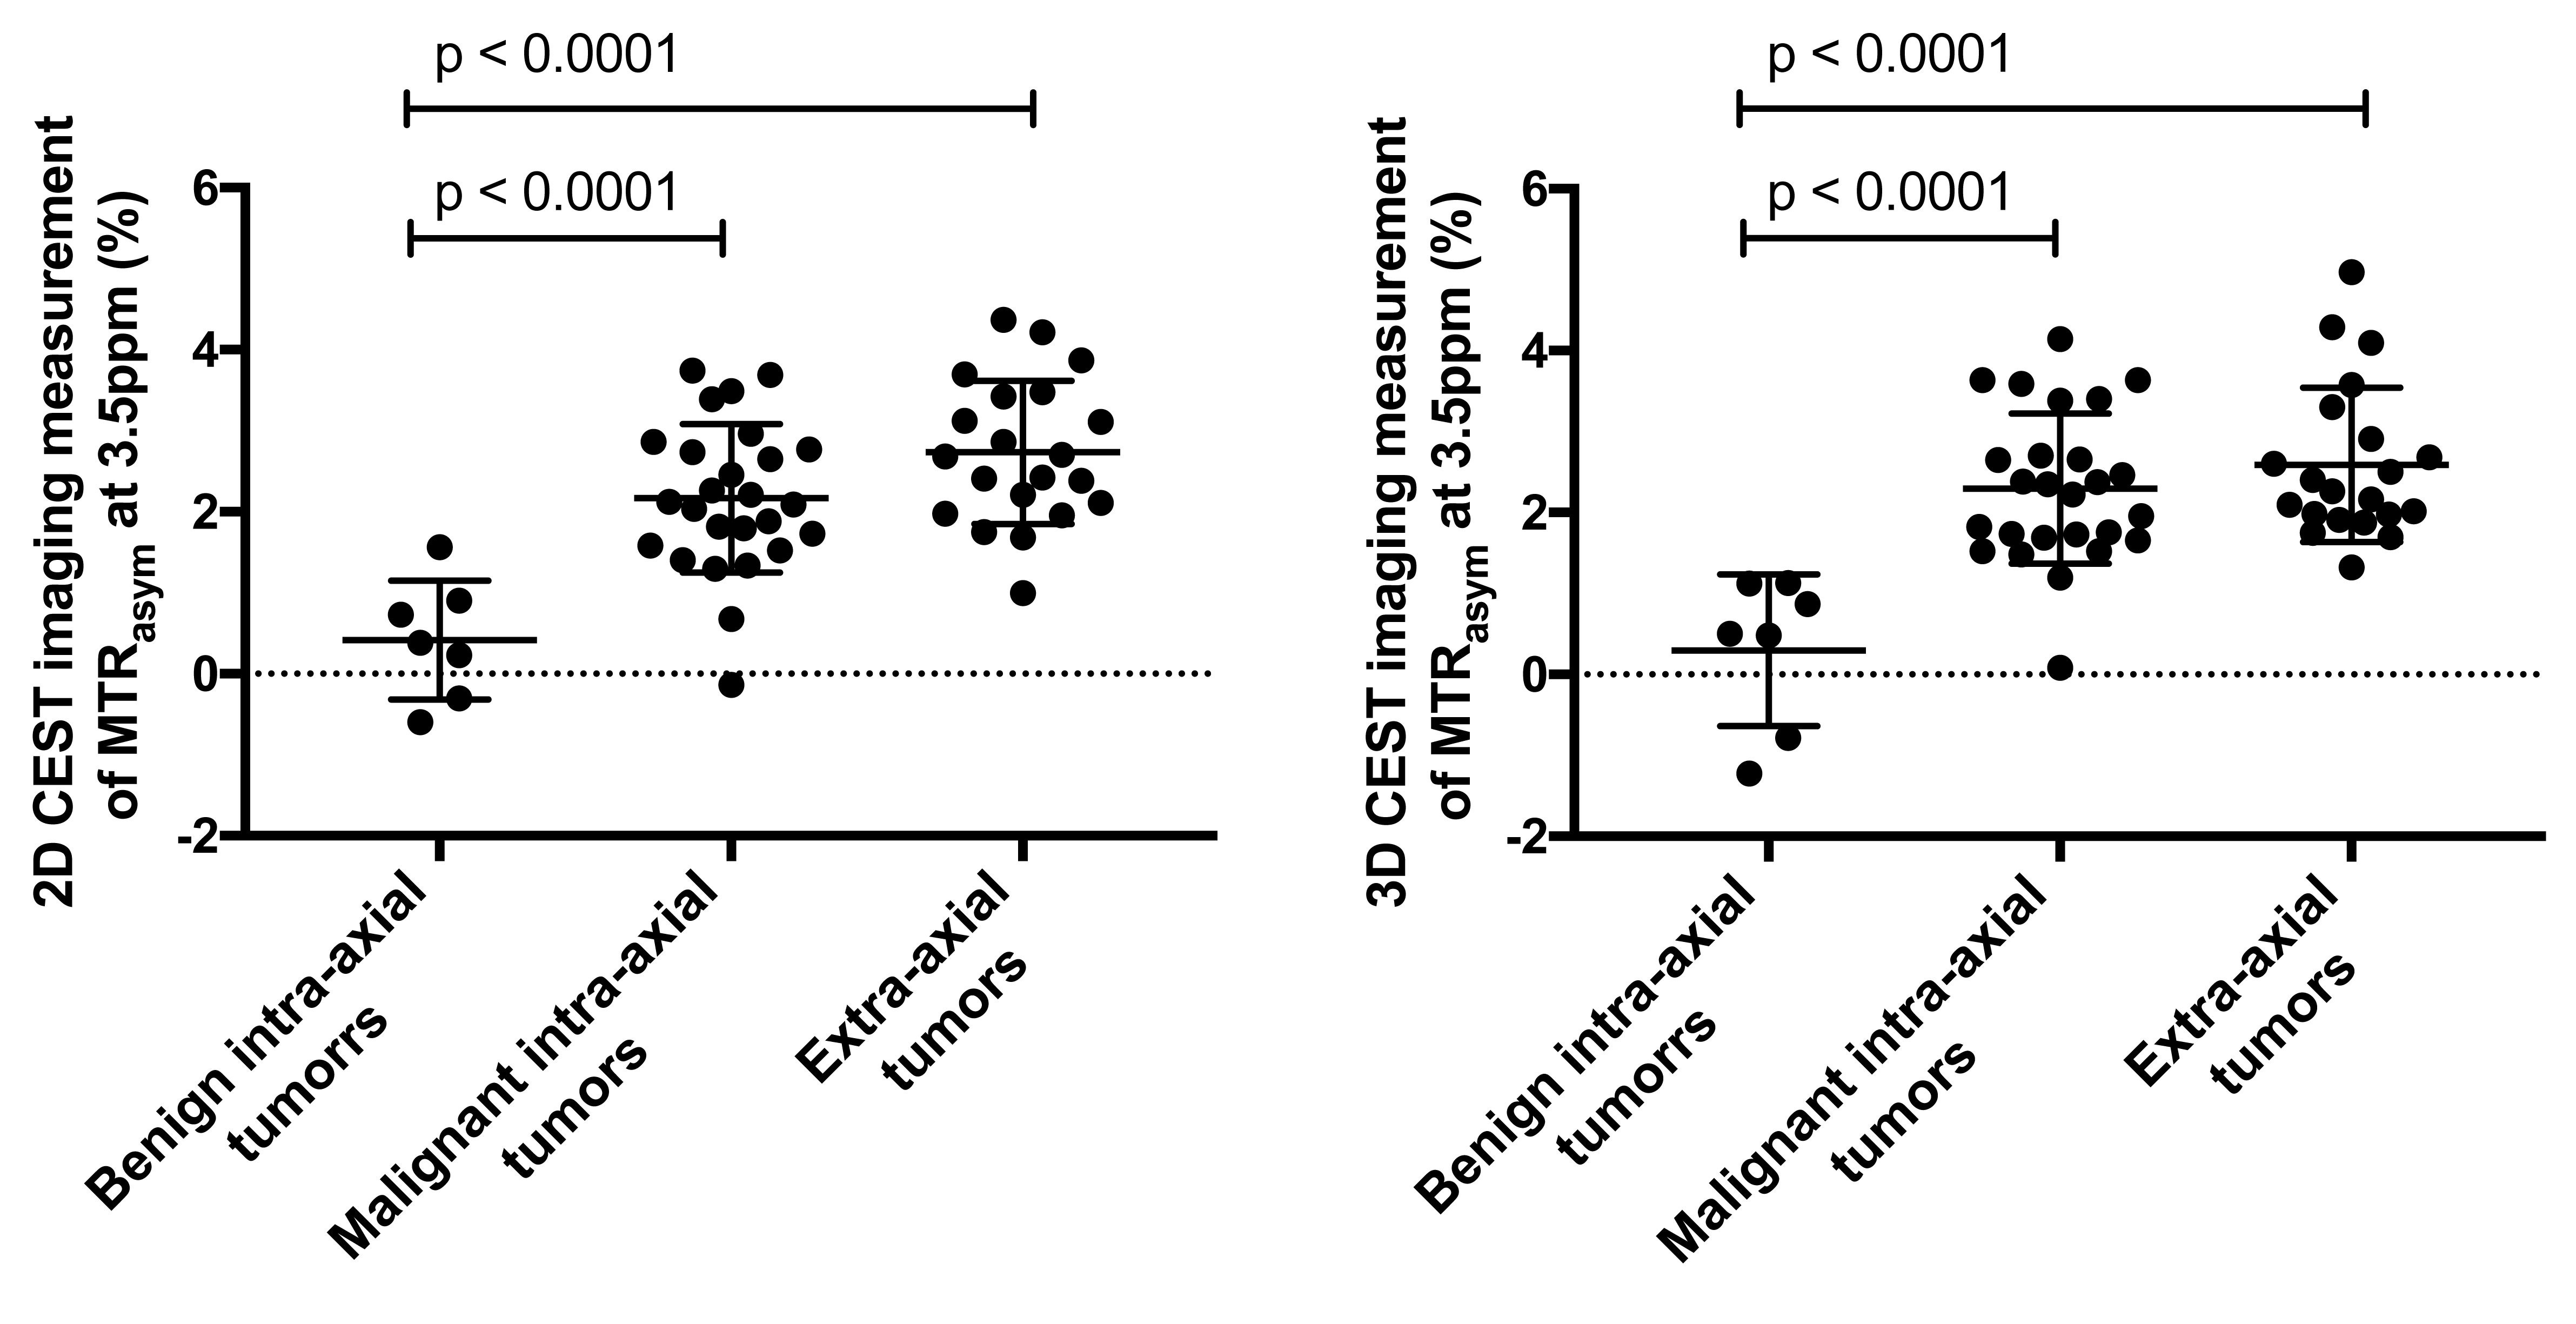
Figure 3. Results of comparison of benign and malignant intra-axial tumors and extra-axial tumors between 2D and 3D CEST imaging measurement of MTRasym (at 3.5 ppm) for all lesions.
MTRasym at 3.5 ppm had significant difference between benign intra-axial tumors and malignant intra-axial tumors (p<0.0001) and between benign intra-axial tumors and extra-axial tumors on both methods (p<0.0001).