3710
Differentiating PD and MSA-P with Neuromelanin and Iron Simultaneously Using a Single 3D Magnetization Transfer Sequence1Department of Radiology, Ruijin Hospital, Shanghai Jiao Tong University School of Medicine, Shanghai, China, 2Department of Radiology, Changshu Hospital Affiliated to Nanjing University of Chinese Medicine, Changshu, China, 3Wayne State University, Detroit, MI, United States, 4Department of Neurology, Ruijin Hospital, Shanghai Jiao Tong University School of Medicine, Shanghai, China
Synopsis
MSA with a parkinsonian variant (MSA-P) and PD share many common clinical presentations, such as parkinsonism and autonomic failure to mention just a few. The early differential diagnosis of these two disorders has been established more or less empirically despite a lack of a subjective, satisfactory biomarker. Neuroimaging has revolutionized in-vivo visualization of neuromelanin and iron in the substantial nigra (SN), which has been considered as the primary and predominant pathophysiological change in PD patients. We found significant neuromelanin changes in the SN in patients with MSA-P compared with PD and HC.
Introduction
Parkinson’s disease (PD) and multiple system atrophy (MSA) are devastating and deteriorating neurodegenerative diseases characterized by certain similar neuropathological impairments. They are both characterized by abnormal α-synuclein aggregation and propagation in the nigro-striatal pathway1. The clinical presentation of MSA is highly variable, so neurologists designate patients as having MSA-P if parkinsonian features predominate or MSA-C if cerebellar features predominate2. Many overlapping clinical manifestations between PD and MSA-P impose substantial challenges on clinicians to differentiate the two disorders especially in the early stage. Neuroimaging biomarkers of varying magnetic resonance imaging (MRI) modalities, such as T1 weighted (T1W)3, T2*W4 and diffusion5 weighted imaging have provided valuable information to assist clinical diagnosis. The pathological hallmark of PD is neuromelanin depigmentation followed by elevated iron deposition in the substantia nigra (SN)6. With the advent of quantitative MRI techniques, we can trace the disease-specified trait of the nigral iron deposition that contributes to the pathogenesis of α-synuclein-related movement disorders such as PD and MSA7,8. The aim of this study was to use a single 3D magnetization transfer contrast (MTC) sequence to simultaneously assess three metrics as complementary imaging biomarkers to distinguish PD and MSA-P patients: the NM volume (as measured on MTC), SN volume and susceptibility value (as measured with quantitative susceptibility mapping (QSM)).Methods
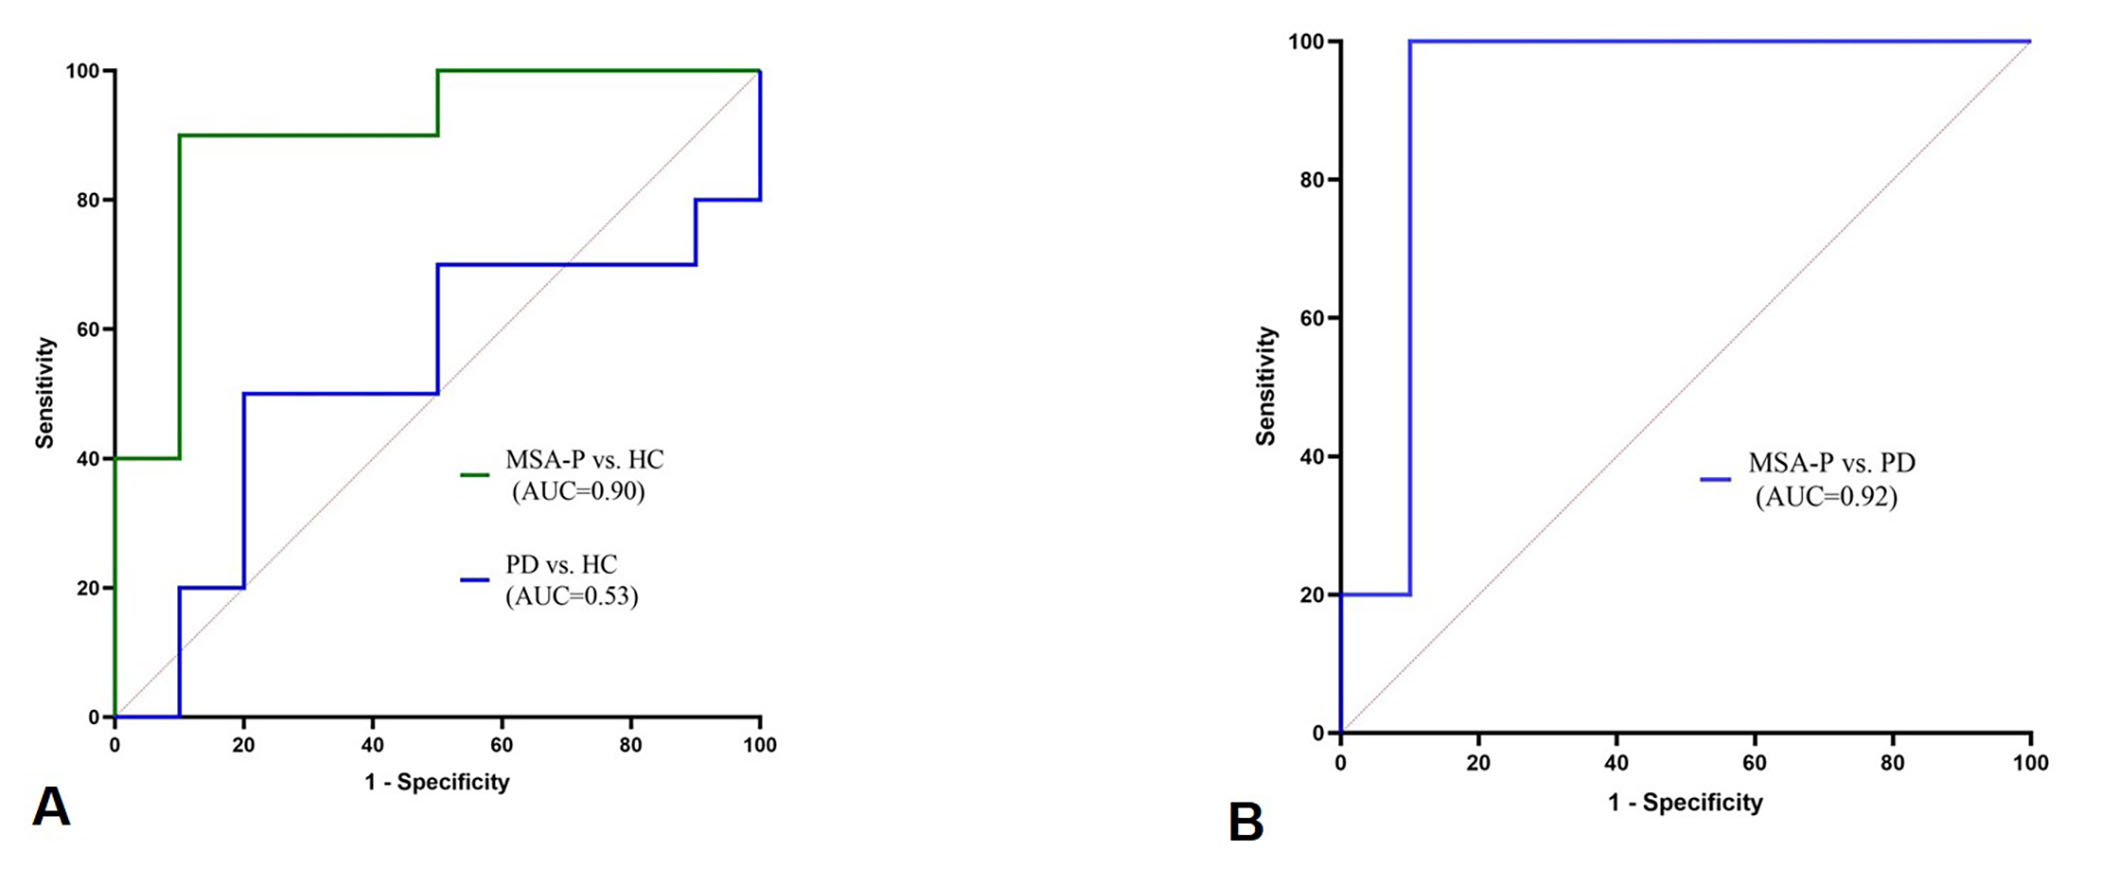
Three age- and gender-matched groups: 10 MSA-P patients, 10 PD patients and 10 healthy controls (HCs) were scanned on a 3T Philips MRI system with a 15-channel coil using a 3D multi-echo gradient recalled echo susceptibility weighted imaging (SWI) sequence with an MTC pulse. The imaging parameters were as follows: an in-plane resolution = 0.67 mm × 1.34 mm, seven echoes with TE1 = 7.5ms, ΔTE = 7.5ms, TR = 62ms, pixel bandwidth = 174Hz/pixel and slice thickness = 2mm.The regions of interest (ROIs) for the NM and SN were automatically segmented on MTC magnitude and QSM maps, respectively, using SPIN software (SpinTech, Inc., Bingham Farms, Ml, USA). Then we simultaneously measured NM volume on the MTC magnitude image (TE1= 7.5ms), SN volume and iron deposition on the QSM data extracted from the second echo (TE2= 15ms). Intergroup difference analysis was performed using GraphPad Prism Version 8.0. Furthermore, in order to assess the sensitivity and specificity of the proposed models to diagnose MSA-P and PD patients, a receiver operating curve (ROC) and area under the curve (AUC) analysis were performed using GraphPad Prism Version 8.0.Results
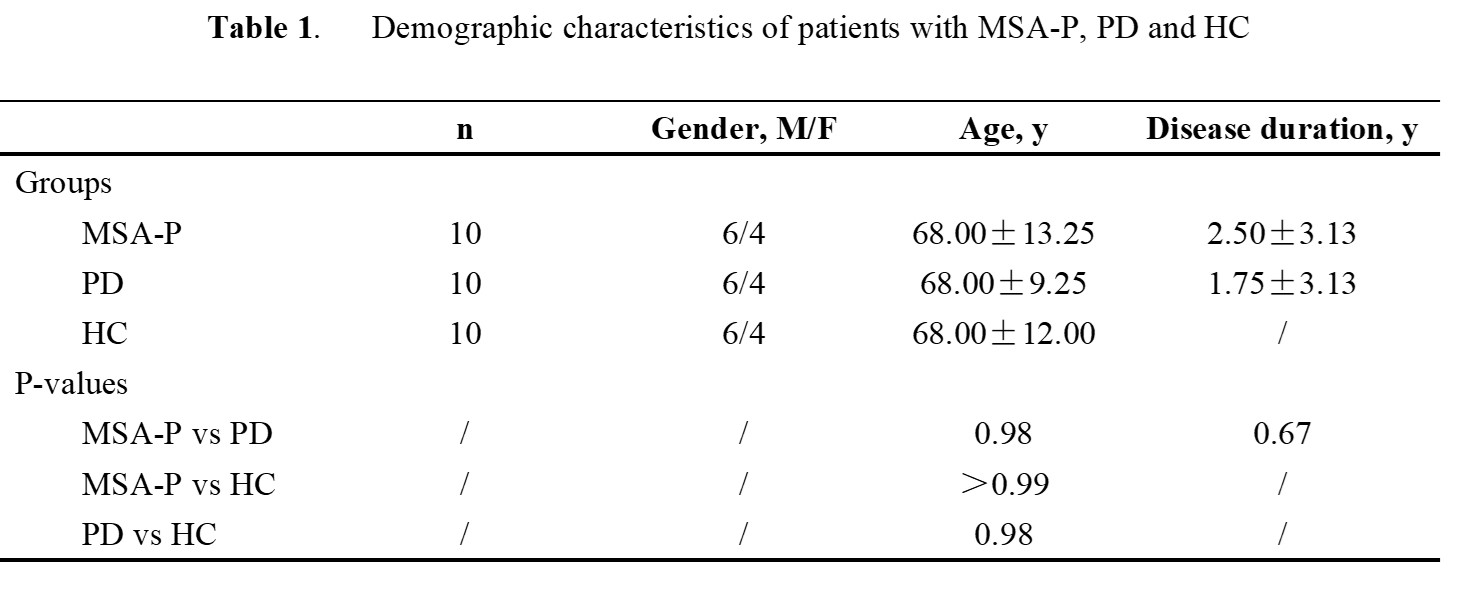
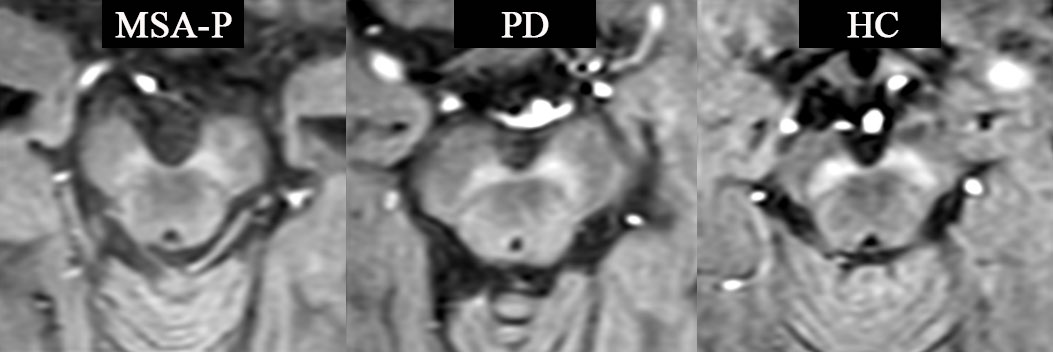
Table 1. shows the demographic characteristics of patients with MSA-P and age-, gender-matched PD and HC. There were no significant between-group differences in age, gender or disease duration. Figure 1. shows MTC magnitude images for patients with MSA-P, PD and HC. Judging from the MTC images, smaller NM volume compared with HC indicates NM depigmentation in MSA-P and PD patients, with MSA-P patients showing the worst NM degeneration. Overall NM volume, SN volume and QSM susceptibility (median ± interquartile range) of each VOI as well as comparisons among the different groups are listed in TABLE 2. The MSA-P patients had significantly smaller NM volume compared with the PD patients (p=0.0017) and HCs (p=0.0013). No significant differences were observed among the groups regarding the overall SN volume and susceptibility value. ROC analyses of diagnostic performance of NM overall volume between different groups are illustrated in Figure 2.Discussion and conclusion:
In this work, we have developed a new approach to visualize iron deposition and NM degeneration in-vivo using one single multi-echo SWI MTC sequence with the goal of searching for a comprehensive and robust set of imaging biomarkers for differential diagnosis between MSA-P and PD. To our knowledge, this is the first report of the utility of quantitative NM measurements (NM volume) to differentiate MSA-P and PD. We have demonstrated that this diagnostic biomarker can be obtained using a single rapid sequence in roughly 7 min in a standard clinical imaging with clinically useful diagnostic accuracy (with an AUC as high as 92%). However, no inter-group difference of iron-related was found among three groups. Therefore, a larger sample of MSA-P, PD patients and HCs are required to assess the NM and iron changes to confirm these findings prior to clinical application.Acknowledgements
No acknowledgement foundReferences
1. Krismer F, Wenning GK. Multiple system atrophy: insights into a rare and debilitating movement disorder. Nat Rev Neurol. Apr 2017;13(4):232-243.
2. Gilman S, Low PA, Quinn N, et al. Consensus statement on the diagnosis of multiple system atrophy. J Neurol Sci. Feb 1 1999;163(1):94-98.
3. Messina D, Cerasa A, Condino F, et al. Patterns of brain atrophy in Parkinson's disease, progressive supranuclear palsy and multiple system atrophy. Parkinsonism & related disorders. Mar 2011;17(3):172-176.
4. Lee JH, Han YH, Kang BM, Mun CW, Lee SJ, Baik SK. Quantitative assessment of subcortical atrophy and iron content in progressive supranuclear palsy and parkinsonian variant of multiple system atrophy. Journal of neurology. Aug 2013;260(8):2094-2101.
5. Nicoletti G, Lodi R, Condino F, et al. Apparent diffusion coefficient measurements of the middle cerebellar peduncle differentiate the Parkinson variant of MSA from Parkinson's disease and progressive supranuclear palsy. Brain : a journal of neurology. Oct 2006;129(Pt 10):2679-2687.
6. Zucca FA, Segura-Aguilar J, Ferrari E, et al. Interactions of iron, dopamine and neuromelanin pathways in brain aging and Parkinson's disease. Progress in neurobiology. Aug 2017;155:96-119.
7. Dexter DT, Carayon A, Javoy-Agid F, et al. Alterations in the levels of iron, ferritin and other trace metals in Parkinson's disease and other neurodegenerative diseases affecting the basal ganglia. Brain : a journal of neurology. Aug 1991;114 ( Pt 4):1953-1975.
8. Berg D, Hochstrasser H. Iron metabolism in Parkinsonian syndromes. Movement disorders : official journal of the Movement Disorder Society. Sep 2006;21(9):1299-1310.
Figures
Data are presented as median ± interquartile range unless otherwise noted.
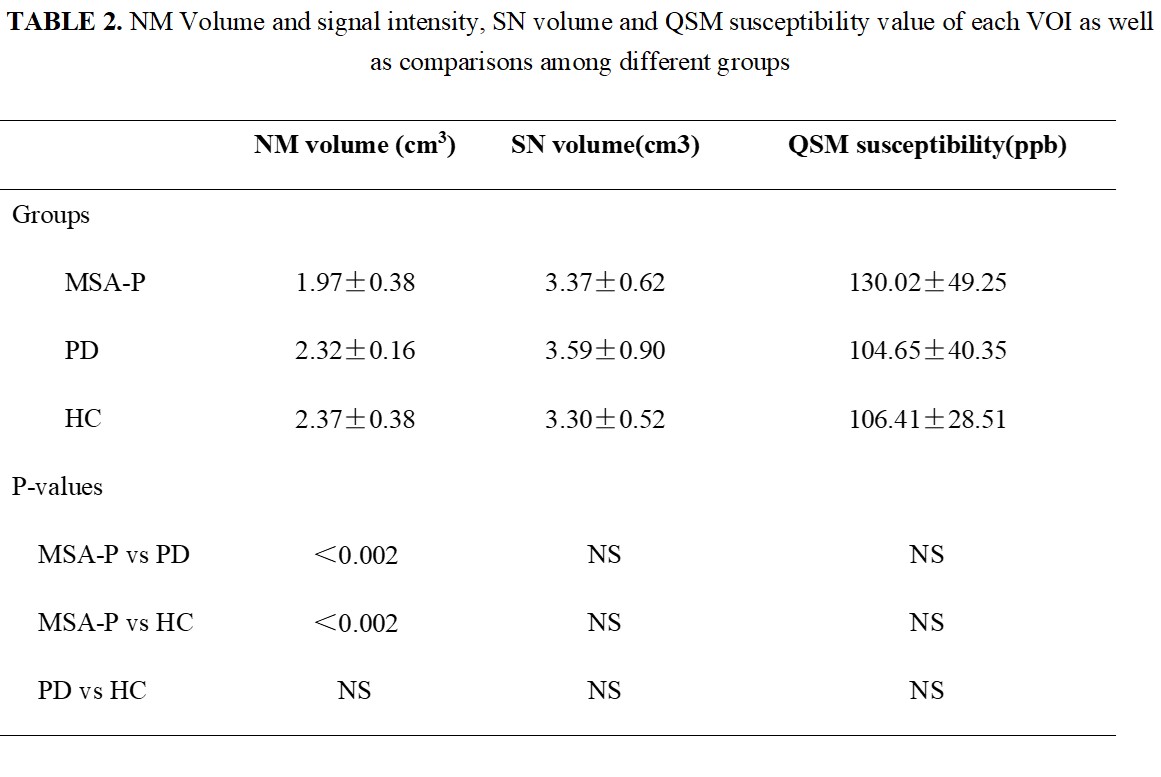
Data are presented as median ± interquartile range unless otherwise noted. Abbreviation: NS, not significant