3709
Differentiation of Radiation Necrosis from Tumor Progression in Brain Metastasis Treated with Stereotactic Radiosurgery using CEST at 3T1Physical Sciences, Sunnybrook Research Institute, Toronto, ON, Canada, 2Department of Radiation Oncology, Sunnybrook Health Sciences Centre, Toronto, ON, Canada, 3Medical Biophysics, Sunnybrook Research Institute, Toronto, ON, Canada, 4Department of Neurosurgery and Pediatric Neurosurgery, Medical University, Lublin, Poland
Synopsis
Stereotactic radiosurgery (SRS) is the standard of care treatment for patients with limited brain metastases; however radiation necrosis can develop. Standard clinical approaches have limited ability in differentiating radiation-induced changes from tumor progression. This work examines the performance of CEST metrics (MTRAmide and MTRrNOE) at 3T for differentiating radiation necrosis from tumor progression, extending a previous study to include higher saturation power (using B1=2.0μT) with added multivariable logistic regression. Results in 24 lesions showed that both saturation powers (0.52μT and 2.0μT) could distinguish tumor progression from radiation necrosis, with the MTRAmide(0.52μT) parameter selected from multivariable modelling with AUC=0.91.
Introduction
Brain metastases occur in 20-40% of patients with systemic cancers1,2. Treatment with stereotactic radiosurgery (SRS) involves delivering a high dose of radiation focally to the tumor as a single dose or in a few fractions. Although SRS with whole brain radiotherapy (WBRT) improves survival for patients with a single unresectable brain metastasis compared to WBRT alone3, radiation-induced morphological changes can develop after SRS, with radiation necrosis being reported in up to 22% of all patients4. Standard clinical approaches have limited ability in differentiating radiation-induced changes from tumor progression at the time of presentation of an enhancing lesion and often requires waiting months to determine if a lesion will eventually progress or subside5-7. Identification of imaging biomarkers to distinguish tumor progression from radiation necrosis at early time points would help to guide clinical management. Amide proton transfer (APT) chemical exchange saturation transfer (CEST)8,9 is an exchange-based technique that can indirectly detect amide protons of endogenous proteins and peptides in low concentrations10,11. APT CEST and relayed nuclear Overhauser effect (rNOE) contrast12 have shown promising results for differentiating radiation necrosis from tumor progression in preclinical studies13, human glioma14 and brain metastasis patients15. Our previous study15 for brain metastases had used a low saturation power of 0.52μT, which was noted to be lower than the recommended RF power for APT measurements14,15. Here, we examined the performance of CEST MRI including a higher B1 power of 2.0μT and also used multivariable modelling to determine if the parameters can differentiate between radiation necrosis and tumor progression in brain metastases.Methods
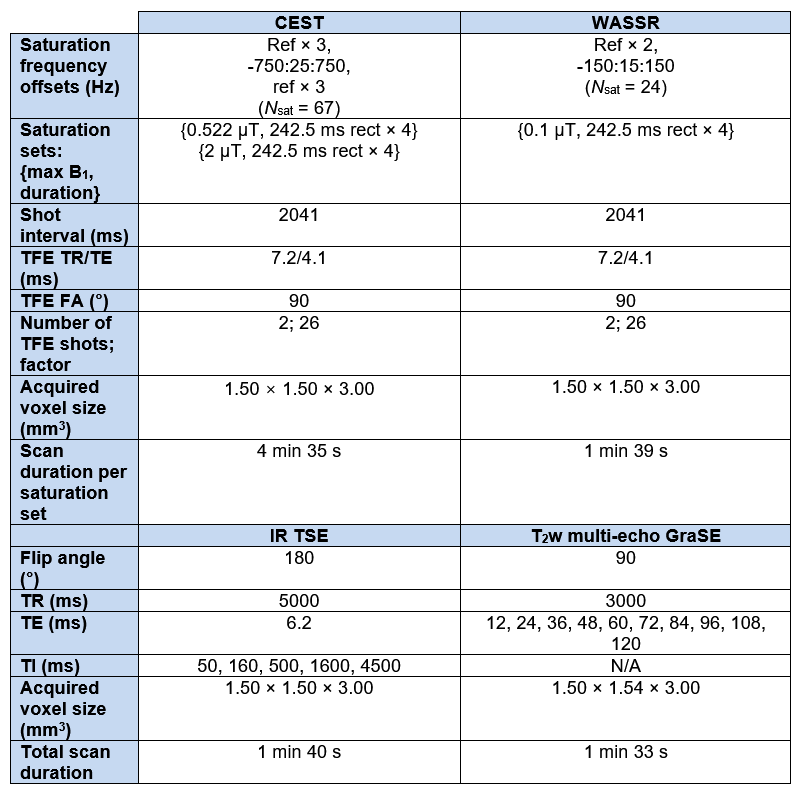
Study Design: The study was approved by the institutional research ethics board and informed consent was obtained for all patients. Eligibility criteria included brain metastases patients treated with SRS (either single fraction or hypo-fractionated) and who had an enhancing region (equal or larger in size from the latest follow-up scan) in the post-gadolinium T1 weighted (T1C) MRI scan. Clinical outcomes of radiation necrosis or tumor progression were determined at least 6 months following CEST imaging, by expert neuro-oncologists combining information on the clinical course and evaluation of volume change on subsequent MRIs.MR Imaging: Figure 1 shows MR imaging parameters used on the 3T Philips Achieva with an 8-channel head coil. RF saturation for CEST used frequency offsets between ±5.9ppm, 4 block pulses (242.5ms duration each, separated by 2.5ms gaps) with nominal B1=0.52μT (repeated twice) and B1=2.0μT. A single slice was acquired axially through the largest cross section of the tumor. Image Analysis: The T1C and FLAIR images were co-registered to the CEST image acquired at the reference frequency offset (~780ppm). Enhancing tumor ROIs were drawn on the corresponding T1C image and overlaid onto the CEST image for quantification. Voxelwise computation of MTRAmide and MTRrNOE was performed after correction of B0, which was determined from the WAter Saturation Shift Referencing (WASSR) sequence16. The amplitude of this spectrum for amide CEST (3.5ppm) and aliphatic rNOE (-3.5ppm) were used for computing the CEST MTRAmide and MTRrNOE metrics15. Image analysis used MATLAB (R2018b).
Statistical Analysis: Parameter value differences between necrosis and tumor ROIs were compared using Wilcoxon rank-sum tests, with Bonferroni adjustment. Multivariable logistic regression with backward variable selection was used to identify the parameter(s) independently predictive of tumor progression using a p-value threshold of 0.05. Statistical analysis used R (v4.0.2x64).
Results
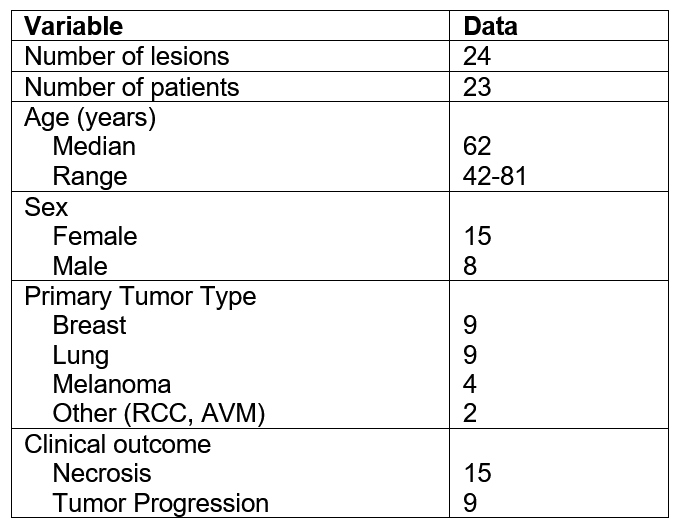
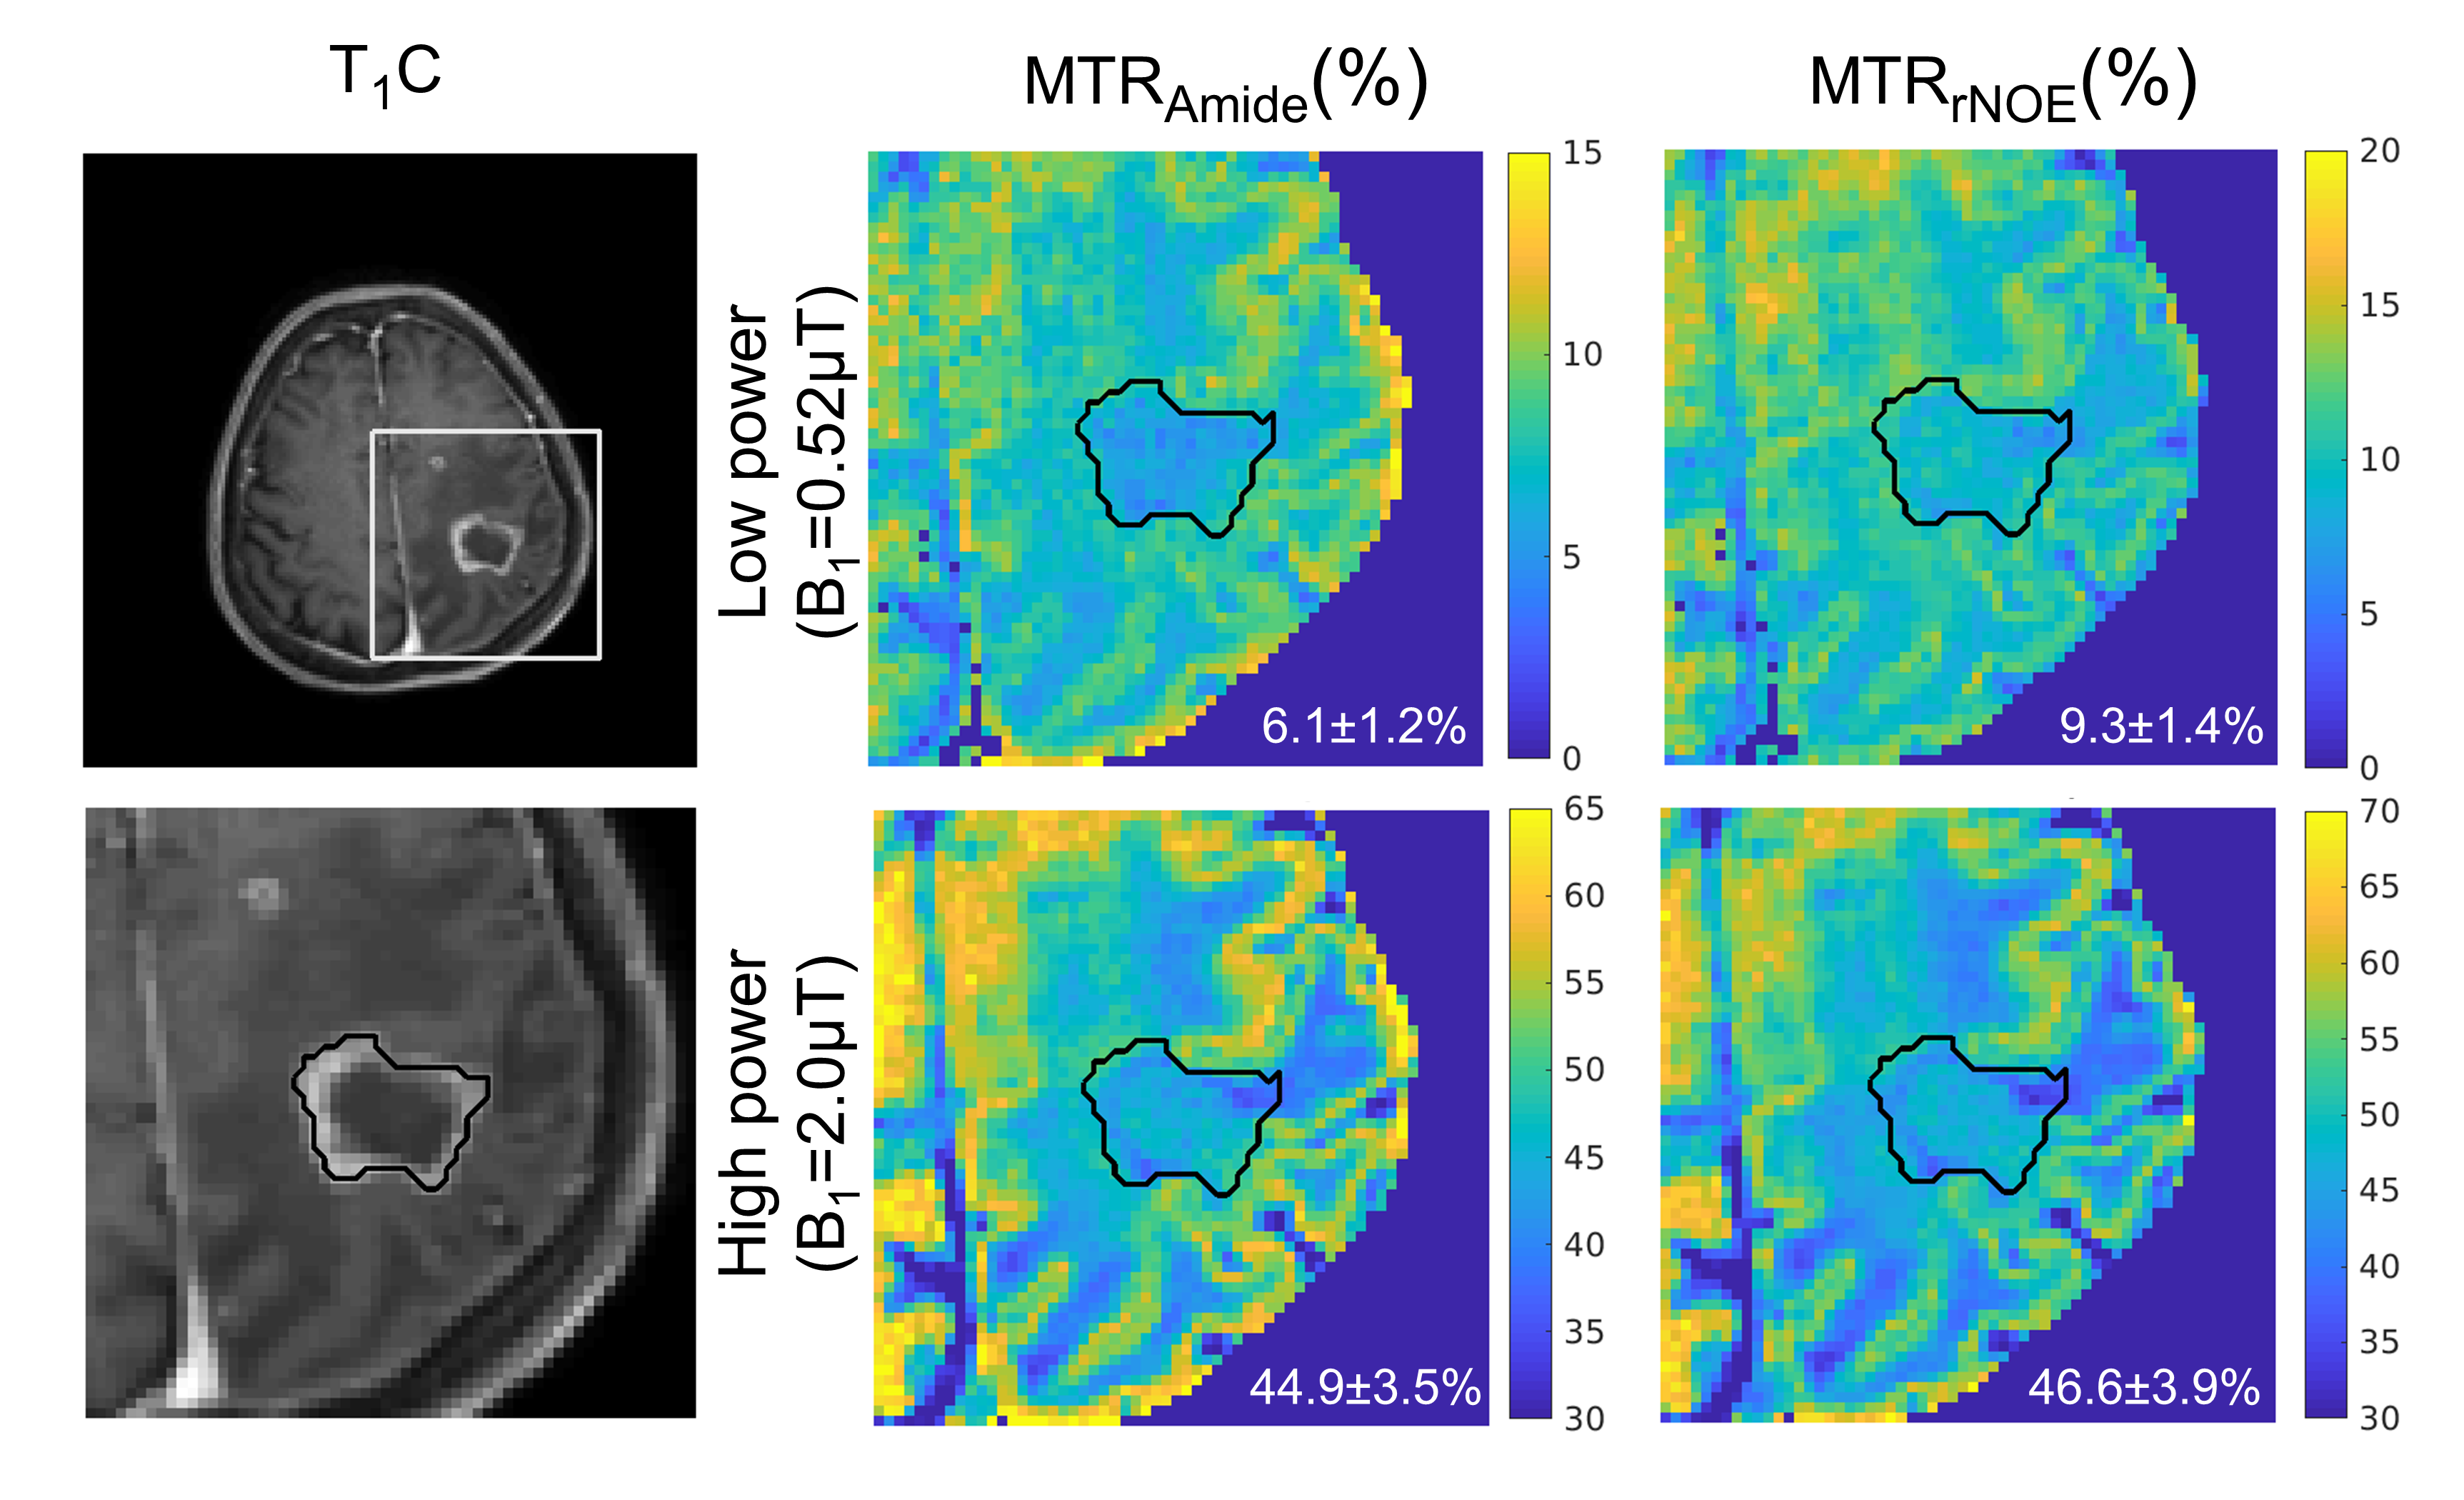
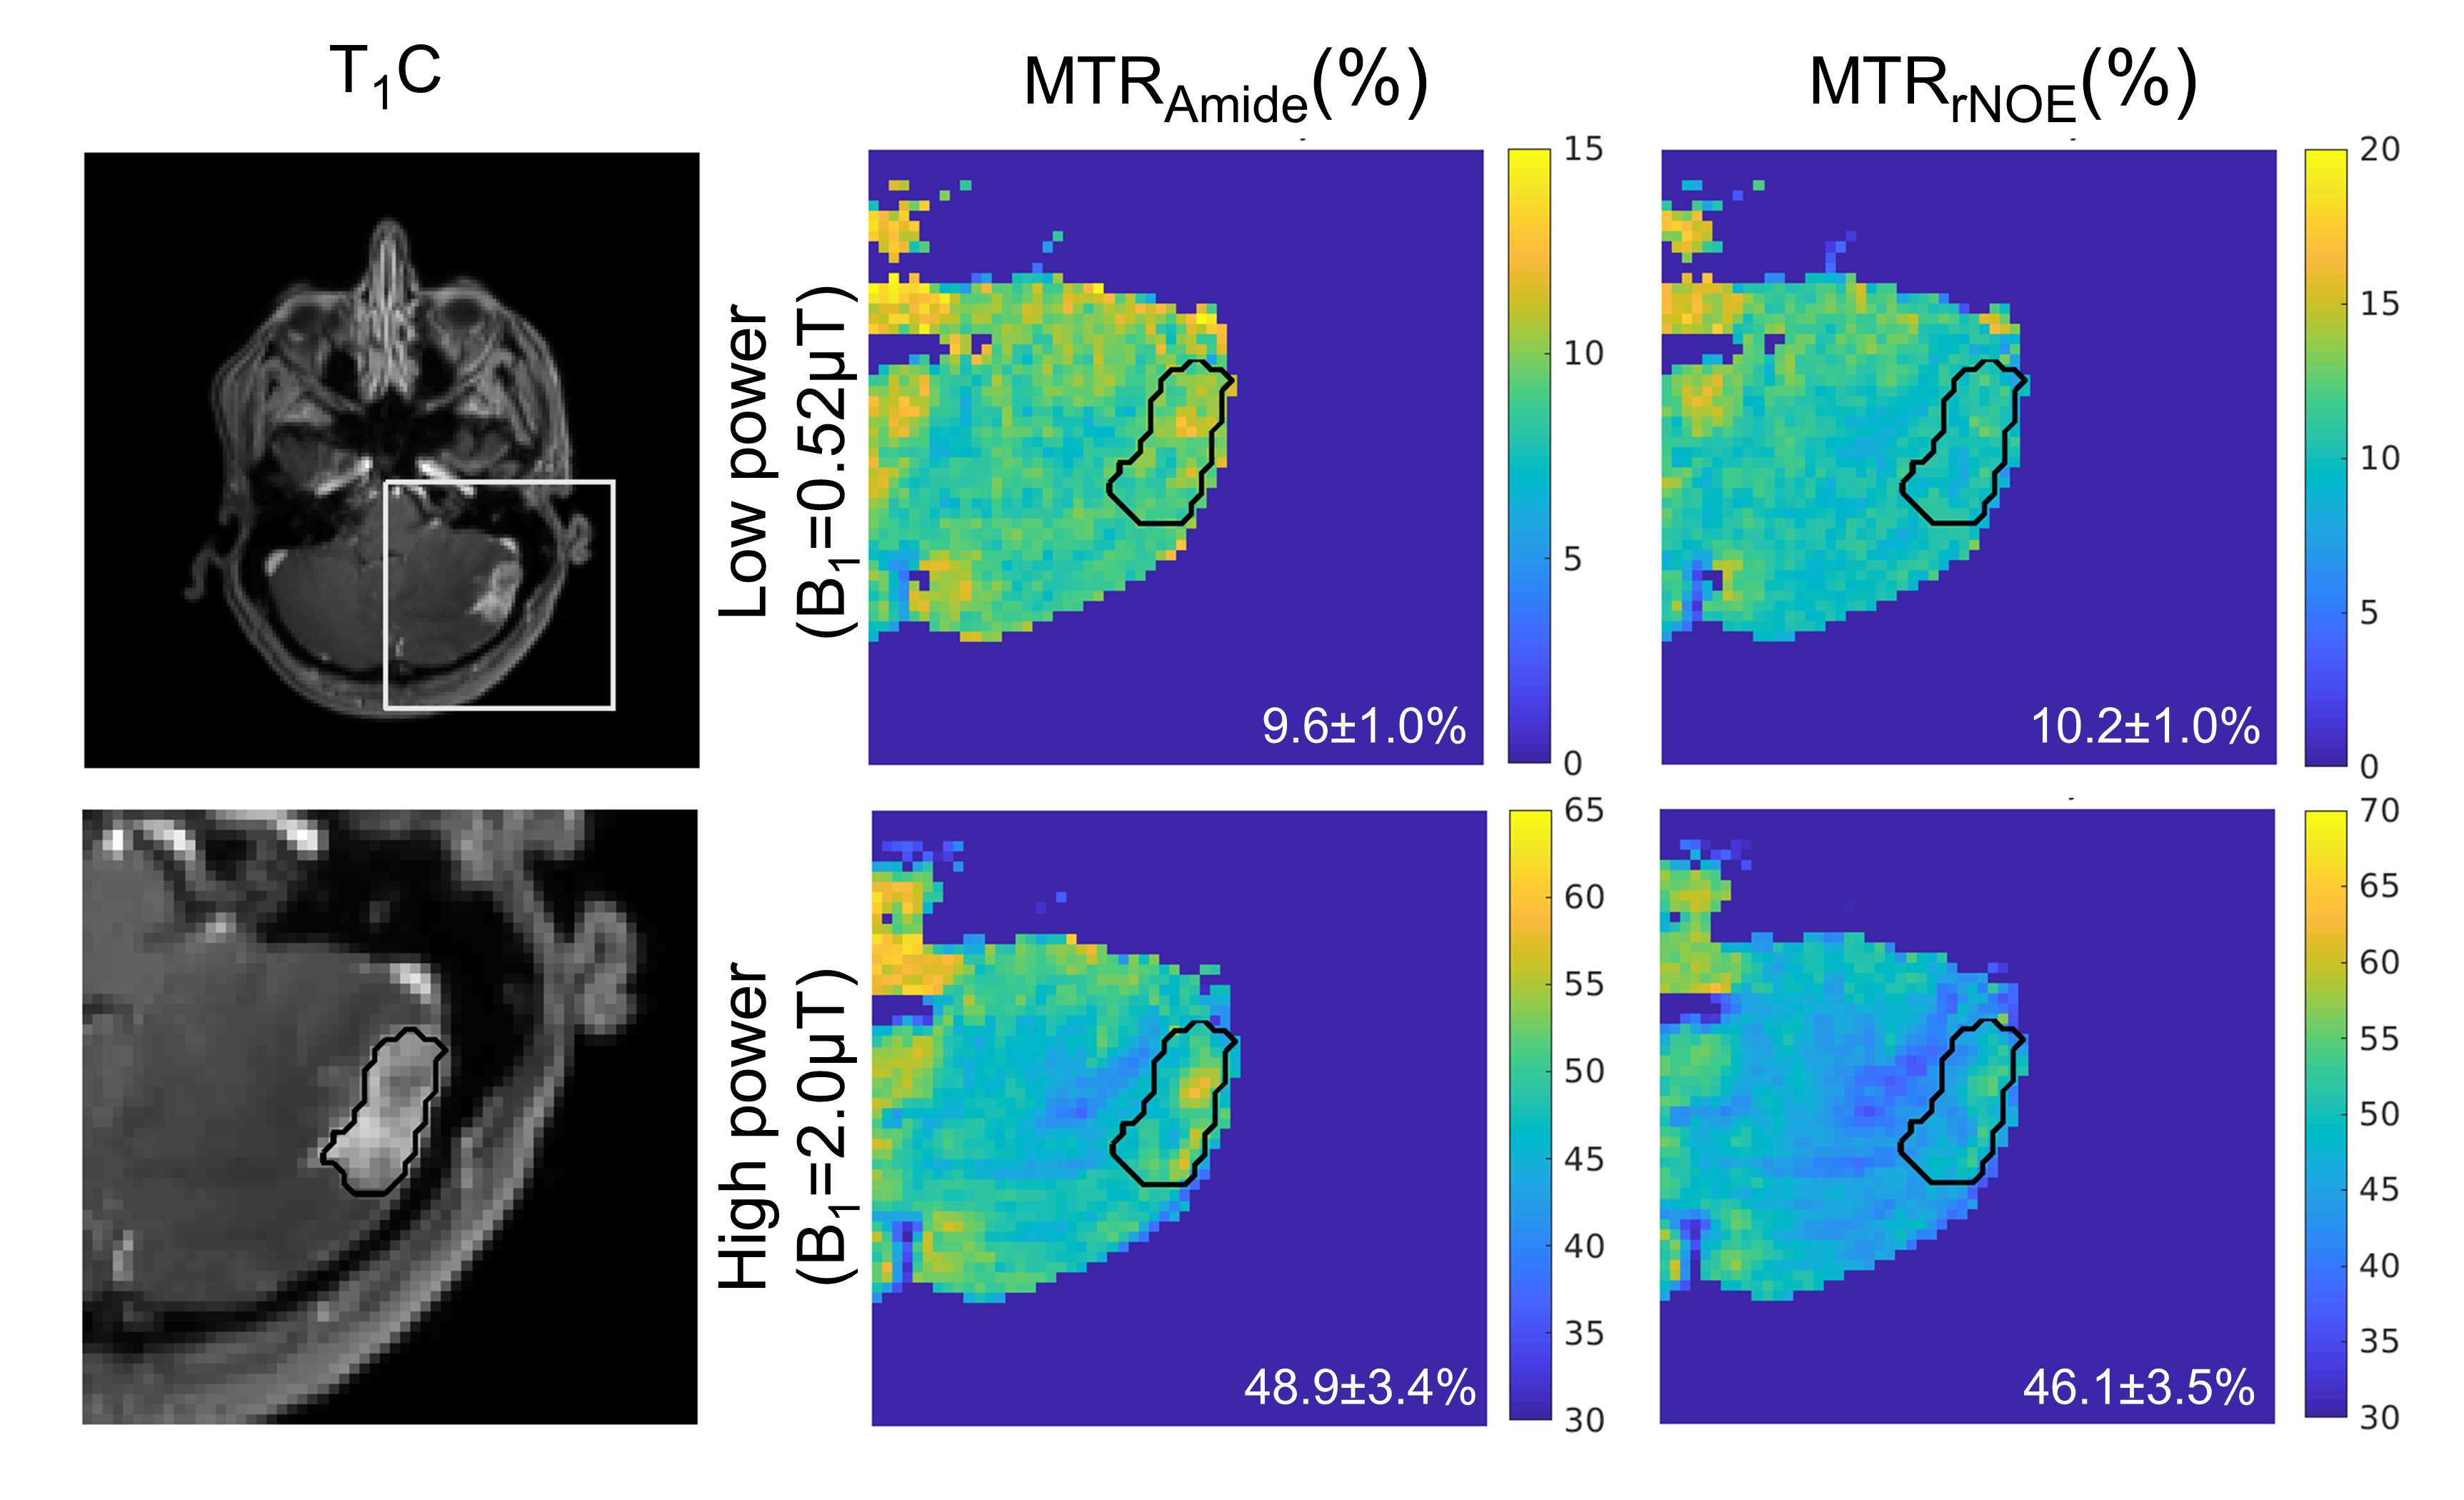
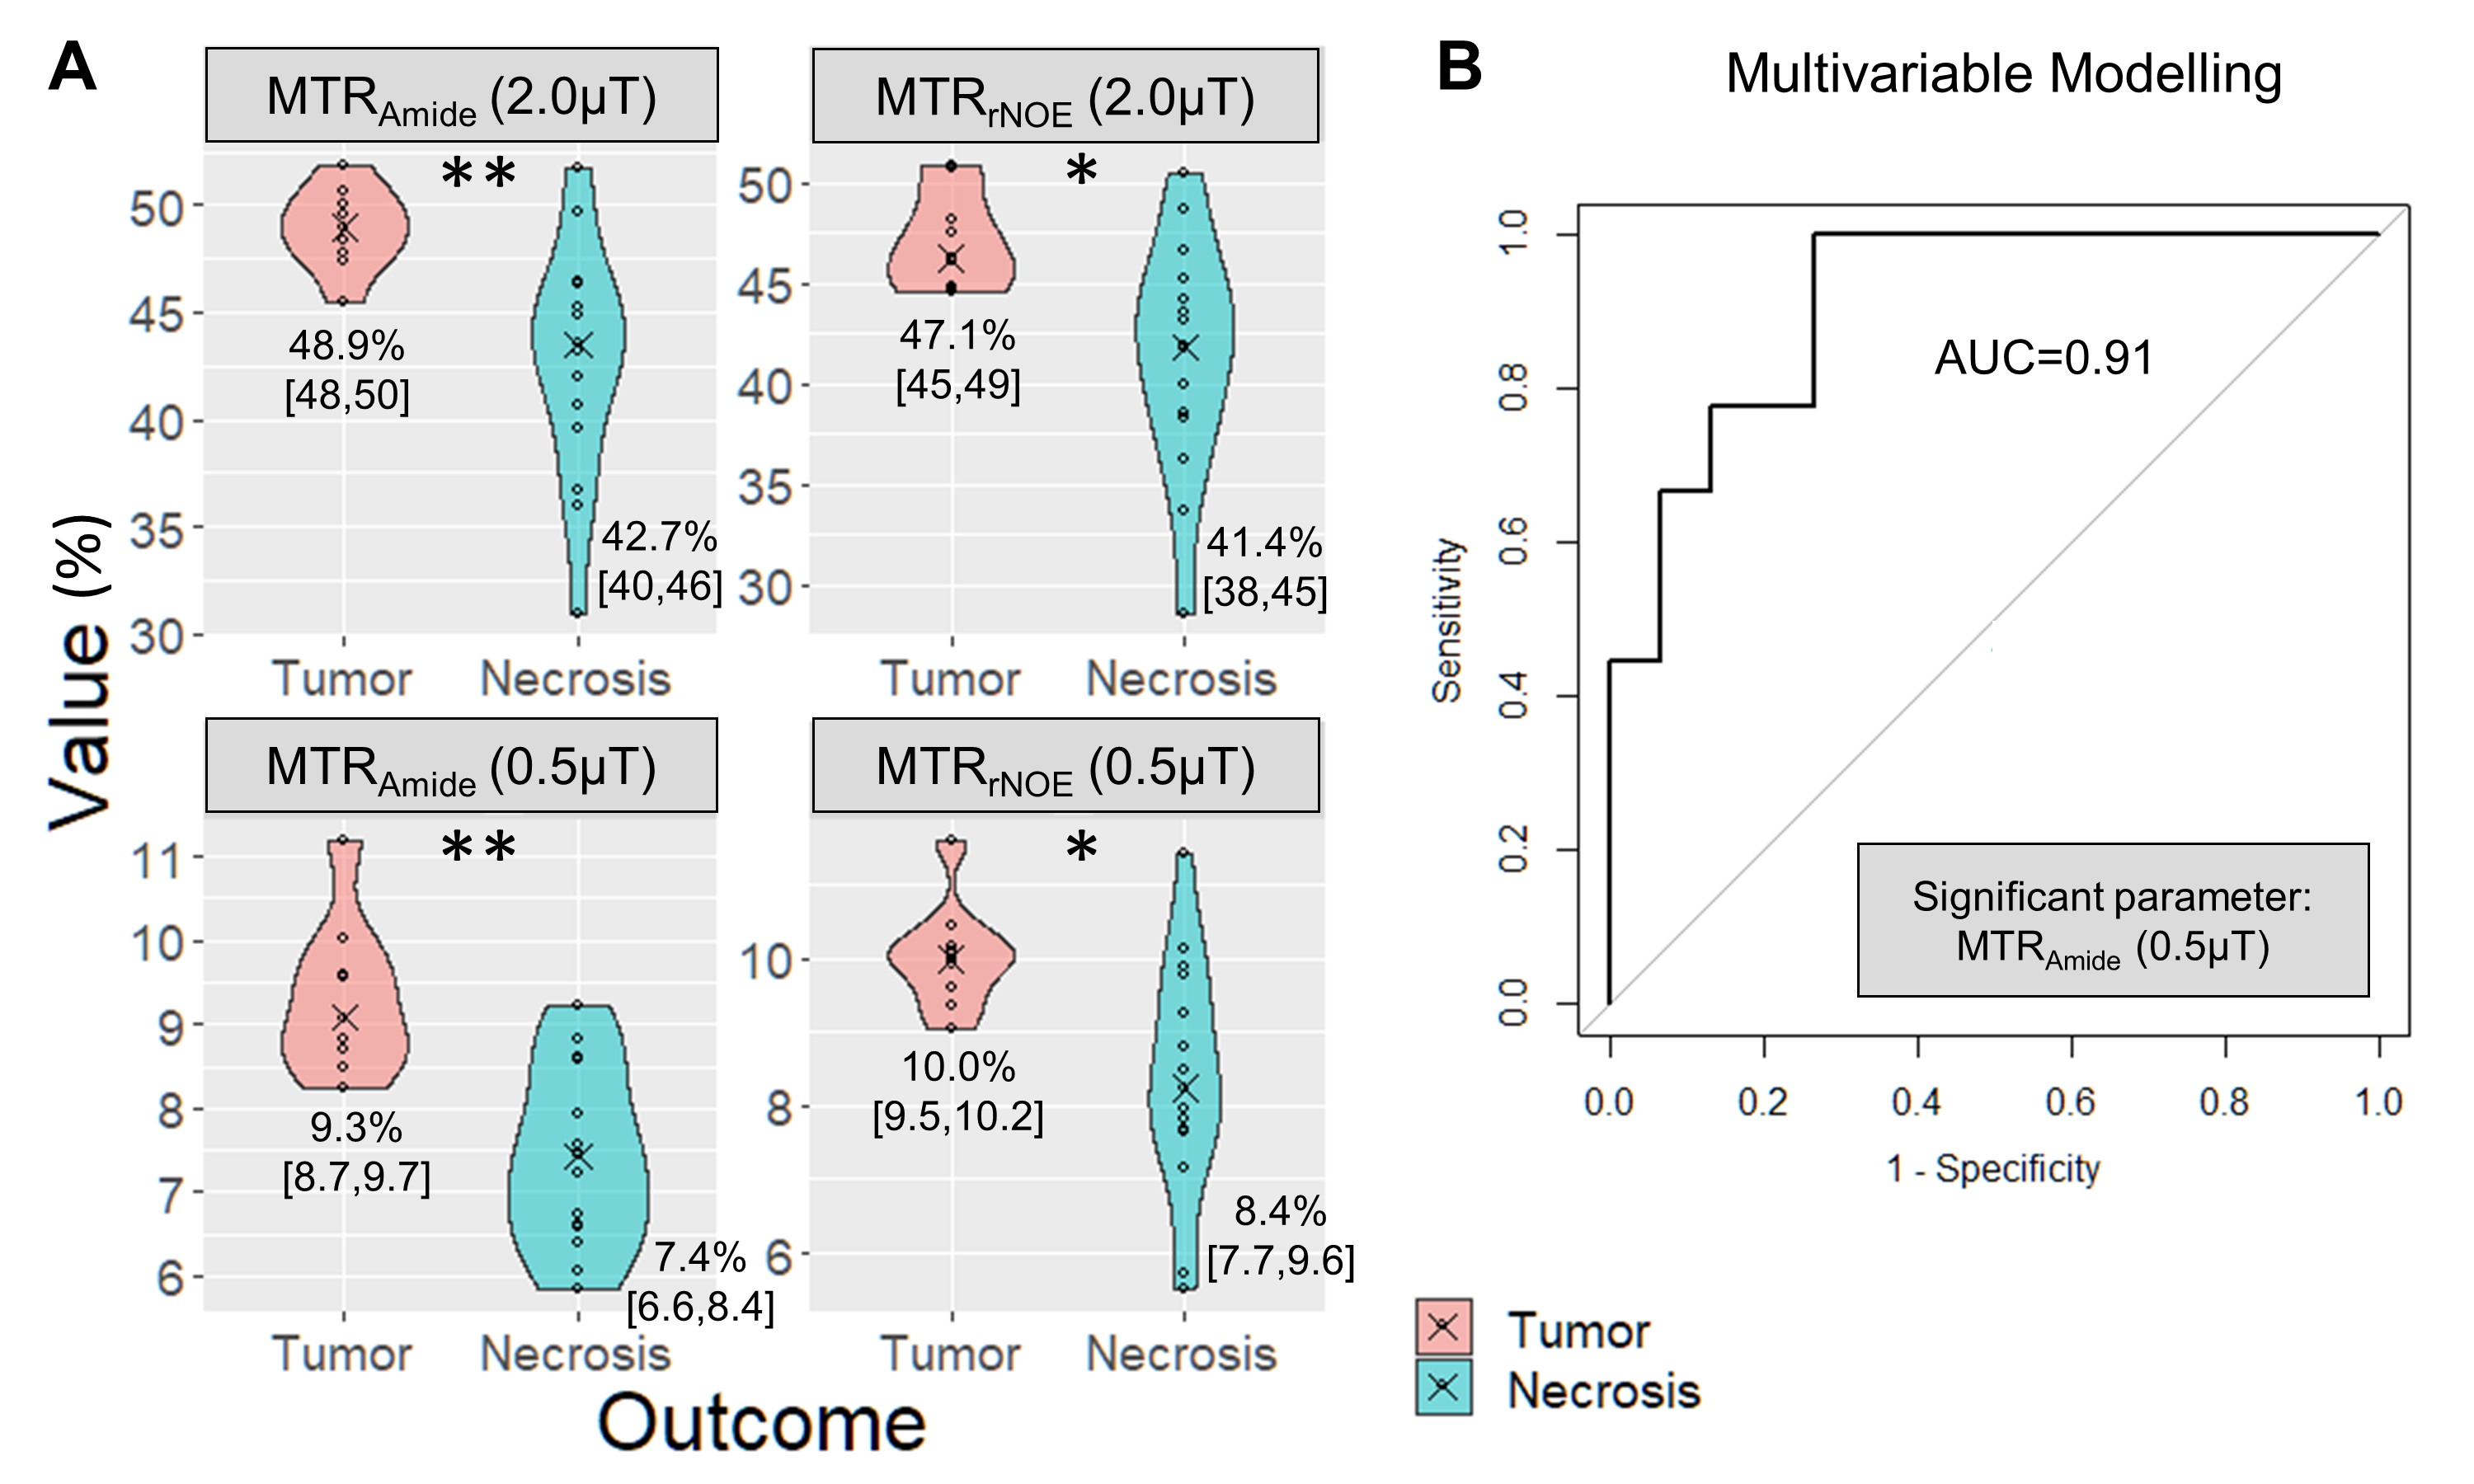
There were 24 lesions (from 23 subjects) after exclusion of 4 subjects (due to small lesion size, re-treatment prior to imaging, indeterminate clinical outcome and one unusable map). Nine lesions were clinically determined to be tumor and 15 lesions were radiation necrosis. Patient characteristics are shown in Figure 2. Figure 3 shows four CEST parameter maps (MTRAmide and MTRrNOE, for each B1 power) quantified for a subject with confirmed tumor progression. Figure 4 shows the maps for a subject with radiation necrosis. Violin plots for each cohort and map are shown in Figure 5A. Based on Wilcoxon tests, significant differences were found for all maps (adjusted p<0.01 for amide, p<0.05 for rNOE). Multivariable modelling selected one significant parameter, MTRAmide(0.52μT), which predicted tumor outcome with AUC=0.91 (Figure 5B).Discussion
The amide MTR maps had better separation than rNOE based on adjusted p-values. Although both high (2.0μT, as in a previous glioma study14) and low saturation powers (and 0.52μT as in a previous brain metastasis study15) could be used for distinguishing tumor progression from radiation necrosis (as all were significant based on individual parameter differences), multivariable logistic modelling selected the low-power amide parameter. Future work will involve characterizing additional CEST parameters (e.g., asymmetry, AREX17) and comparisons with histopathology-based outcomes and other advanced imaging techniques.Conclusion
CEST MTRAmide and MTRrNOE metrics show promise for distinguishing tumor progression from radiation necrosis. Both high and low powers are able to differentiate between the two conditions with the MTRAmide(0.52μT) parameter resulting in the highest AUC of 0.91 based on multivariable modelling.Acknowledgements
Rachel Chan and Hatef Mehrabian were equal contributors in this work. We thank all the MR radiation therapists who were involved in scanning. We gratefully acknowledge the following sources of funding: Terry Fox Research Institute; Canadian Institutes of Health Research; Canadian Cancer Society Research Institute.References
1. Cairncross JG, Kim J-H, Posner JB. Radiation therapy for brain metastases. Ann Neurol 1980;7:529–541.
2. Patchell RA. The management of brain metastases. Cancer Treat Rev 2003;29:533–540.
3. Andrews DW, Scott CB, Sperduto PW, et al. Whole brain radiation therapy with or without stereotactic radiosurgery boost for patients with one to three brain metastases: phase III results of the RTOG 9508 randomised trial. Lancet 2004;363:1665–1672.
4. Hoefnagels FWA, Lagerwaard FJ, Sanchez E, et al. Radiological progression of cerebral metastases after radiosurgery: assessment of perfusion MRI for differentiating between necrosis and recurrence. J Neurol 2009;256:878–887.
5. Huber PE, Hawighorst H, Fuss M, van Kaick G, Wannenmacher MF, Debus J. Transient enlargement of contrast uptake on MRI after linear accelerator (linac) stereotactic radiosurgery for brain metastases. Int J Radiat Oncol 2001;49:1339–1349.
6. Ross DA, Sandler HM, Balter JM, Hayman JA, Archer PG, Auer DL. Imaging changes after stereotactic radiosurgery of primary and secondary malignant brain tumors. J Neurooncol 2002;56:175–181.
7. Varlotto
JM, Flickinger JC, Niranjan A, Bhatnagar A, Kondziolka D, Lunsford LD. The
impact of whole-brain radiation therapy on the long-term control and morbidity
of patients surviving more than one year after gamma knife radiosurgery for
brain metastases. Int J Radiat Oncol 2005;62:1125–1132.
8. Forsén S, Hoffman RA. Study of Moderately Rapid Chemical Exchange Reactions by Means of Nuclear Magnetic Double Resonance. J Chem Phys 1963;39:2892–2901.
9. Ward KM, Aletras AH, Balaban RS. A New Class of Contrast Agents for MRI Based on Proton Chemical Exchange Dependent Saturation Transfer (CEST). J Magn Reson 2000;143:79–87.
10. Ling W, Regatte RR, Navon G, Jerschow A. Assessment of glycosaminoglycan concentration in vivo by chemical exchange-dependent saturation transfer (gagCEST). Proc Natl Acad Sci U S A 2008;105:2266–2270.
11. Zhou J, Payen J-F, Wilson DA, Traystman RJ, van Zijl PCM. Using the amide proton signals of intracellular proteins and peptides to detect pH effects in MRI. Nat Med 2003;9:1085–1090.
12. Zhou J, Lal B, Wilson DA, Laterra J, van Zijl PCM. Amide Proton Transfer (APT) Contrast for Imaging of Brain Tumors. Magn Reson Med 2003;50:1120–1126.
13. Zhou J, Tryggestad E, Wen Z, et al. Differentiation between glioma and radiation necrosis using molecular magnetic resonance imaging of endogenous proteins and peptides. Nat Med 2011;17:130–134.
14. Zhou J, Zhu H, Lim M, et al. Three-dimensional amide proton transfer MR imaging of gliomas: Initial experience and comparison with gadolinium enhancement. J Magn Reson Imaging 2013;38:1119–1128.
15. Mehrabian H, Desmond KL, Soliman H, Sahgal A, Stanisz GJ. Differentiation between Radiation Necrosis and Tumor Progression Using Chemical Exchange Saturation Transfer. Clin Cancer Res 2017;23:3667–3675.
16. Kim M, Gillen J, Landman BA, Zhou J, van Zijl PCM. Water saturation shift referencing (WASSR) for chemical exchange saturation transfer (CEST) experiments. Magn Reson Med 2009;61:1441–1450.
17. Zaiss M, Windschuh J, Paech D, Meissner JE, Burth S, Schmitt B, Kickingereder P, Wiestler B, Wick W, Bendszus M, Schlemmer HP. Relaxation-compensated CEST-MRI of the human brain at 7 T: unbiased insight into NOE and amide signal changes in human glioblastoma. Neuroimage. 2015 May 15;112:180-8.
Figures