3708
CEST imaging with neural network fitting of the human brain at 3T1Shanghai Key Laboratory of Magnetic Resonance, School of Physics and Electronic Science, East China Normal University, Shanghai, China, 2Institute of Imaging Science, Vanderbilt University, Nashville, TN, United States, 3MR Collaboration NE Asia, Siemens Healthcare, Shanghai, China, 4Department of Radiology, Renji Hospital affiliated to Shanghai Jiao Tong University Medical College, Shanghai, China
Synopsis
Chemical exchange saturation transfer (CEST) imaging shows great potential in clinical application. Separating the nuclear Overhauser enhancement (NOE) and amide proton transfer (APT) effects properly is highly valuable for clinical application of CEST. In this study, the background Z-spectra including only the magnetization transfer and direct saturation effects was fitted by using neural network, then CEST and NOE maps were obtained simultaneously. The reproducibility and feasibility of new method were demonstrated in four healthy volunteers and two patients with ischemic stroke.
Background and Purpose
CEST imaging shows great potential in clinical application, such as monitoring of the stroke and the differentiation and classification of tumors in brain1, 2 and breast3. Clinically, conventional asymmetry analysis is widely applied to extract the CEST signal by showing the difference between the amide proton frequency (e.g., 3.5 ppm) and the reference frequency (e.g., -3.5 ppm) 4. However, the amide proton transfer (APT)5 effect is mixed with the nuclear Overhauser enhancement (NOE)6 effect when using the conventional asymmetry analysis, and the confounding signals from NOE will confuse the quantitative analysis of APT. The Lorentzian fitting method was introduced to solve this problem7, however, the current Lorentzian fitting is a simplified model, not including the super-Lorentzian line shape and covering only few of the known CEST pools8. To address this issue, we proposed a method to extract signals from fitting CEST data through deep learning in this study.Materials and Methods
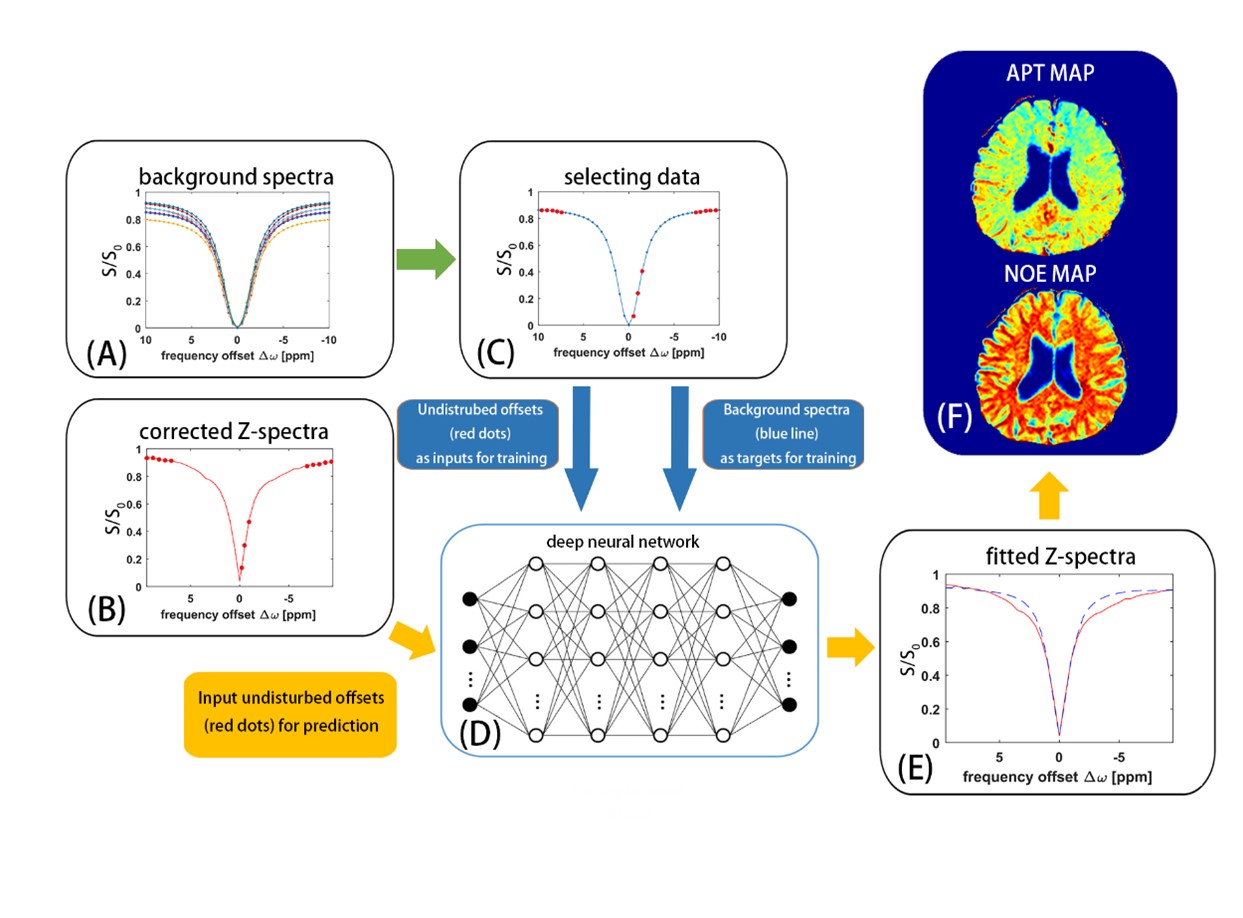
Figure 1 shows a brief schematic of the proposed data-processing method. The original data for the training set of the proposed neural network were obtained from a series of simulated background Z-spectrum, which was based on a two-pool Bloch-McConnell equation and included only magnetization transfer and direct saturation effect 9. The range of T1 for simulation was 500 to 2,000 ms, the range of T2 was 30 to 150 ms, and the range of proton fraction of the semi-solid pool was 0.08~0.15. The simulation was performed in Matlab platform (Matlab,2019a).200,000 signals generated from the numerical simulation were randomly divided into three cohorts: 140000 signals for a training cohort, 30000 signals for a validation cohort and 30000 signals for a testing cohort. The neural network in this study was a two-layer feed-forward network with 10 sigmoid hidden neurons and linear output neurons. For each simulated background spectrum, the data at frequency offsets of -9.5, -9, -8.5, -8, -7.5, -1.5, -1, -0.5, 7.5, 8, 8.5, 9, and 9.5 ppm, where there was no CEST effect, were inputted for training (Fig. 1C). The data in whole background Z-spectrum were used as targets for training. For the acquired pixelwise B0-corrected Z-spectrum, the data at frequency offsets of -9.5, -9, -8.5, -8, -7.5, -1.5, -1, -0.5, 7.5, 8, 8.5, 9, 9.5 ppm were inputted for prediction (Fig.1B), and a background Z-spectrum was obtained from the network (Fig. 1E). After the CEST contrasts at individual targets were revealed from the difference signal between predicted background Z-spectrum and acquired B0-corrected Z-spectrum, APT map and NOE map were finally obtained (Fig. 1F).
Four healthy volunteers and two patients with ischemic stroke was recruited for evaluate the proposed method. All the experiments were performed on a 3T MRI system (MAGNETOM Prisma Fit, Siemens Erlangen, Germany) and a 64-channel head/neck coil was used for collecting signal. A 2D fast low angle shot (FLASH) sequence with four reordering segments was used to acquire CEST signal. A train of 10 Gaussian-shaped RF pulses, each pulse lasting 200 ms with amplitude of 0.8µT, were applied before each readout segment. The imaging parameters were field of view (FOV) = 220 × 220 mm2 and matrix size = 128 × 128, slice thickness = 6 mm, repetition time (TR) = 8.35 ms, echo time (TE) = 4.5 ms, flip angle (FA) = 14°, and bandwidth = 320 Hz/pixel. The whole measurement process was repeated 41 times with different off-resonance frequency offsets in the range between −10 ppm and 10 ppm by a step size of 0.5 ppm with a delay of 5 s, and an additional unsaturated image was collected as the reference image.
Pixelwise Z-spectra correction for B0 inhomogeneity was performed by the water saturation shift reference (WASSR) algorithm10. The amplitude of saturated RF for WASSR was 0.3µT and duration was 200ms. The number of off-resonance frequency offsets was 21, which ranged from -1 to 1 ppm with an increment of 0.1 ppm. The imaging parameters for WASSR were identical to those for CEST imaging except that GRAPPA acceleration factor of 2 was used for rapid WASSR acquisition.
Results
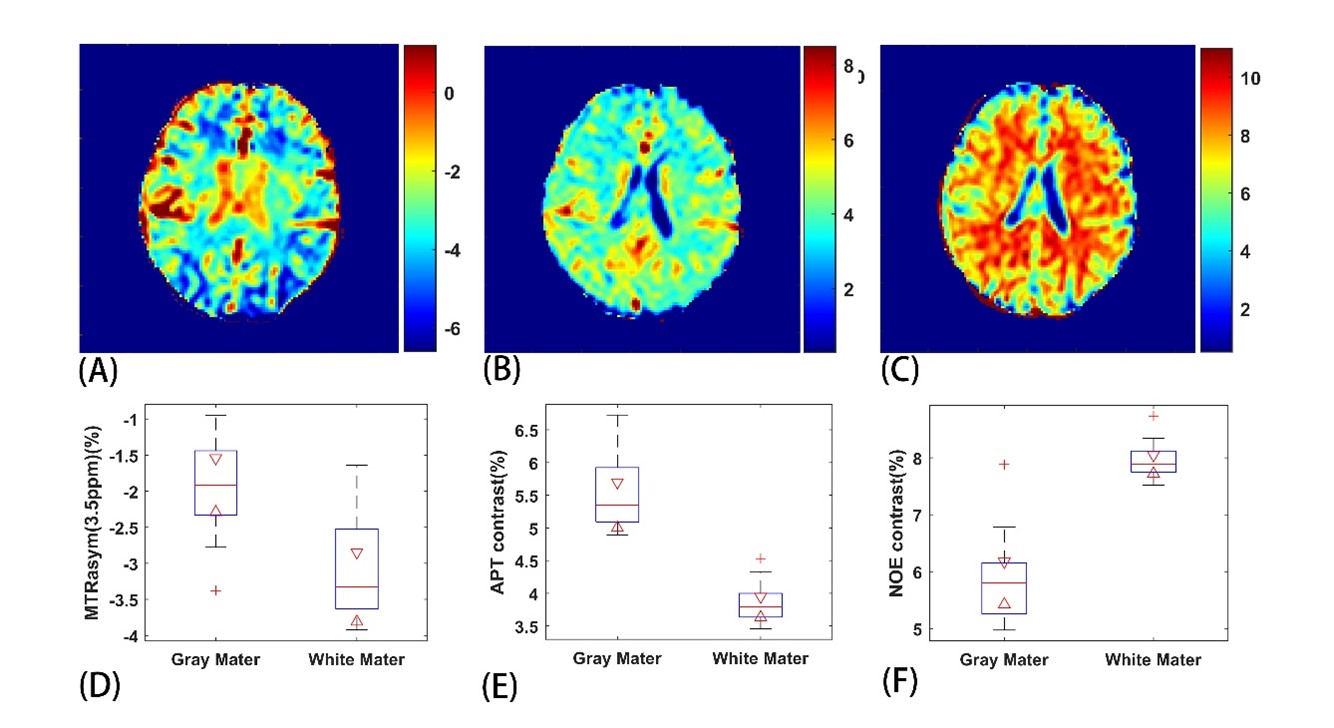
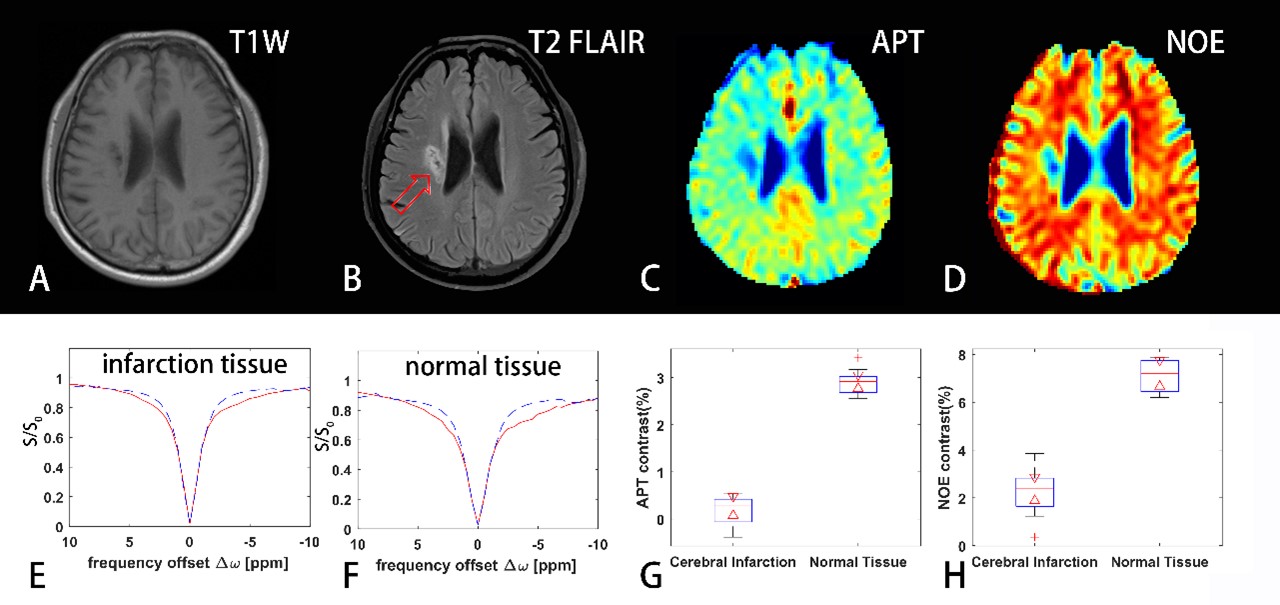
Figure 2 shows a comparison of the results from a healthy subject with neural network fitting and the conventional asymmetry analysis. Our method successfully separated the APT effect and NOE effect.Figure 3 shows the results with the proposed method from a patient with ischemic stroke. The APT and NOE signals in the infarction tissue were significantly less than the normal tissue, which should be related to tissue necrosis in the ischemic area. Both the APT and NOE map demonstrated the area and extent of the lesion.
Discussion and conclusions
In this work, we proposed a new neural network based method to extract CEST or NOE signals. Both CEST and NOE contrasts were obtained simultaneously and accurately through the network trained. Reproducibility was demonstrated in four healthy volunteers and feasibility was shown in two patients with ischemic stroke. The higher contrast and better robustness by neural network fitting may provide a new choice for CEST imaging.Acknowledgements
No acknowledgement found.References
1. Zhang JX, Zhu WZ, Tain RW, Zhou XJ, Cai KJ. Improved Differentiation of Low-Grade and High-Grade Gliomas and Detection of Tumor Proliferation Using APT Contrast Fitted from Z-Spectrum. Mol Imaging Biol 2018;20:623-631.
2. Cai K, Singh A, Poptani H, et al. CEST signal at 2ppm (CEST@2ppm) from Z-spectral fitting correlates with creatine distribution in brain tumor. NMR Biomed 2015;28:1-8.
3. Zhang S, Seiler S, Wang X, et al. CEST-Dixon for human breast lesion characterization at 3 T: A preliminary study. Magn Reson Med 2018;80:895-903.
4. Liu G, Song X, Chan KW, McMahon MT. Nuts and bolts of chemical exchange saturation transfer MRI. NMR Biomed 2013;26:810-828.
5. Xu X, Yadav NN, Zeng HF, et al. Magnetization Transfer Contrast-Suppressed Imaging of Amide Proton Transfer and Relayed Nuclear Overhauser Enhancement Chemical Exchange Saturation Transfer Effects in the Human Brain at 7T. Magnetic Resonance in Medicine 2016;75:88-96.
6. Shen Y, Xiao G, Shen Z, et al. Imaging of nuclear Overhauser enhancement at 7 and 3 T. NMR Biomed 2017;30.
7. Zaiss M, Schmitt B, Bachert P. Quantitative separation of CEST effect from magnetization transfer and spillover effects by Lorentzian-line-fit analysis of z-spectra. J Magn Reson 2011;211:149-155.
8. Glang F, Deshmane A, Prokudin S, et al. DeepCEST 3T: Robust MRI parameter determination and uncertainty quantification with neural networks-application to CEST imaging of the human brain at 3T. Magn Reson Med 2020;84:450-466.
9. Zaiss M, Zu Z, Xu J, et al. A combined analytical solution for chemical exchange saturation transfer and semi-solid magnetization transfer. NMR Biomed 2015;28:217-230.
10. Kim M, Gillen J, Landman BA, Zhou J, van Zijl PC. Water saturation shift referencing (WASSR) for chemical exchange saturation transfer (CEST) experiments. Magn Reson Med 2009;61:1441-1450.
Figures