3707
CEST and AREX data processing based on deep neural network: application to image Alzheimer’s disease at 3T1Department of Biomedical Engineering, City University of Hong Kong, Hong Kong, China, 2Department of Health Technology and Informatics, The Hong Kong Polytechnic University, Hong Kong, China, 3F.M. Kirby Research Center for Functional Brain Imaging, Kennedy Krieger Research Institute, Baltimore, MD, United States, 4Russell H. Morgan Department of Radiology and Radiological Science, The Johns Hopkins University School of Medicine, Baltimore, MD, United States, 5City University of Hong Kong Shenzhen Research Institute, Shenzhen, China
Synopsis
Chemical exchange saturation transfer (CEST) magnetic resonance imaging (MRI) is a promising molecular imaging technology. Apparent exchange-dependent relaxation (AREX) provides CEST contrast with less influence of T1. Here, deep neural network based CEST/AREX analysis methods (CESTNet/AREXNet) were applied to analyze the CEST data of normal and AD mouse brains at 3T. Significant lower amide proton transfer/magnetization transfer (APT/MT) signals related to amyloid β-peptide (Aβ) plaque depositions, which were validated by immunohistochemistry results, were detected in Alzheimer’s disease (AD) mouse brains compared to age-matched wild type (WT) mouse brains. The well-established CESTNet/AREXNet have great potential to facilitate AD identification at 3T.
Introduction
Chemical exchange saturation transfer (CEST) magnetic resonance imaging (MRI) is a promising molecular imaging technology.1,2 Recently, deep learning has been introduced to assist and accelerate the CEST post-processing in human studies.3-8 To explore the potential of deep learning at preclinical 3T MRI, here, we first processed the CEST data of mouse brain using deep neural network (CESTNet) based on the similar mechanism with previous studies.3,4 Second, we proposed to quantify the apparent exchange-dependent relaxation (AREX) parameters9-14 using another the deep neural network (AREXNet). Finally, we applied the CESTNet and AREXNet to analyze the unseen CEST data of mouse brains with Alzheimer’s disease (AD). The networks could generate CEST and AREX contrasts of AD mouse brain quickly and accurately, although the networks were only trained on CEST data of normal wild type (WT) mouse brains. Our results showed that the amide proton transfer (APT) and magnetization transfer (MT) signals of AD mouse brain were significantly lower than that of age-matched WT mouse brain, which could be related to the amyloid β-peptide (Aβ) plaque depositions in AD mouse brain. These findings were further validated by the immunohistochemistry results.Methods
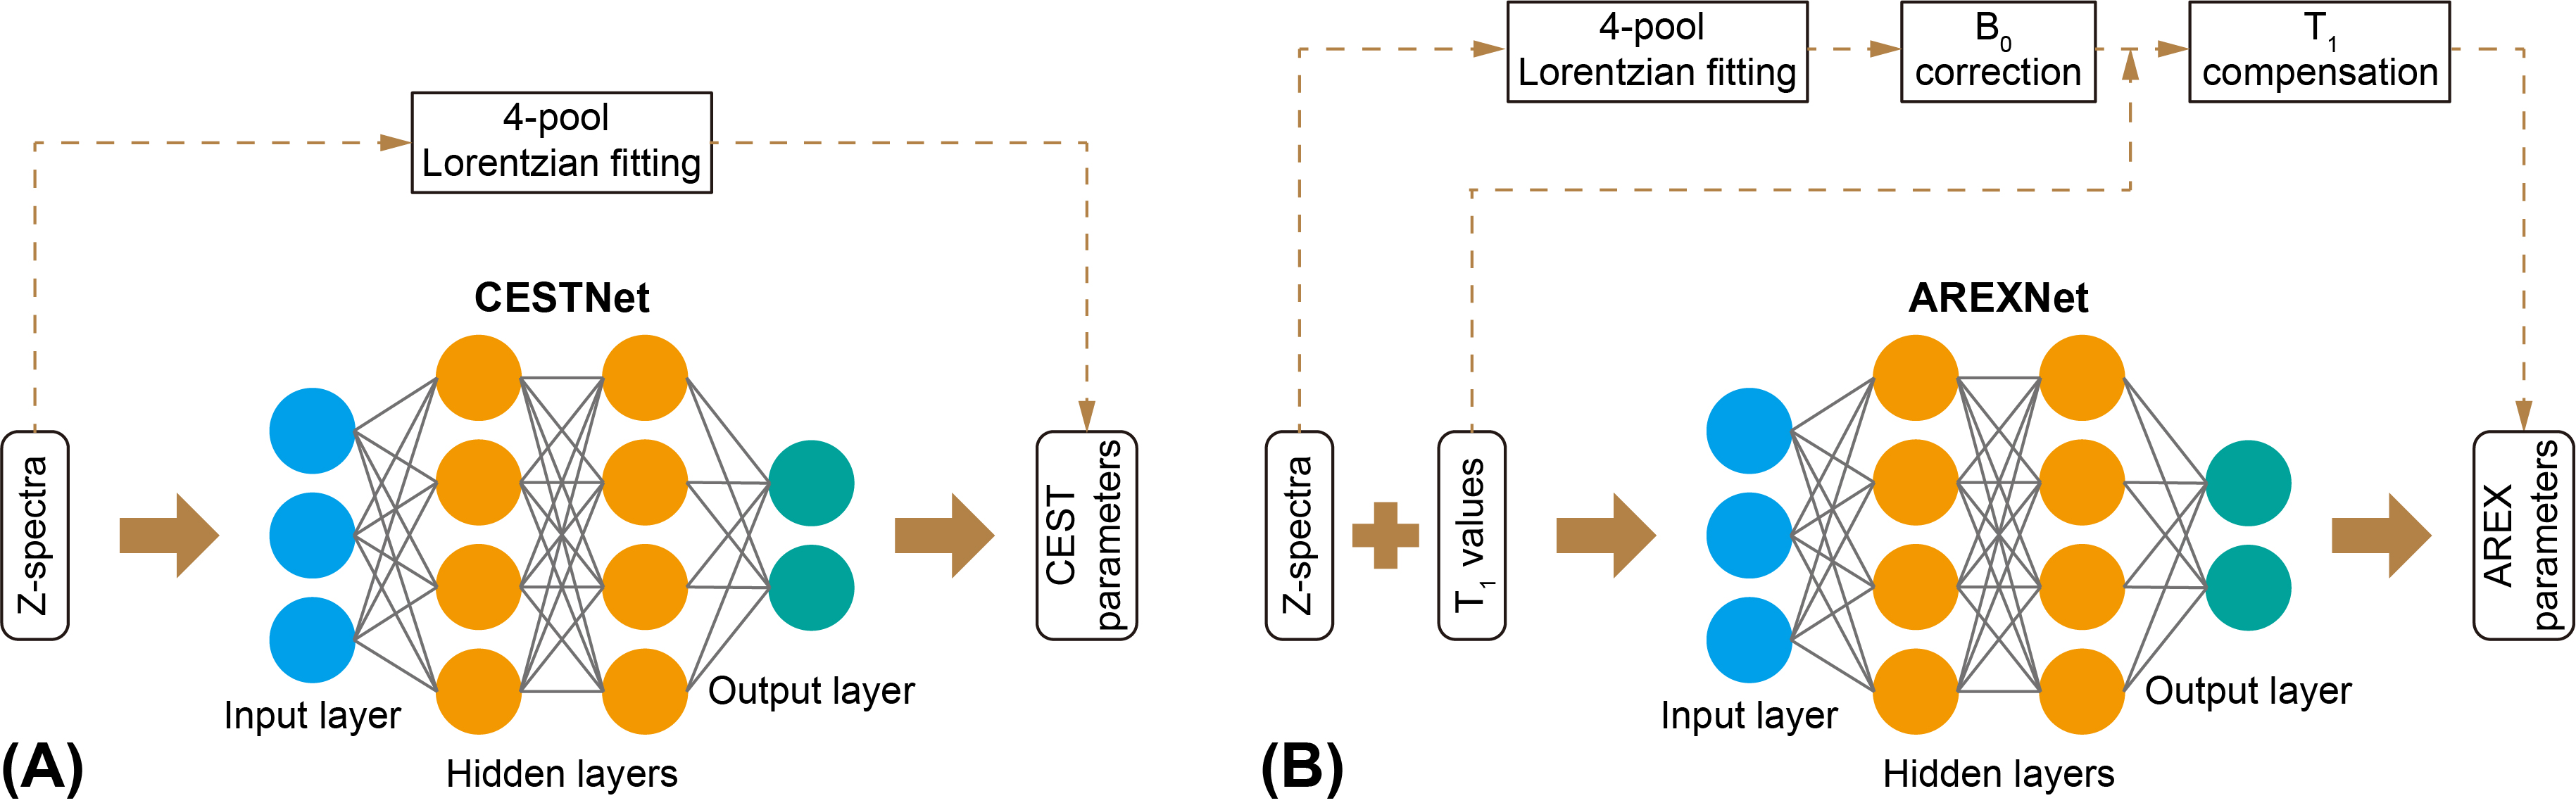
Ten AD mice (5XFAD, aged 10-12 months old) and 10 age-matched WT (C57BL/6) mice were used in this study. All MRI experiments were performed on a 3T Bruker BioSpec system (Bruker, Ettlingen, Germany). The CEST MRI sequence was a continuous-wave (CW) saturation module, followed by the rapid acquisition with refocused echoes (RARE) as a readout module. A power (B1) of 0.6 μT and a duration (tsat) of 3 s were used for the saturation module. Three M0 images at frequency offset of 200 ppm and 73 CEST images at frequency offsets between -20 and 20 ppm were acquired. The readout parameters were as follows: repetition time (TR) = 5 s, echo time (TE) = 6 ms, field of view (FOV) = 18 × 18 mm2, matrix size = 96 × 96, slice thickness = 2 mm. Hence, the total scan time for each CEST data set was 23 min 15 s. Two adjacent slices (central and anterior) from coronal orientation were acquired for each mouse brain. The T1 maps of mouse brains were measured using variable TR (RAREVTR) sequence.The CEST data were first analyzed with 4-pool Lorentzian fitting (4PLF),4,12,15 including direct water saturation (DS), APT, relayed nuclear Overhauser enhancements (rNOE) and MT, followed by B0 correction and AREX calculation.9-14 The 4PLF/AREX results were used as targets during network training and as reference during network testing. The CESTNet and AREXNet were fully connected neural networks, as shown in Figure 1. After optimization, a hidden layer number of 3 and a neuron number of 100 were adopted for both CESTNet and AREXNet.Results and Discussion
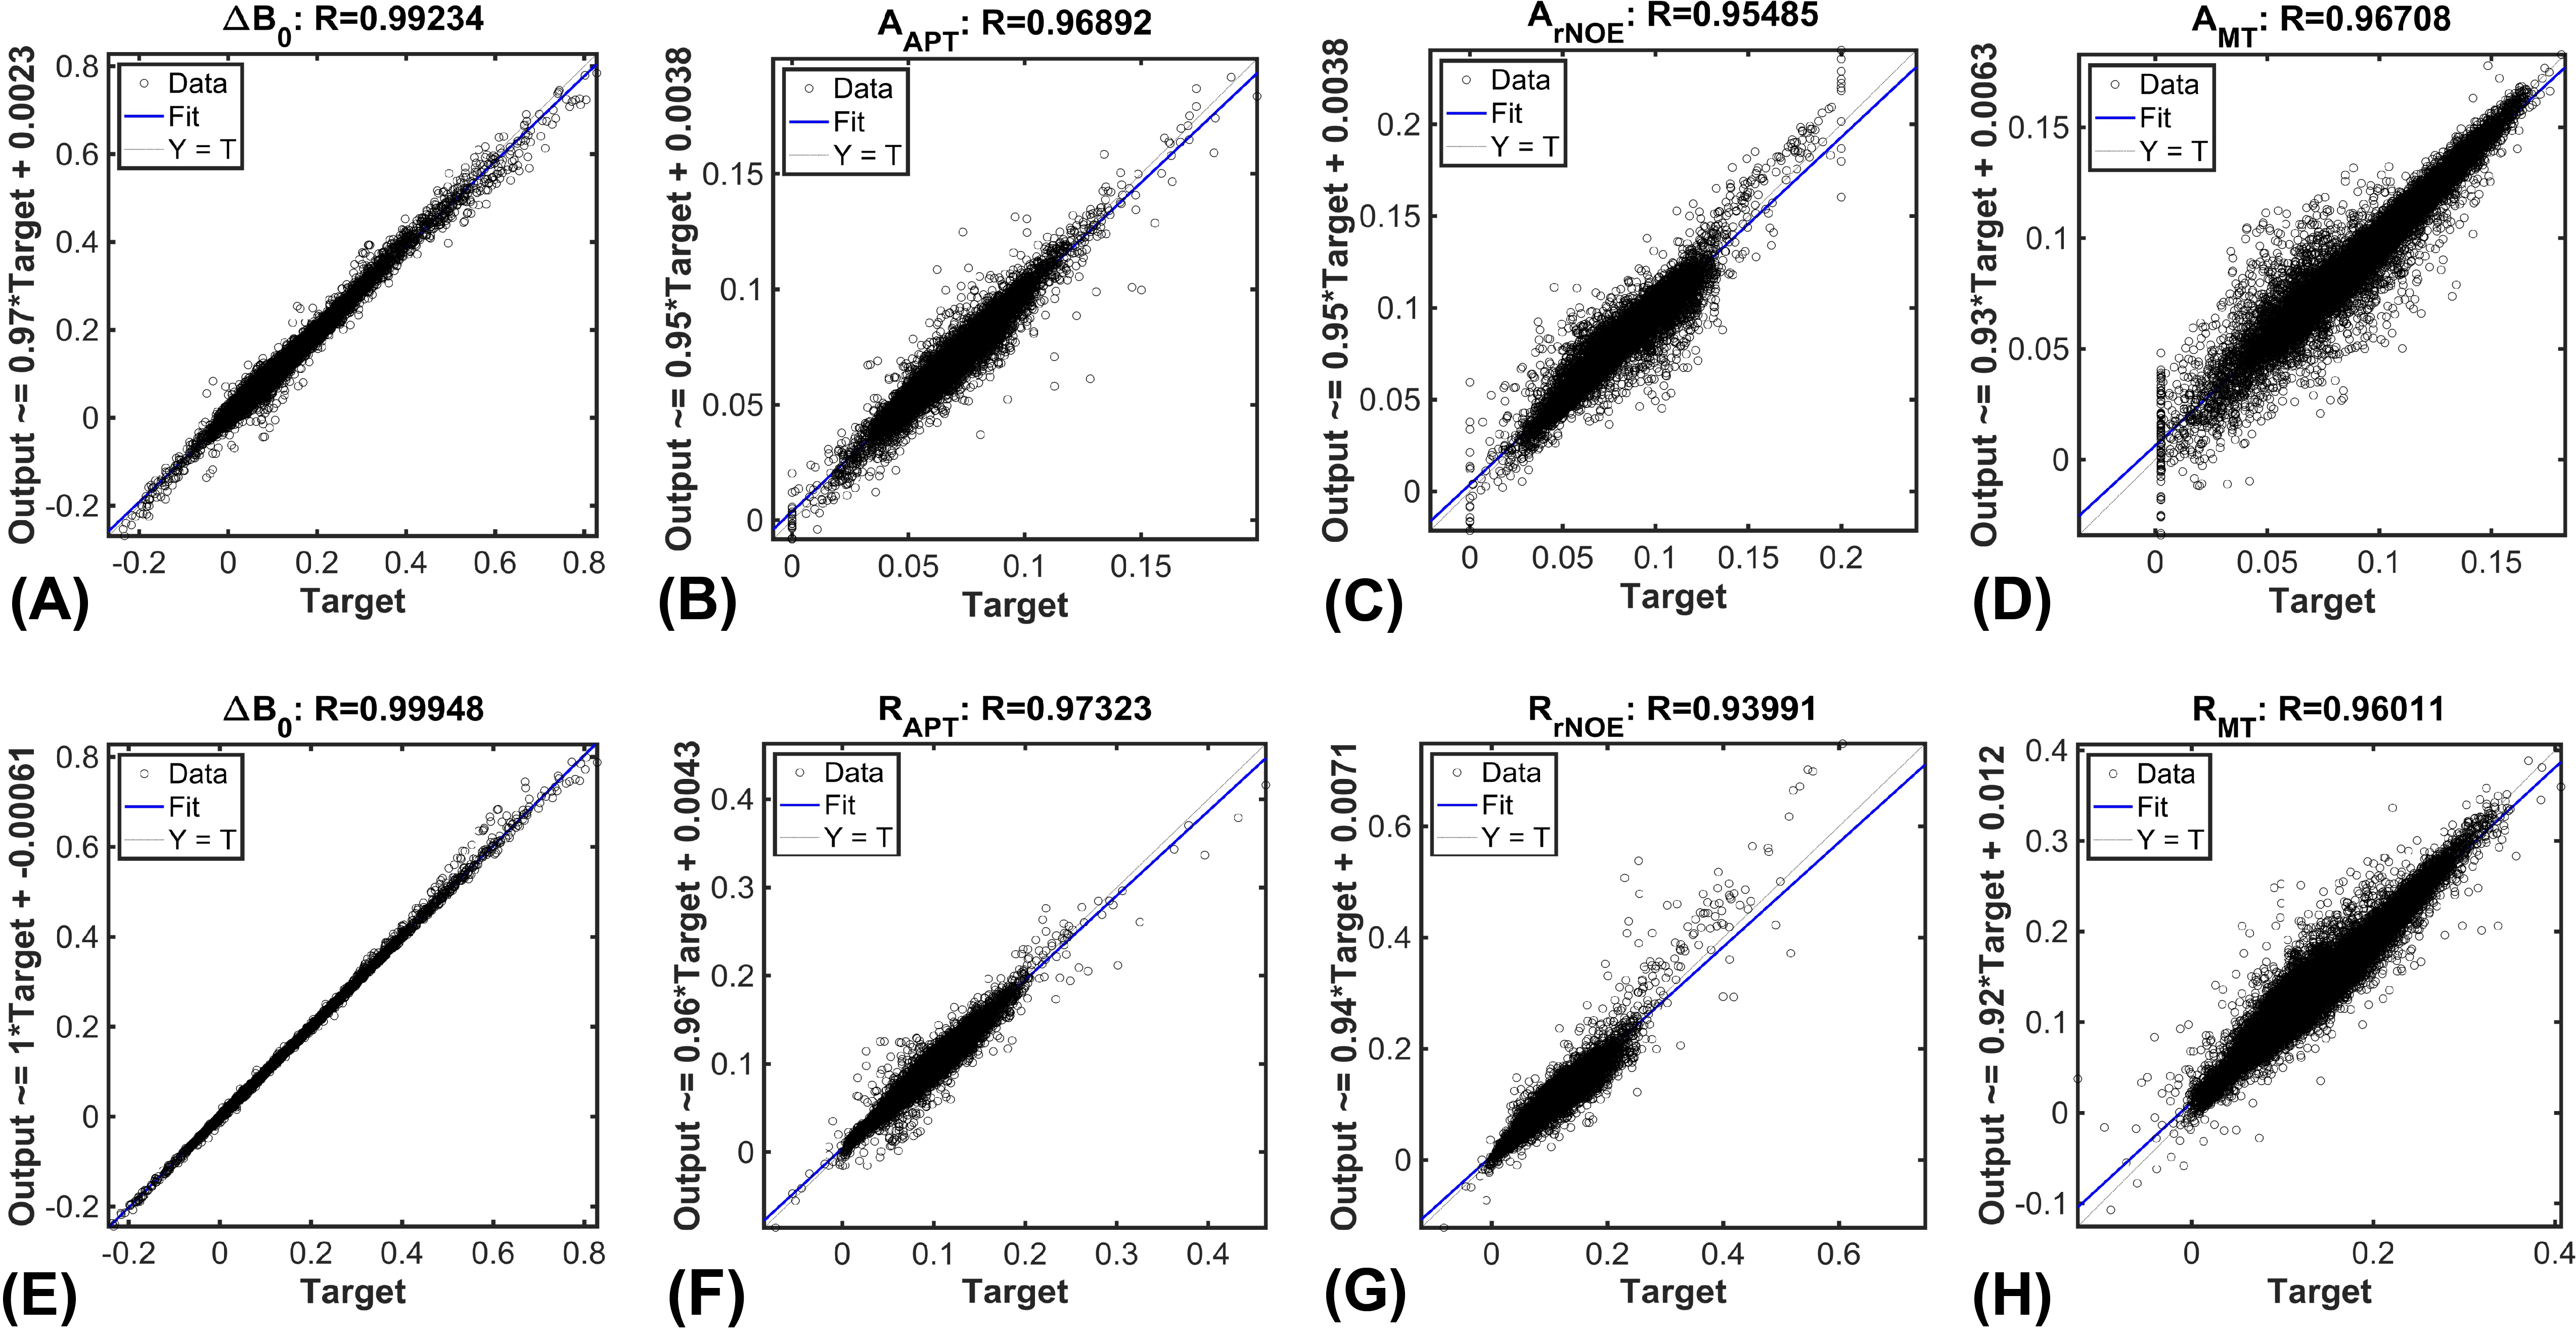
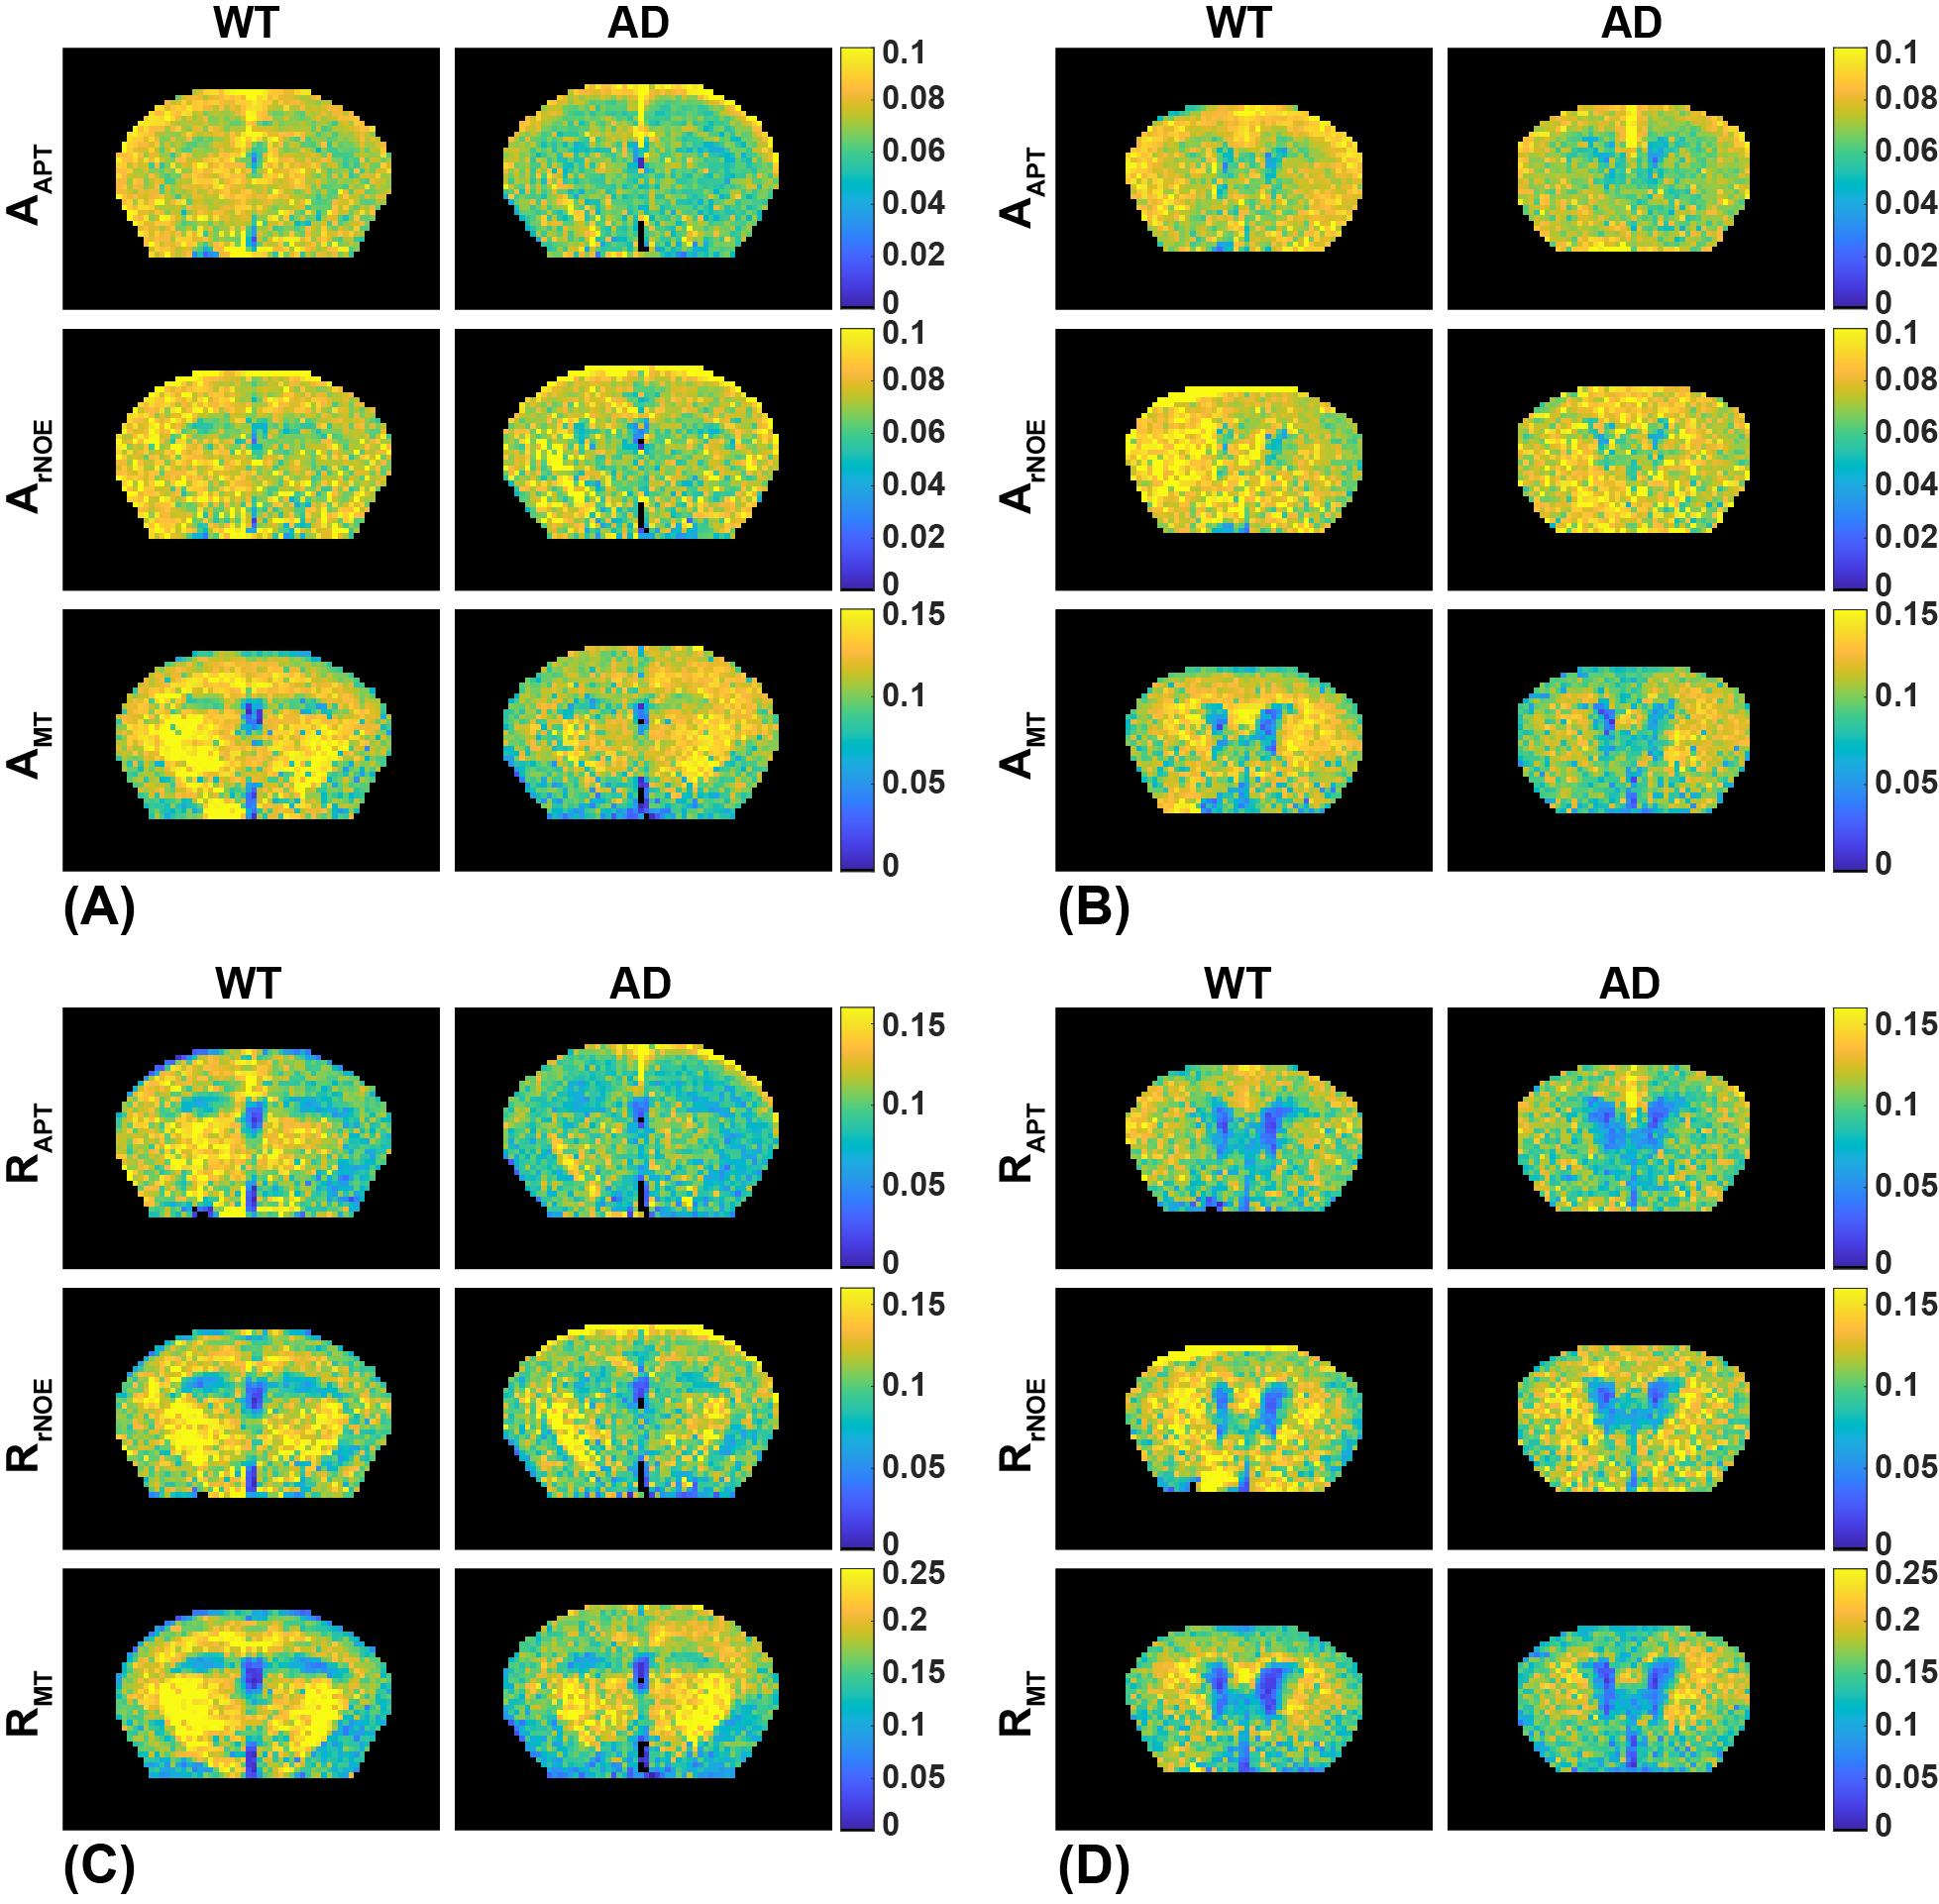
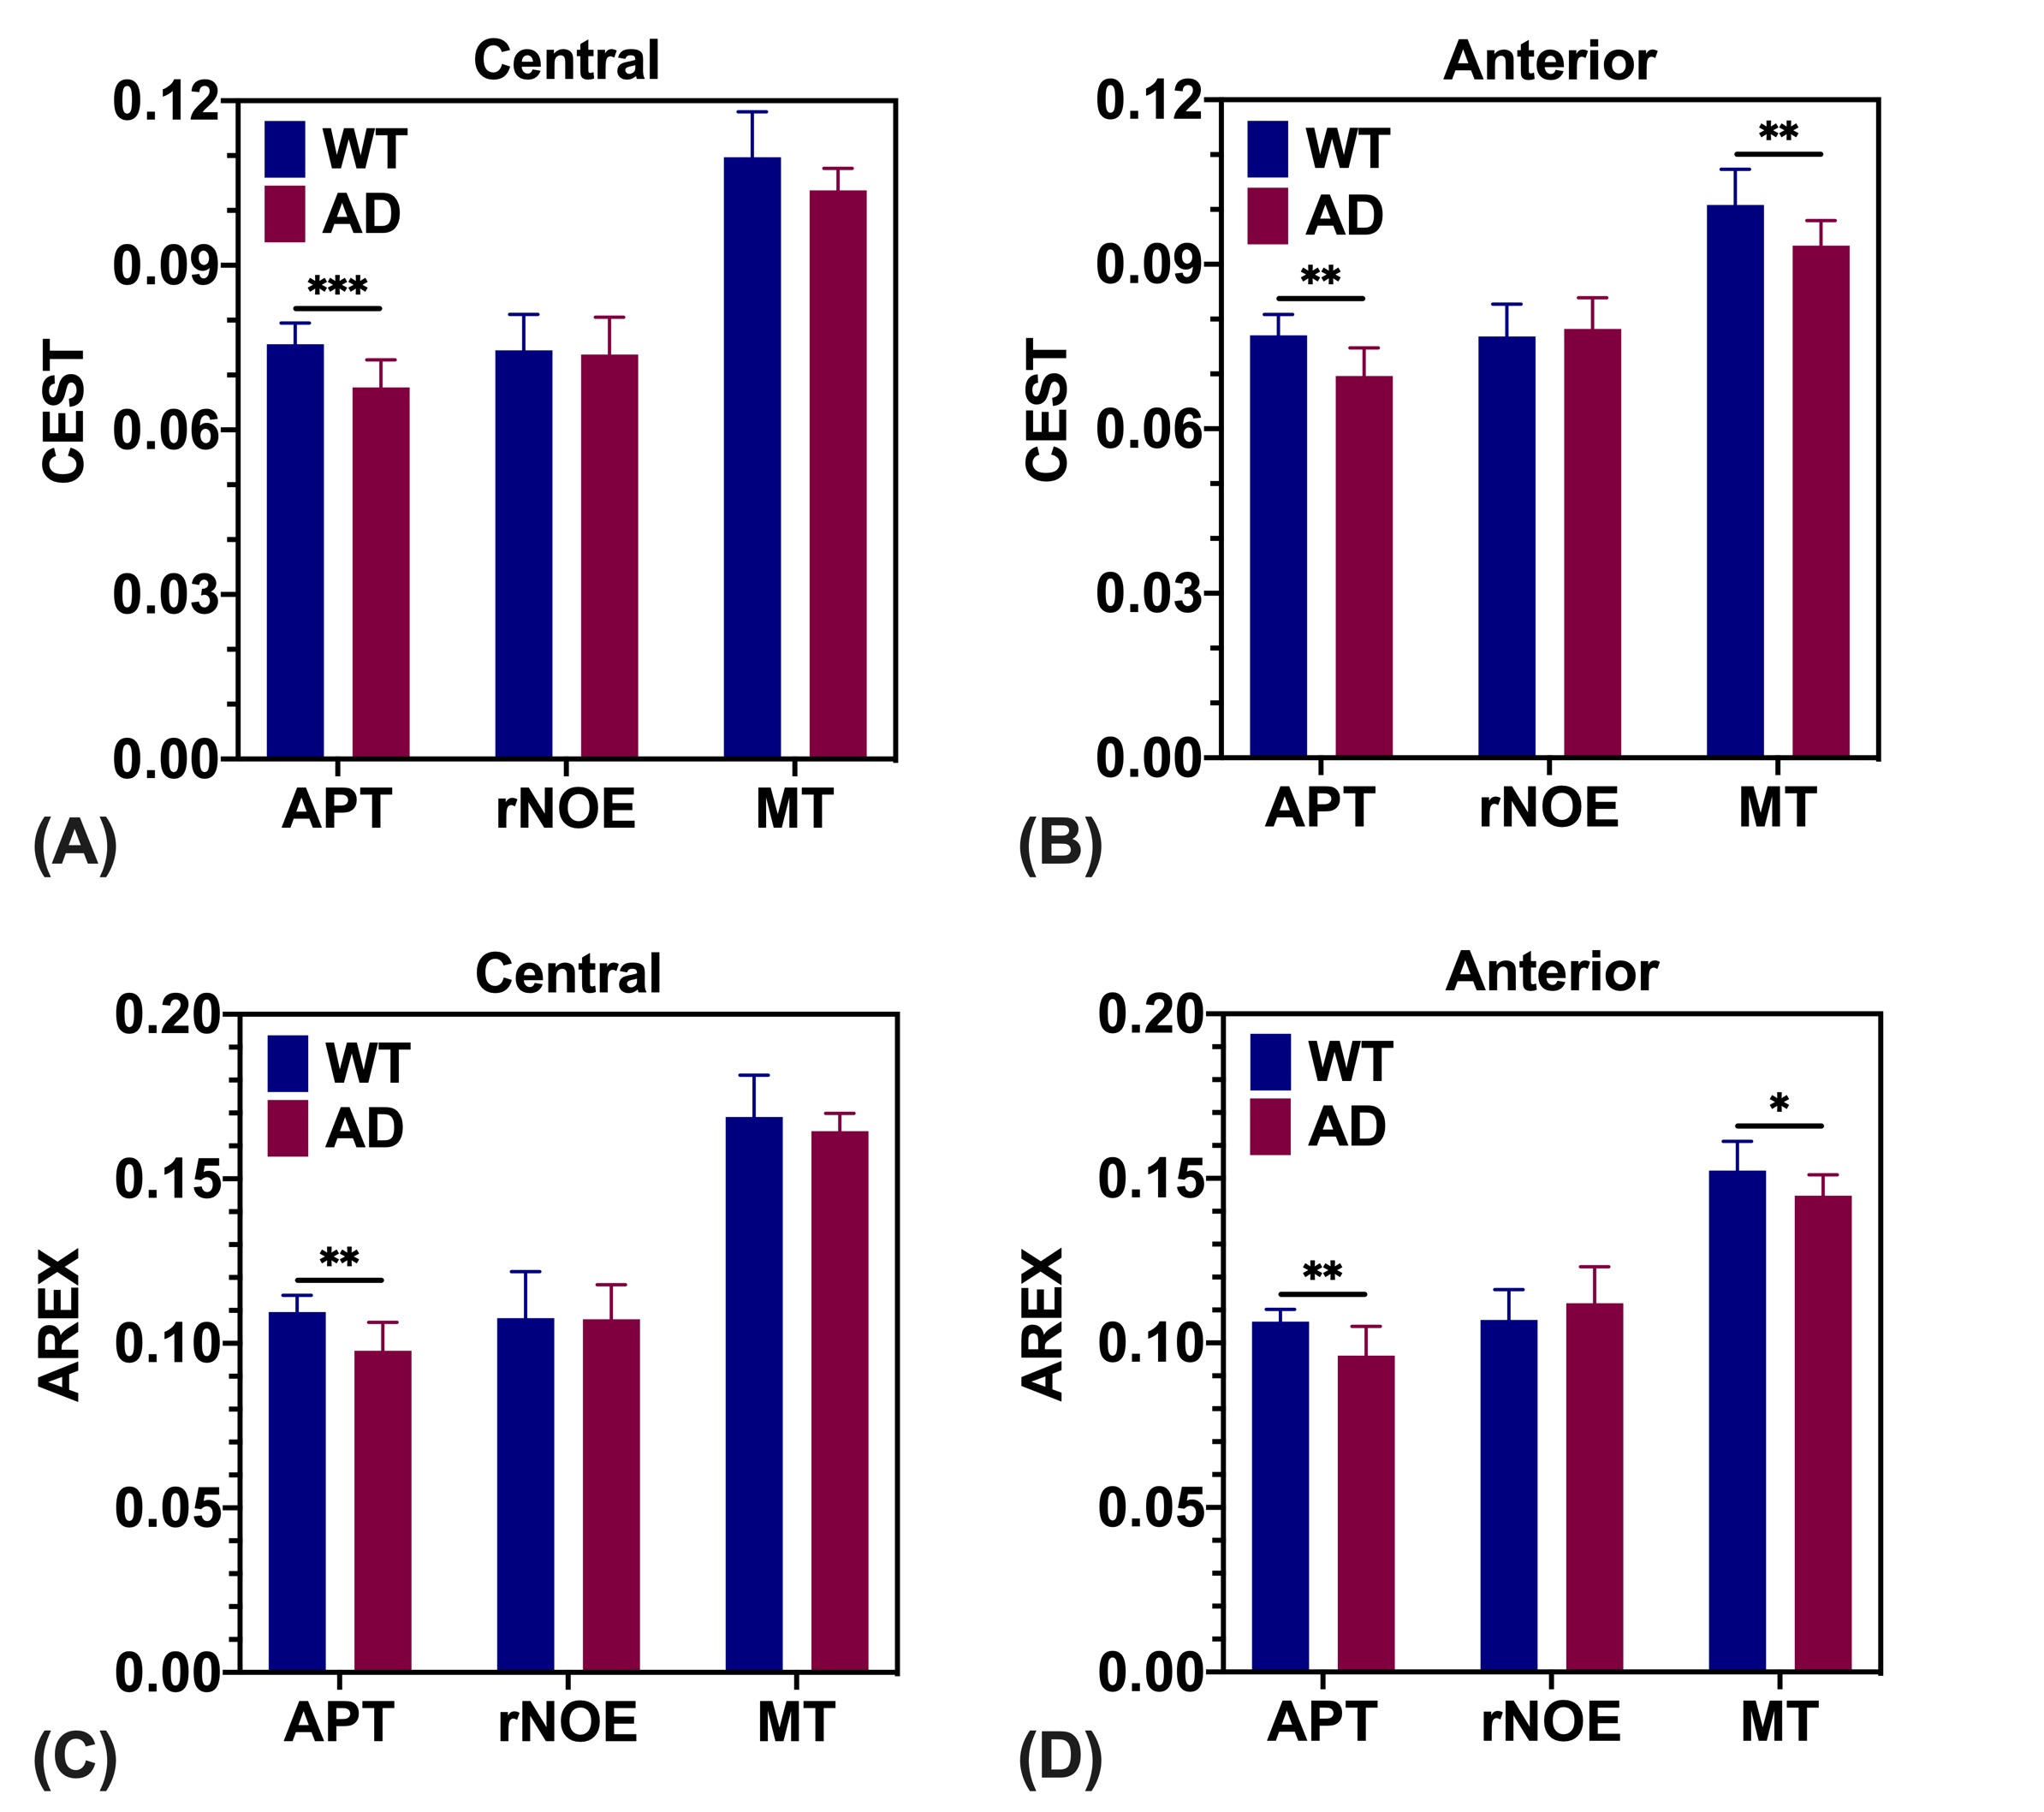
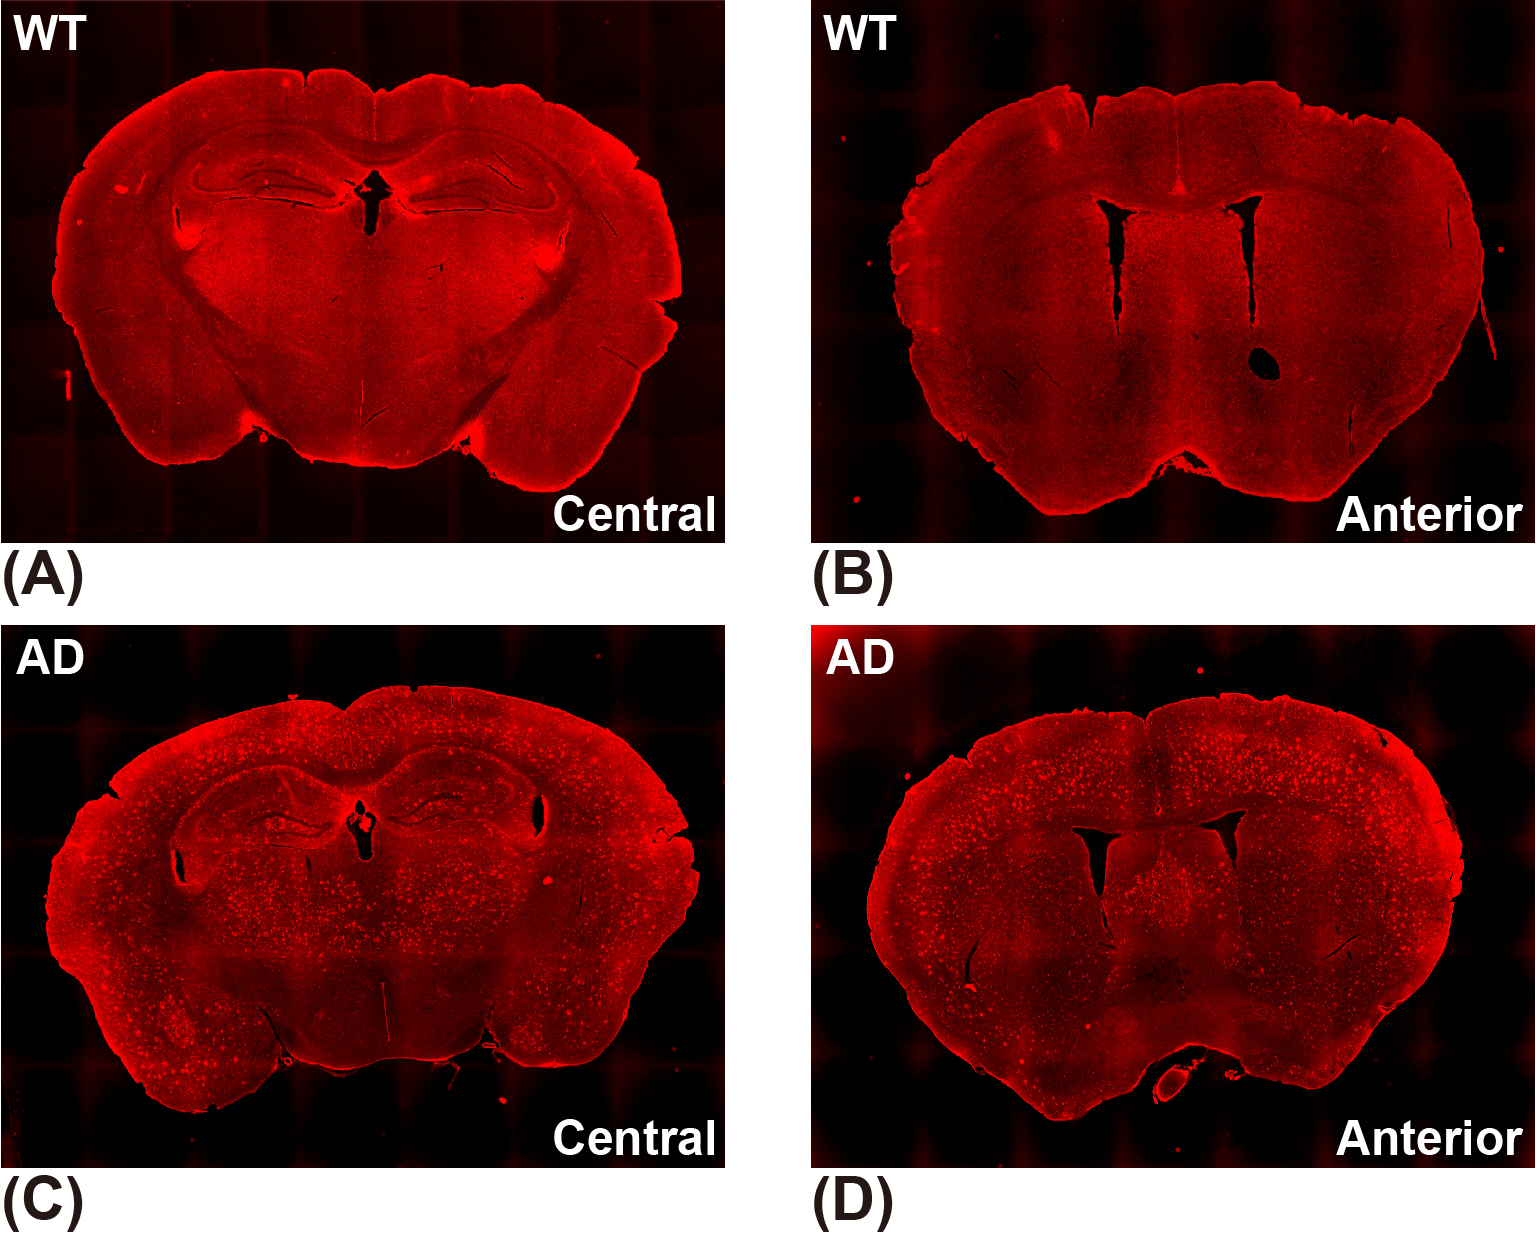
The CESTNet/AREXNet were only trained on CEST data of WT mouse brains and applied to unseen CEST data of AD mouse brains to obtained CEST (ΔB0, AAPT, ArNOE and AMT) and AREX (ΔB0, RAPT, RrNOE and RMT) matrices faster than 4PLF/AREX (~1 s versus ~20 s for a single mouse brain slice). The pixel-wise regression results of all CEST data of AD brains revealed good correlation of the CESTNet/AREXNet prediction with the 4PLF/AREX results, i.e. Pearson correlation coefficient R of all parameters were above 0.93 (Figure 2). Interestingly, the AAPT signals of AD mice were significantly lower than that of WT mice in both central (P < 0.001) and anterior (P = 0.002) brain slices (Figure 3&4). These lower signals remained significant after T1 correction, as the RAPT results shown in Figure 3&4 (central: P = 0.002; anterior: P = 0.003). Similar to the observation in Figure 3, no substantial differences between WT and AD mice were found in ArNOE (central: P = 0.795; anterior: P = 0.611) and RrNOE (central: P = 0.952; anterior: P = 0.281) in Figure 4. As for MT, lower signals were detected in the central brain slices of AD mice compared to that of WT mice but not significant (AMT: P = 0.052; RMT: P = 0.330). However, the MT signals of the anterior brain slices of AD mice were obviously lower than that of WT mice (AMT: P = 0.008; RMT: P = 0.039). We speculated this lower APT/MT signals were related to the deposition of Aβ plaques in AD mouse brain, which was validated by the immunohistochemistry results (Figure 5). The brain slices of AD mouse with 6E10 staining showed massive Aβ plaques, while no Aβ plaque was found in age-matched WT mouse brain.Conclusion
In this study, CESTNet/AREXNet were trained to analyze the CEST data of mouse brains at 3T. Both CESTNet/AREXNet could rapidly generate accurate results in a robust manner within 1 s compared to conventional fitting methods. The generalizations of CESTNet/AREXNet were well validated on the unseen data of AD mice. Interestingly, significant lower APT/MT signals related to Aβ plaque depositions, which were validated by immunohistochemistry results, were detected in AD mouse brains compared to age-matched WT mouse brains. This indicated that well-established CESTNet/AREXNet have great potential for AD identification at 3T.Acknowledgements
Research Grants Council: 11102218; City University of Hong Kong: 7005210, 9680247, 9667198 and 6000660; National Natural Science Foundation of China: 81871409.References
1. Ward K, Aletras A, Balaban RS. A new class of contrast agents for MRI based on proton chemical exchange dependent saturation transfer (CEST). J Magn Reson 2000;143(1):79-87.
2. van Zijl PC, Yadav NN. Chemical exchange saturation transfer (CEST): what is in a name and what isn't? Magn Reson Med 2011;65(4):927-948.
3. Zaiss M, Deshmane A, Schuppert M, Herz K, Glang F, Ehses P, Lindig T, Bender B, Ernemann U, Scheffler K. DeepCEST: 9.4 T Chemical exchange saturation transfer MRI contrast predicted from 3 T data–a proof of concept study. Magn Reson Med 2019;81(6):3901-3914.
4. Glang F, Deshmane A, Prokudin S, Martin F, Herz K, Lindig T, Bender B, Scheffler K, Zaiss M. DeepCEST 3T: Robust MRI parameter determination and uncertainty quantification with neural networks—application to CEST imaging of the human brain at 3T. Magn Reson Med 2020;84(1):450-466.
5. Chen L, Schär M, Chan KW, Huang J, Wei Z, Lu H, Qin Q, Weiss RG, van Zijl PC, Xu J. In vivo imaging of phosphocreatine with artificial neural networks. Nat Commun 2020;11(1):1-10.
6. Li Y, Xie D, Cember A, Nanga RPR, Yang H, Kumar D, Hariharan H, Bai L, Detre JA, Reddy R. Accelerating GluCEST imaging using deep learning for B0 correction. Magn Reson Med 2020.
7. Kim B, Schär M, Park H, Heo H-Y. A deep learning approach for magnetization transfer contrast MR fingerprinting and chemical exchange saturation transfer imaging. NeuroImage 2020;221:117165.
8. Kang B, Kim B, Schär M, Park H, Heo HY. Unsupervised learning for magnetization transfer contrast MR fingerprinting: Application to CEST and nuclear Overhauser enhancement imaging. Magn Reson Med 2020.
9. Zaiss M, Windschuh J, Paech D, Meissner J-E, Burth S, Schmitt B, Kickingereder P, Wiestler B, Wick W, Bendszus M. Relaxation-compensated CEST-MRI of the human brain at 7 T: unbiased insight into NOE and amide signal changes in human glioblastoma. Neuroimage 2015;112:180-188.
10. Rerich E, Zaiss M, Korzowski A, Ladd ME, Bachert P. Relaxation‐compensated CEST‐MRI at 7 T for mapping of creatine content and pH–preliminary application in human muscle tissue in vivo. NMR Biomed 2015;28(11):1402-1412.
11. Zaiss M, Windschuh J, Goerke S, Paech D, Meissner JE, Burth S, Kickingereder P, Wick W, Bendszus M, Schlemmer HP. Downfield‐NOE‐suppressed amide‐CEST‐MRI at 7 Tesla provides a unique contrast in human glioblastoma. Magn Reson Med 2017;77(1):196-208.
12. Goerke S, Soehngen Y, Deshmane A, Zaiss M, Breitling J, Boyd PS, Herz K, Zimmermann F, Klika KD, Schlemmer HP. Relaxation‐compensated APT and rNOE CEST‐MRI of human brain tumors at 3 T. Magn Reson Med 2019;82(2):622-632.
13. Huang J, Han X, Chen L, Xu X, Xu J, Chan KW. Relayed nuclear Overhauser enhancement imaging with magnetization transfer contrast suppression at 3 T. Magn Reson Med 2020;85(1):254-267.
14. Zhang XY, Wang F, Li H, Xu J, Gochberg DF, Gore JC, Zu Z. Accuracy in the quantification of chemical exchange saturation transfer (CEST) and relayed nuclear Overhauser enhancement (rNOE) saturation transfer effects. NMR Biomed 2017;30(7):e3716.
15. Zaiss M, Schmitt B, Bachert P. Quantitative separation of CEST effect from magnetization transfer and spillover effects by Lorentzian-line-fit analysis of z-spectra. J Magn Reson 2011;211(2):149-155.
Figures