3706
Amide proton transfer-weighted MR imaging in the rat brain of demyelination and remyelination1Department of Radiology, Asan Medical Center, University of Ulsan College of Medicine, Seoul, Korea, Republic of, 2Department of Convergence Medicine, Asan Medical Center, University of Ulsan College of Medicine, Seoul, Korea, Republic of, 3Convergence Medicine Research Center, Asan Institute for Life Sciences, Asan Medical Center, Seoul, Korea, Republic of, 4Department of Radiological Science, College of Health Sciences, Yonsei University, Wonju, Korea, Republic of
Synopsis
Investigations of amide proton signal changes in the white matter of demyelinating diseases may provide important biophysical information for diagnostic and prognostic assessments. We attempted to evaluate in vivo APTw signal changes within the CC in a reversible cuprizone-induced demyelination rat model using amide proton transfer-weighted (APTw) MRI at 7-T. We also used immunohistochemical staining to characterize demyelinating and remyelinating activity in the CC following myelin and axon changes. Significant APTw metric changes coupled with the histological characteristics of the demyelination and remyelination processes indicate the potential usefulness of APTw 7T MRI to monitor earlier myelination processes.
INTRODUCTION
Multiple sclerosis (MS) is a demyelinating disorder that causes focal lesions in the CNS and an autoimmune disease in which inflammatory response to myelin components leads to demyelination, axonal damage, and oligodendrocyte death.1,2 Remyelination is a regenerative process in which new myelin sheaths form in demyelinated axons. Thus, biophysical assessment of remyelination through observational and follow-up studies is an important diagnostic and therapeutic strategy for preventing axonal loss in MS.1,3,4 This study applied amide proton transfer-weighted (APTw) MRI at 7-T to evaluate in vivo APTw signal changes within the corpus callosum (CC) in a reversible cuprizone-induced demyelination rat model.METHODS
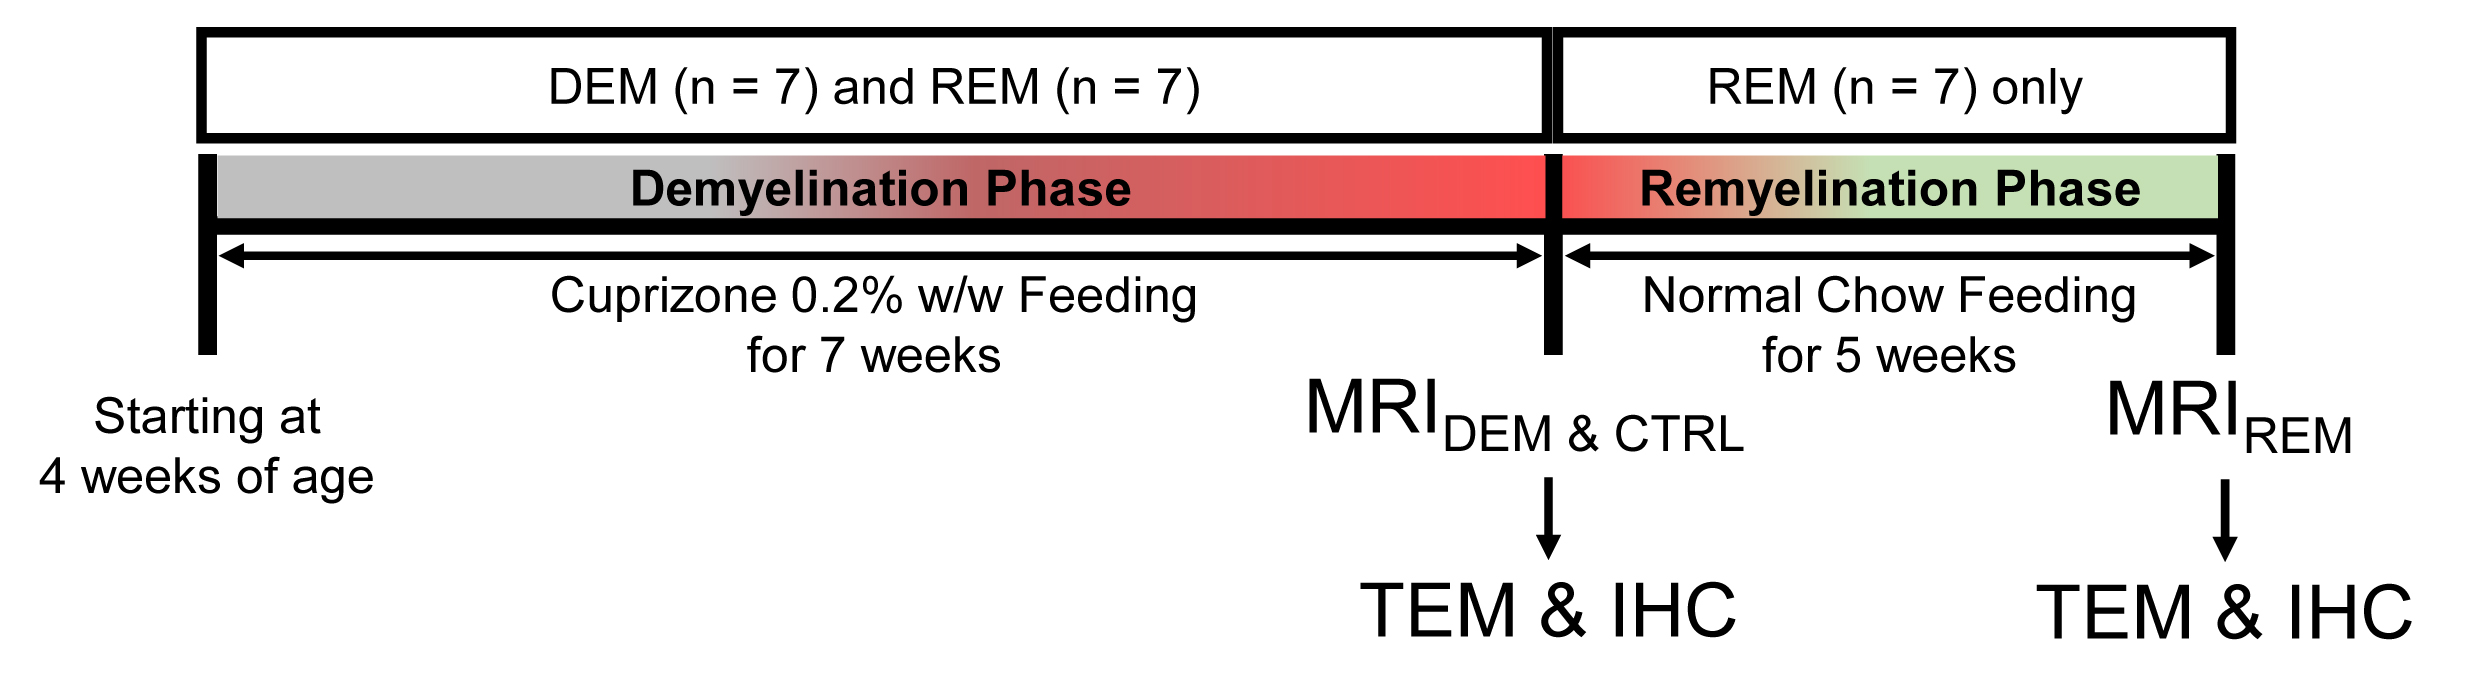
Animals: Twenty-one male rats were divided into three groups (demyelination [DEM]; n=7, remyelination [REM]; n=7, and a control group; n=7). We fed a diet milled with 0.2% cuprizone (bis[cyclohexanone]oxaldihydrazone) for 7-weeks to induce demyelination. To induce remyelination1,5, we changed to normal diet and fed for an additional 5-weeks. Figure 1 is a schematic diagram of cuprizone administration for demyelination and remyelination.MRI Experiments: All MRI experiments were performed on a 7-T/160-mm scanner. APT data were acquired using a fat-suppressed turbo-RARE sequence with a continuous-wave RF saturation pulse (power/time = 2.3-μT/5-sec).6 Z-spectra with 25-frequency offsets from ±6ppm (0.5ppm increment) for saturation images and one unsaturation image (S0) were acquired. For B0-field inhomogeneity correction, water saturation shift referencing (WASSR) Z-spectra with 33-frequency offsets from ±0.8ppm (0.05ppm increment) using 0.5-μT RF saturation power was applied.7
Data Analysis: To correct for B0-field inhomogeneity, the Z-spectra from WASSR data for each voxel were fitted, and then water signal was reset to 0ppm to obtain the frequency shift information. The APTw signal was computed by subtracting the magnetization transfer ratio (MTR=1–Ssat/S0): APTw=MTRasym(3.5ppm)=MTR(+3.5ppm)–MTR(-3.5ppm).8 The APTw signals in all experimental groups were carefully quantified based on manually drawn ROIs in the CC.
Transmission Electron Microscopy (TEM): To observe the myelin sheets of the rat CC, TEM was performed at the ultrastructural level. CC-containing brain samples were fixed with 2.5% glutaraldehyde. The samples were dehydrated using an ethanol, embedded in Epon-resin, and finally baked. Ultrathin (60-nm) sections were prepared and captured using a Hitachi-H7600.
Myelin Staining: To observe myelin distribution in CC, coronal brain sections (20-μm) were stained with Black-Gold-II. The sections were transferred to pre-warmed 0.3% Black-Gold-II solution. The sections were dehydrated using an ethanol, cover-slipped with mounting media, and then captured with a Zeiss-Axio Observer.Z1.
Statistical Analysis: The normality of data was assessed using Kolmogorov–Smirnov and Shapiro–Wilk tests. The results for normality in all groups were above 0.05. The APTw signal intensities among the groups were analyzed by one-way ANOVA followed by Tukey’s post-hoc tests. A p-values <0.05 were considered statistically significant.
RESULTS AND DISCUSSION
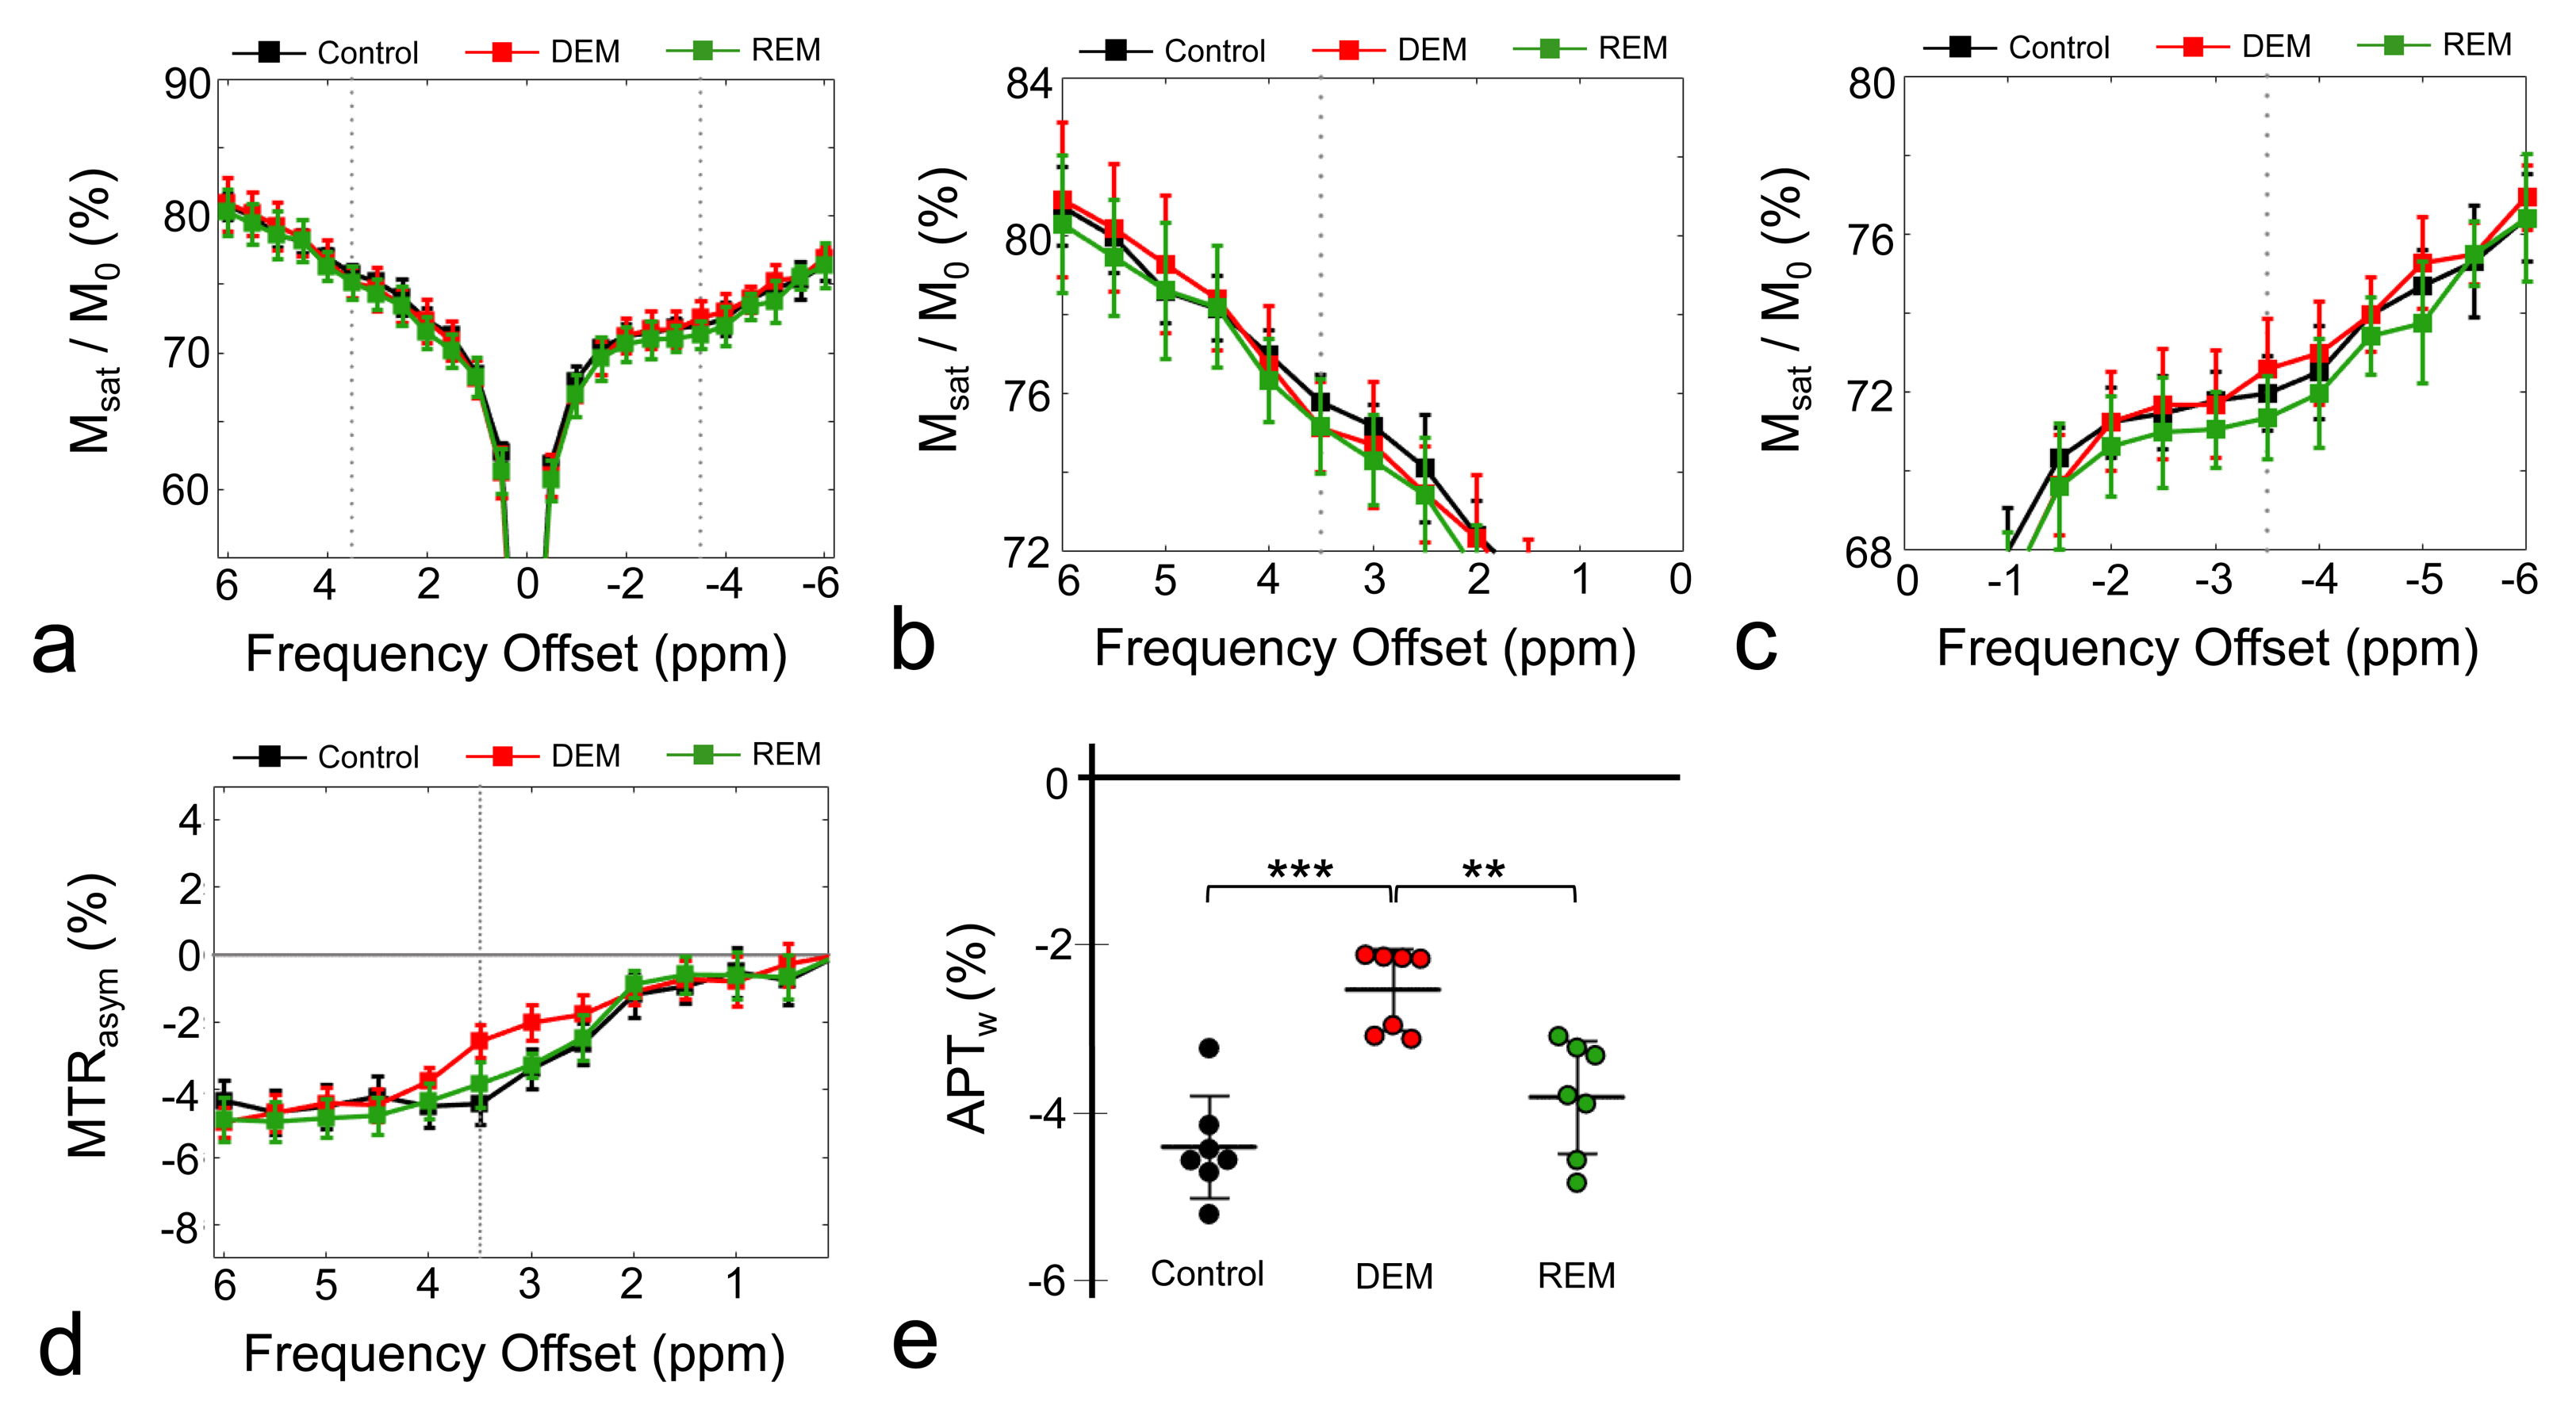
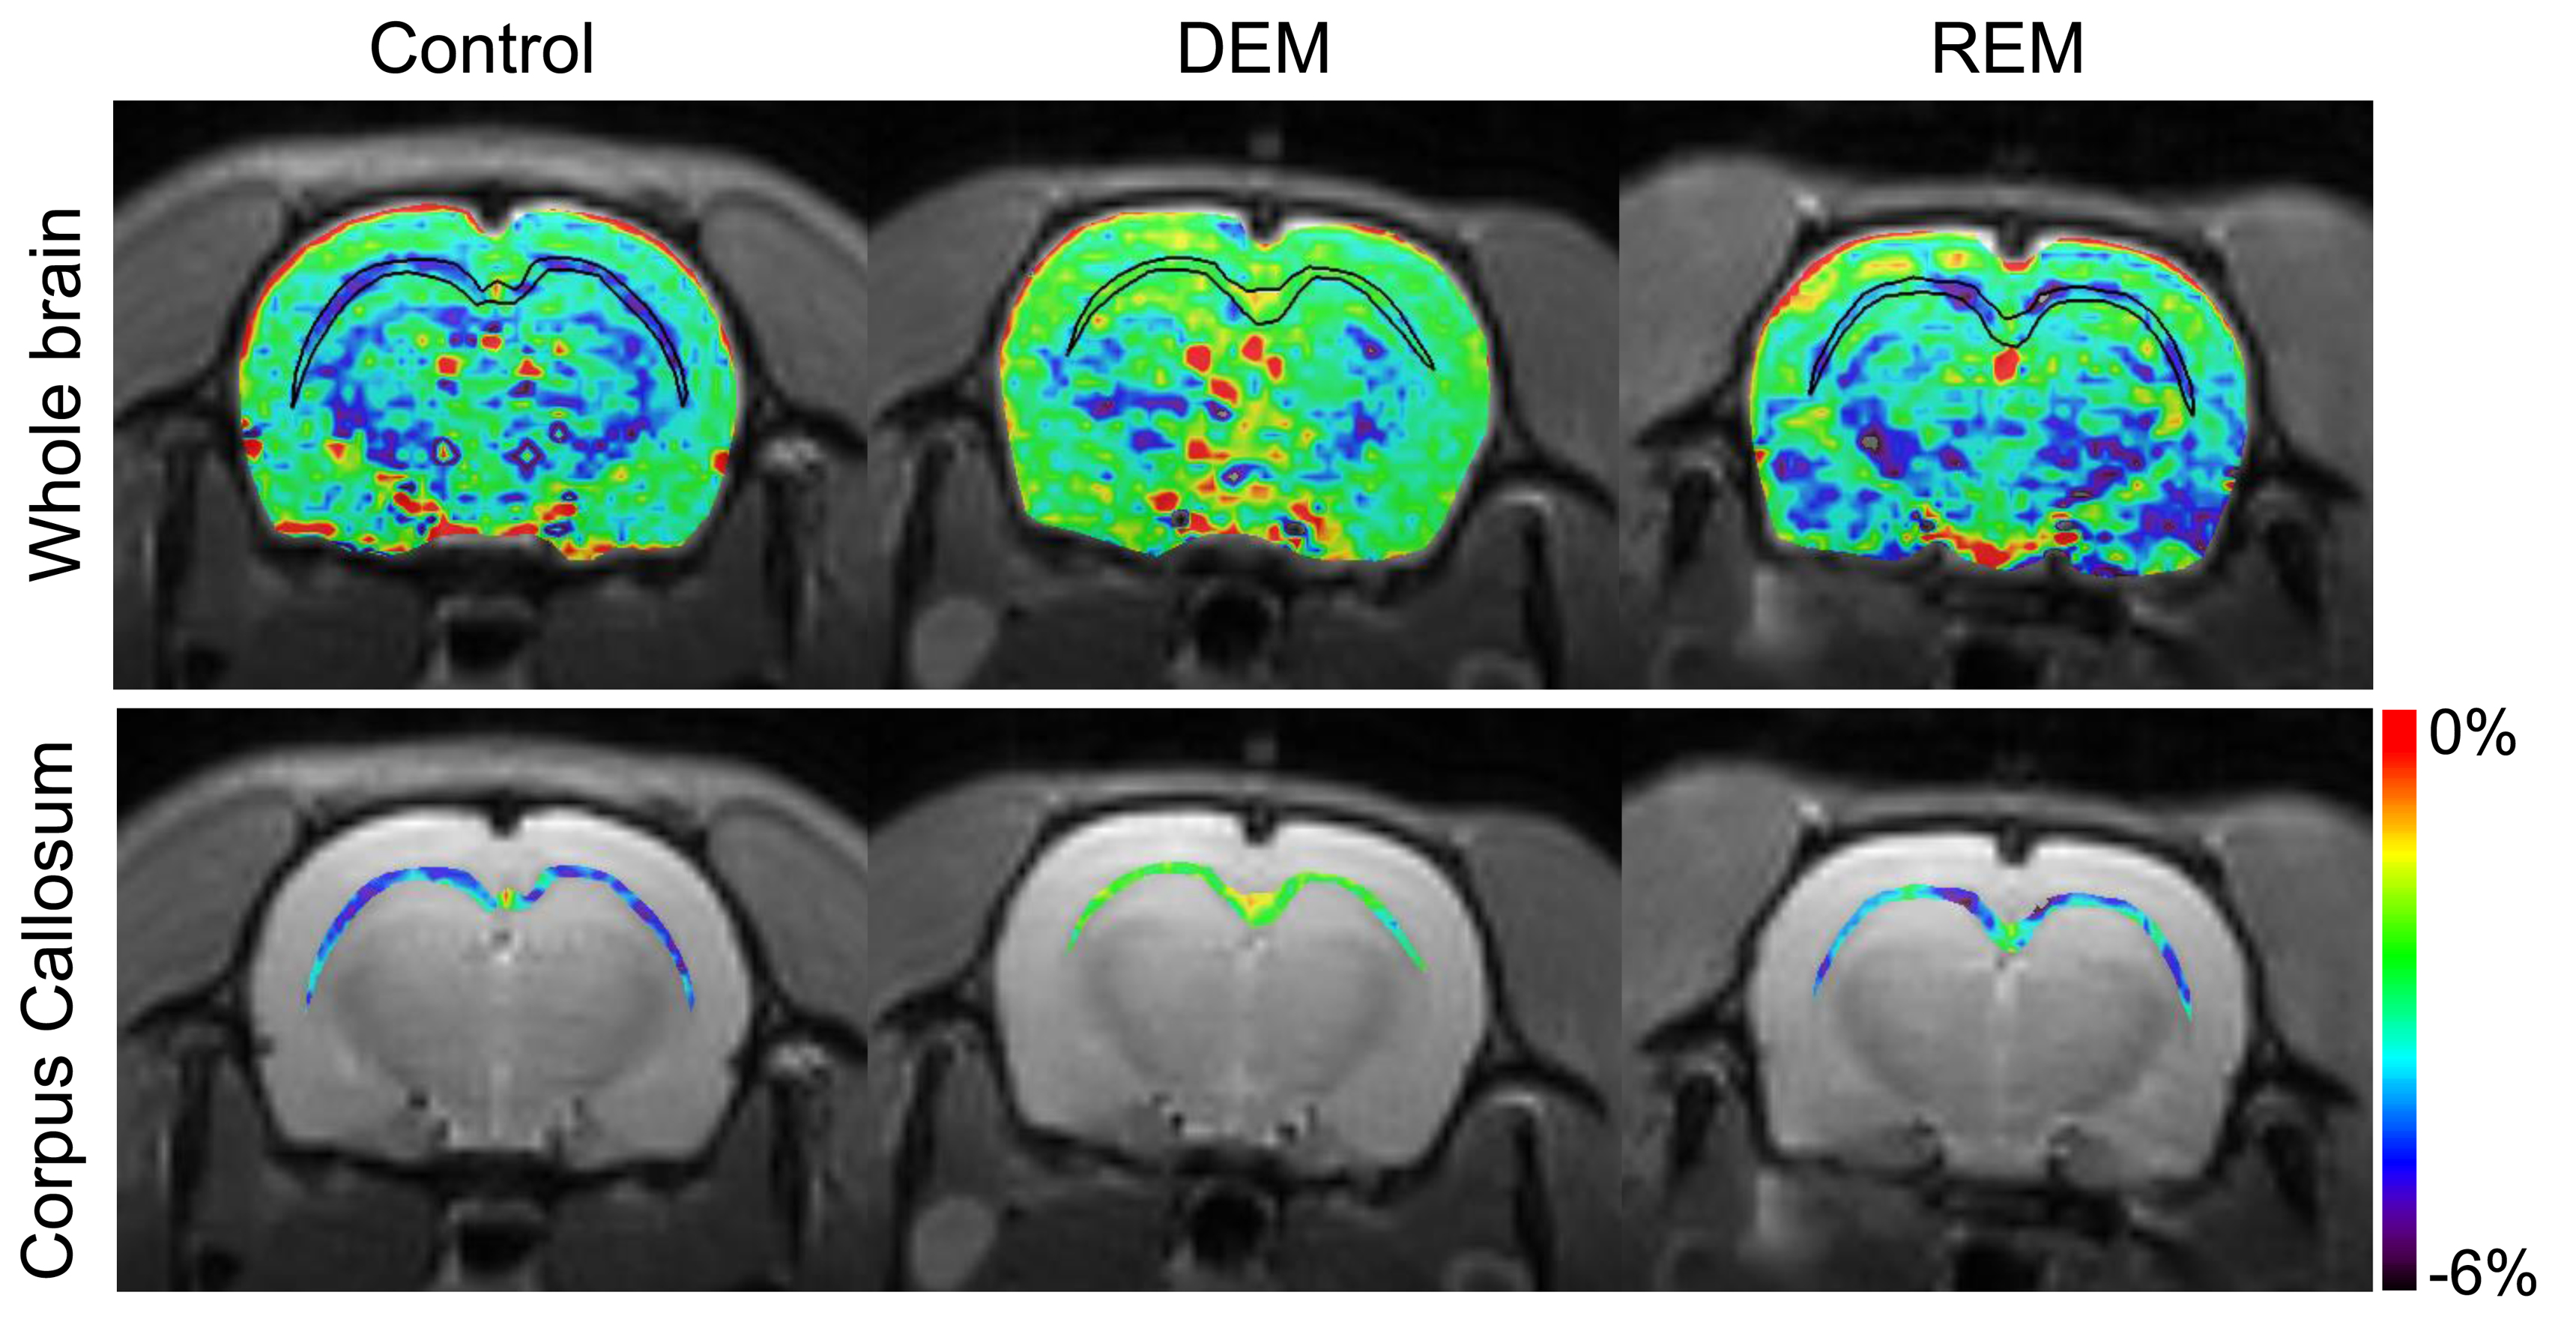
Figure 2a-d shows the average Z-spectra from ROIs, which were set in each experimental group as a function of the frequency offset. Overall, the MTRasym curves showed differences between the DEM and controls, indicating higher CEST signals at 3.5ppm (APTw) in the DEM compared with the controls. The MTRasym curves were negative at all frequency offsets, representing the influence of the upfield NOE effects.9-11 Figure 2e shows the quantified APTw signals from the MTRasym curve at 3.5ppm in each group. The APTw signals between the control and DEM groups were -4.42±0.60% and -2.57±0.48%, respectively, indicating higher in vivo APT signals in the demyelinated lesion (p<0.001). As remyelination progressed after demyelination, the APTw signal of the REM was -3.83±0.67%, which was lower compared with the DEM (p<0.01) and similar to the controls (p = 0.18).Figure 3 shows the APTw map overlaying the unsaturated image for whole-brain regions (top row) and the APTw map focusing on CC region (bottom row) in a representative rat for each group. As shown in quantification results in Fig.2, the APTw signal showed hyperintensities in the DEM compared with that in the controls, which were lower when remyelination proceeded in the REM.
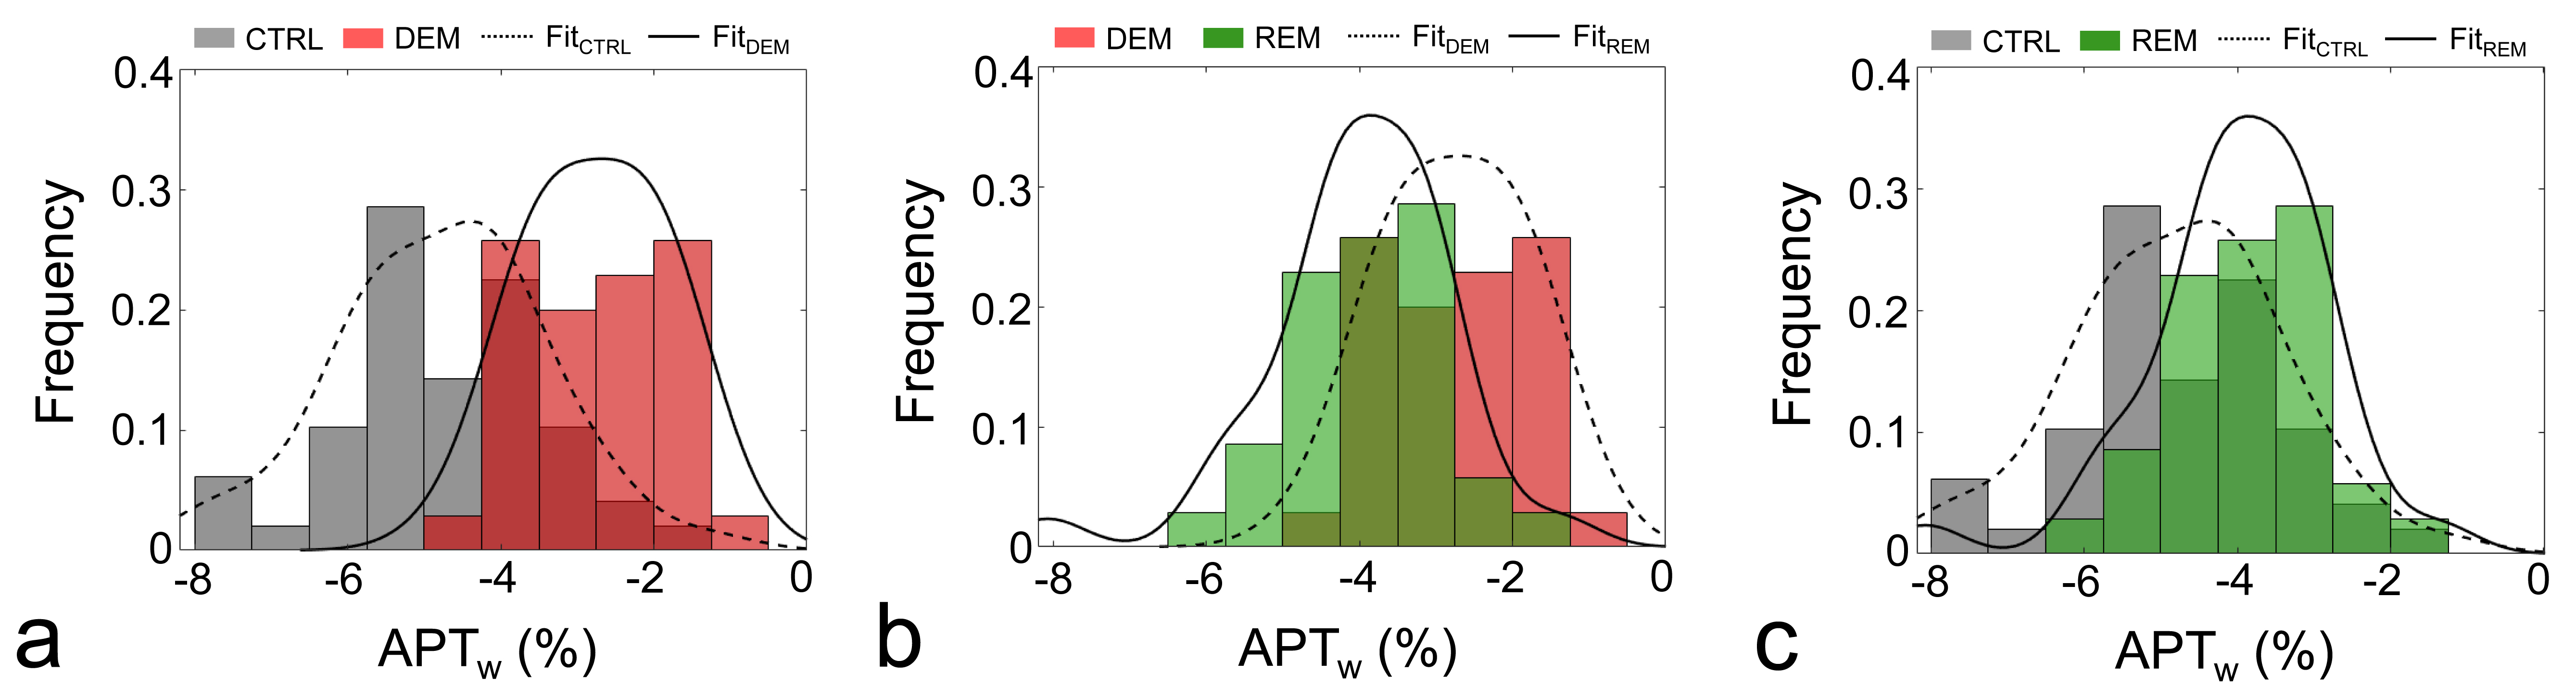
Figure 4 shows the results of the histogram analysis of the APTw signals over the voxels in the ROI. As shown in Fig.2, because the APTw signal in the DEM was higher (p < 0.001) , the corresponding APTw histogram (red) was right-shifted compared with that of controls (gray) (Fig.4a). In Fig.4b, compared with Fig.4a, APTw histogram that was right-shifted (DEM/red) was shifted to the left by the remyelination process (REM/green). After remyelination, histograms between controls and REM were similarly distributed (Fig.4c).
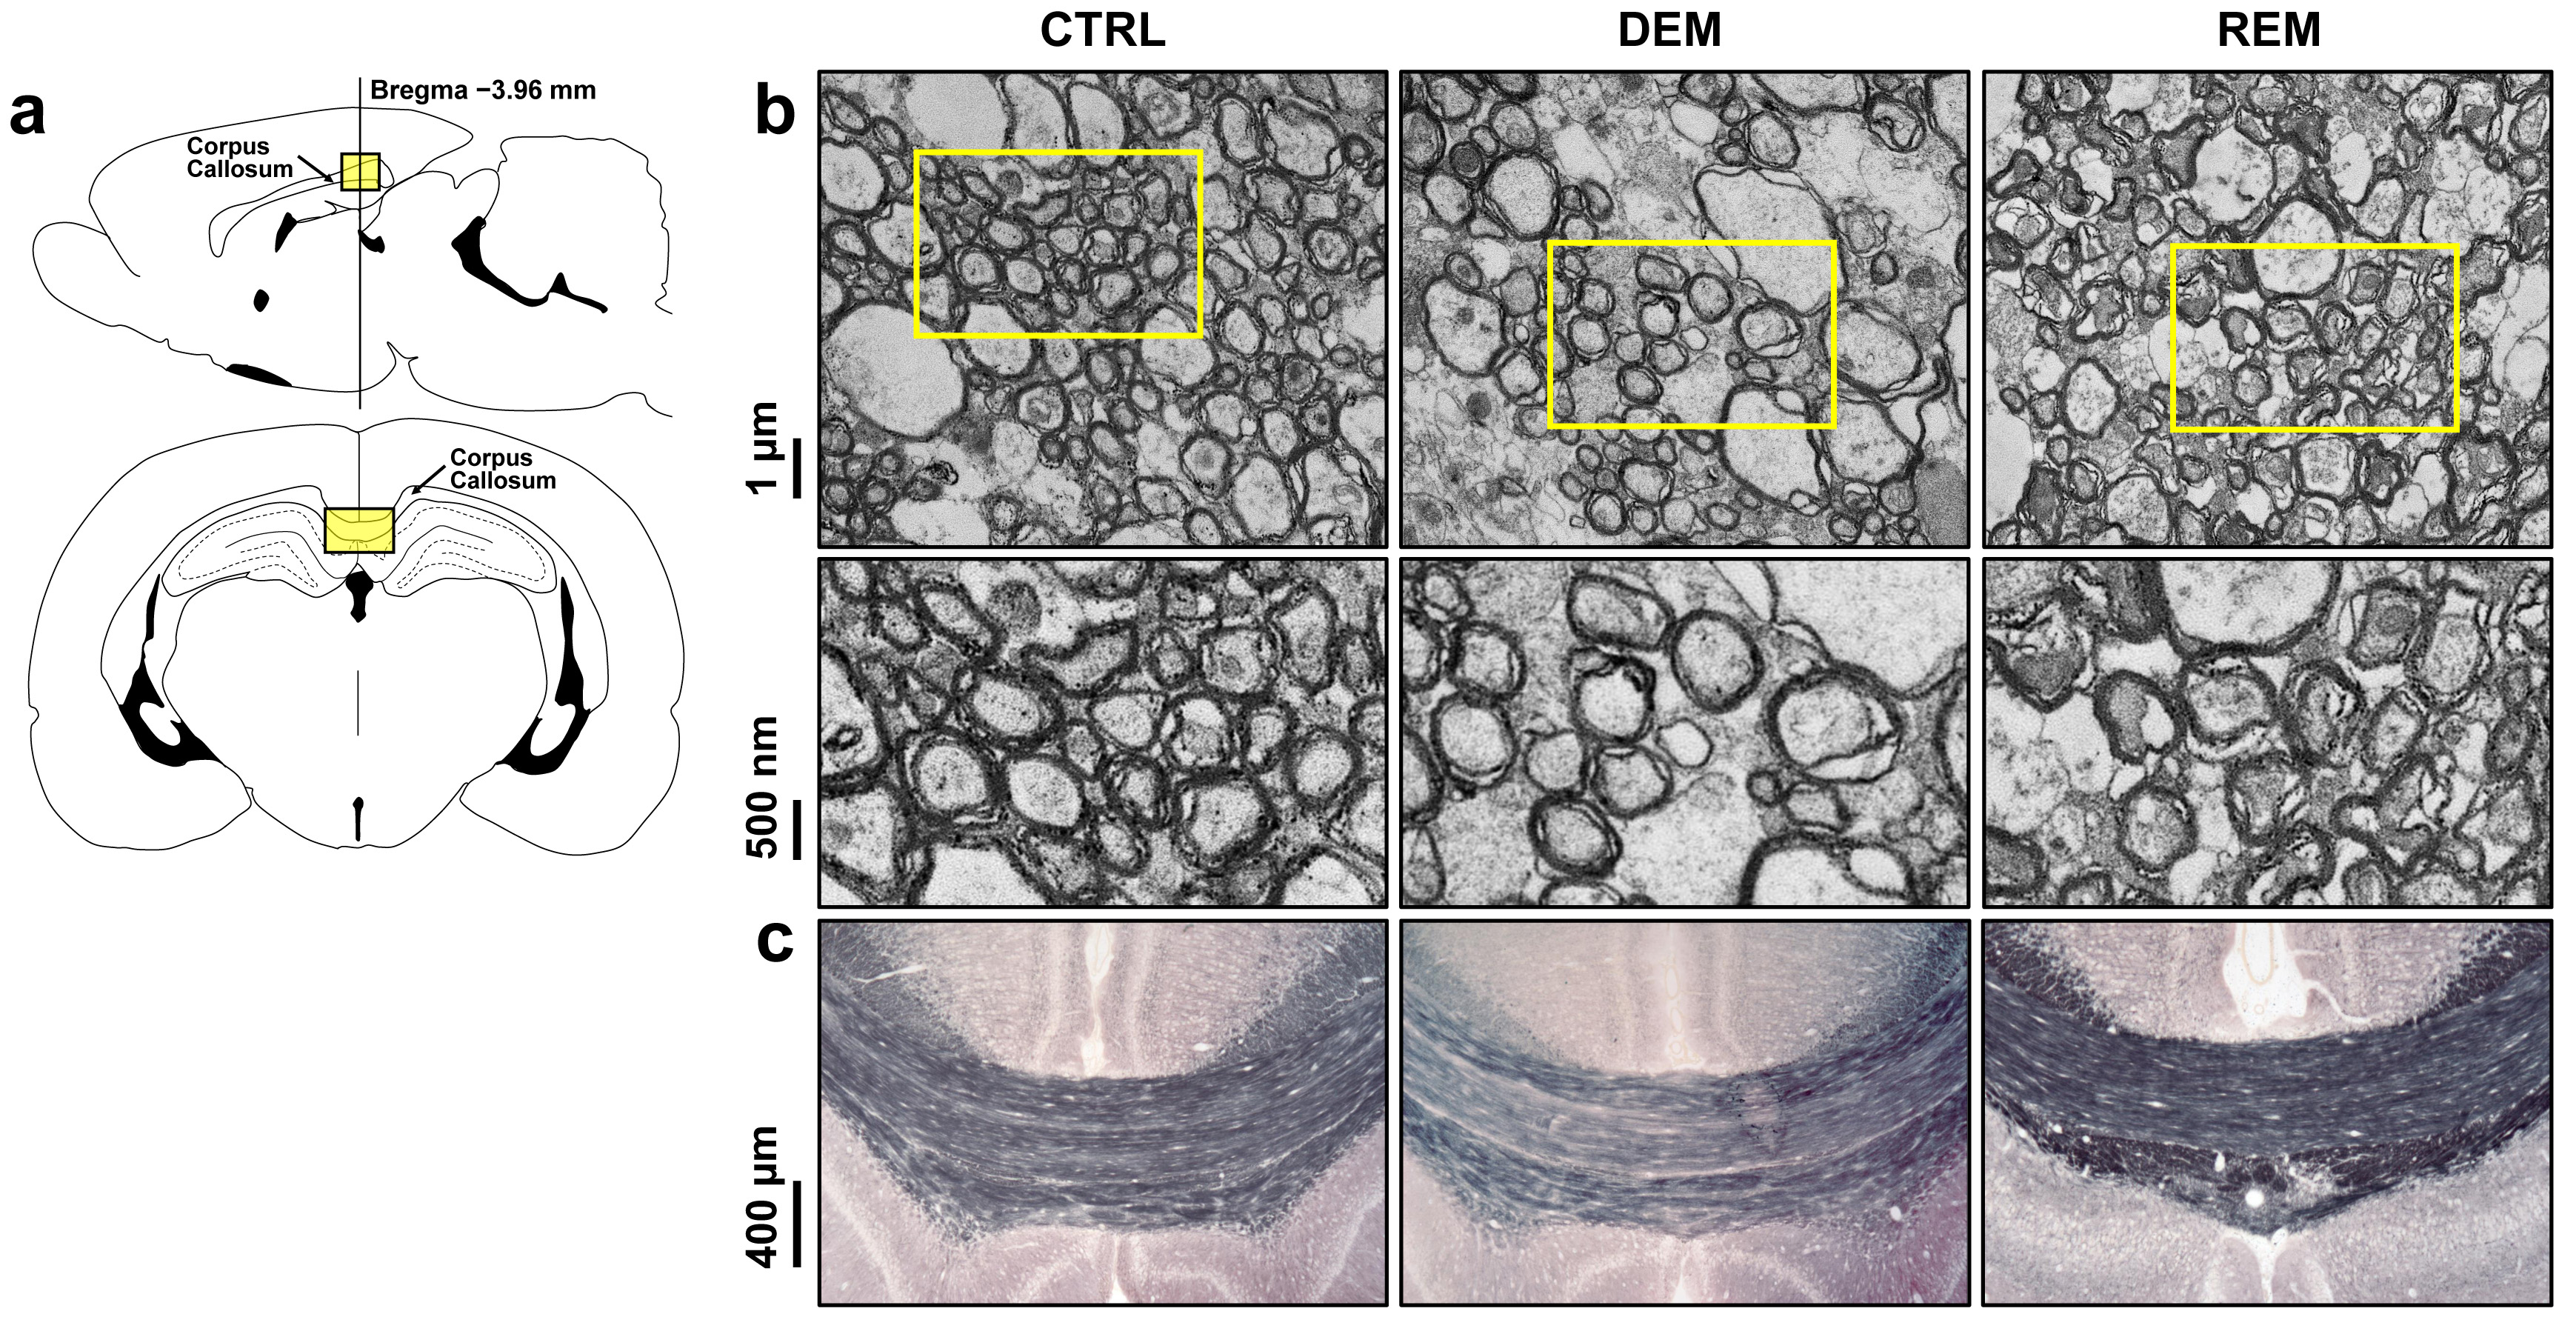
Figure 5 shows histological validation of the DEM and REM. Schematic diagrams (Fig.5a) indicate the studied region of the CC (top/bottom). Representative TEM images show the ultrastructure of myelin sheets around the axons with healthy myelin sheets of controls (left, Fig.5b). At seven weeks of cuprizone diet administration, the axons exhibited a loss of myelin density (middle, Fig.5b). After cuprizone withdrawal, the REM showed recovered myelinated axons in the CC (right, Fig.5b). A representative image of Black-Gold-II staining demonstrated the loss of myelin stain in the DEM (middle Fig.5c) compared with that in controls (left, Fig.5c). The REM showed recovered myelin in staining of the CC (right, Fig.5c).
CONCLUSION
Significant temporal contrast changes in the APTw metric coupled with histological characteristics of both demyelination and remyelination processes indicated the potential usefulness of APTw MRI to monitor earlier myelination processes.Acknowledgements
This work was supported by the National Research Foundation of Korea (NRF) grant funded by the Korean Government (Ministry of Science and ICT, MSIT; NRF-2018R1C1B6004521 and NRF-2020R1A2C1103133).References
1. Franklin RJ, Ffrench-Constant C. Remyelination in the CNS: from biology to therapy. Nat Rev Neurosci. 2008;9(11):839-855.
2. Wingerchuk DM, Lucchinetti CF, Noseworthy JH. Multiple sclerosis: current pathophysiological concepts. Lab Invest. 2001;81(3):263-281.
3. Nathoo N, Yong VW, Dunn JF. Understanding disease processes in multiple sclerosis through magnetic resonance imaging studies in animal models. Neuroimage-Clin. 2014;4:743-756.
4. Wang N, Zhuang J, Wei H, et al. Probing demyelination and remyelination of the cuprizone mouse model using multimodality MRI. J Magn Reson Imaging. 2019;50(6):1852-1865.
5. Orije J, Kara F, Guglielmetti C, et al. Longitudinal monitoring of metabolic alterations in cuprizone mouse model of multiple sclerosis using 1H-magnetic resonance spectroscopy. Neuroimage. 2015;114:128-135.
6. Sagiyama K, Mashimo T, Togao O, et al. In vivo chemical exchange saturation transfer imaging allows early detection of a therapeutic response in glioblastoma. Proceedings of the National Academy of Sciences of the United States of America. 2014;111(12):4542-4547.
7. Kim M, Gillen J, Landman BA, et al. Water saturation shift referencing (WASSR) for chemical exchange saturation transfer (CEST) experiments. Magn Reson Med. 2009;61(6):1441-1450.
8. Zhou JY, Payen JF, Wilson DA, Traystman RJ, van Zijl PCM. Using the amide proton signals of intracellular proteins and peptides to detect pH effects in MRI. Nat Med. 2003;9(8):1085-1090.
9. Jones CK, Huang A, Xu JD, et al. Nuclear Overhauser enhancement (NOE) imaging in the human brain at 7 T. Neuroimage. 2013;77:114-124.
10. Heo HY, Jones CK, Hua J, et al. Whole-Brain Amide Proton Transfer (APT) and Nuclear Overhauser Enhancement (NOE) Imaging in Glioma Patients Using Low-Power Steady-State Pulsed Chemical Exchange Saturation Transfer (CEST) Imaging at 7T. J Magn Reson Imaging. 2016;44(1):41-50.
11. Liu DP, Zhou JY, Xue R, et al. Quantitative Characterization of Nuclear Overhauser Enhancement and Amide Proton Transfer Effects in the Human Brain at 7 Tesla. Magn Reson Med. 2013;70(4):1070-1081.
Figures