3705
Potential feasibility of new parameters on CEST imaging by multi pool model in relation to 11C-MET uptake on PET/CT and IDH1 mutation in gliomas1Department of Radiology, Faculty of Medicine, Kagawa University, Miki-cho, Japan, 2Department of Neurological Surgery, Faculty of Medicine, Kagawa University, Miki-cho, Japan, 3Department of Clinical Radiology, Kagawa University Hospital, Miki-cho, Japan, 4Global MR Applications & Workflow, GE Healthcare Japan, Hino-shi, Japan
Synopsis
The purpose of this study was to evaluate the correlation between parameters on CEST imaging by multi pool model and 11C-methionine (MET) uptake on PET/CT in gliomas. The maximum and mean values of the parameters on CEST imaging were measured. 11C-MET uptake was semiquantitatively assessed using tumor-to-contralateral normal brain tissue (T/N) ratio. Several correlation coefficients between MTRasym and T/N ratio, and APT_T1 and MET T/N ratio were relatively high, but not statistically significant. These preliminary results suggest that parameters on CEST imaging by multi pool model seems to correlate with 11C-MET uptake on PET/CT in patients with gliomas.
Introduction
Although MTR asymmetry (MTRasym) is often used as a chemical exchange saturation transfer (CEST) parameter, it has some pitfalls1. Positron emission tomography (PET) with 11C-methionine (MET) has been widely used as an imaging tool for brain tumor detection and tumor grading in patients with gliomas2. However, to the best of our knowledge, there are few reports that combine them together3,4. The purpose of this study was to evaluate the correlation of parameters on CEST imaging by multi pool model and 11C-methionine (MET) uptake on PET/CT in gliomas.Methods
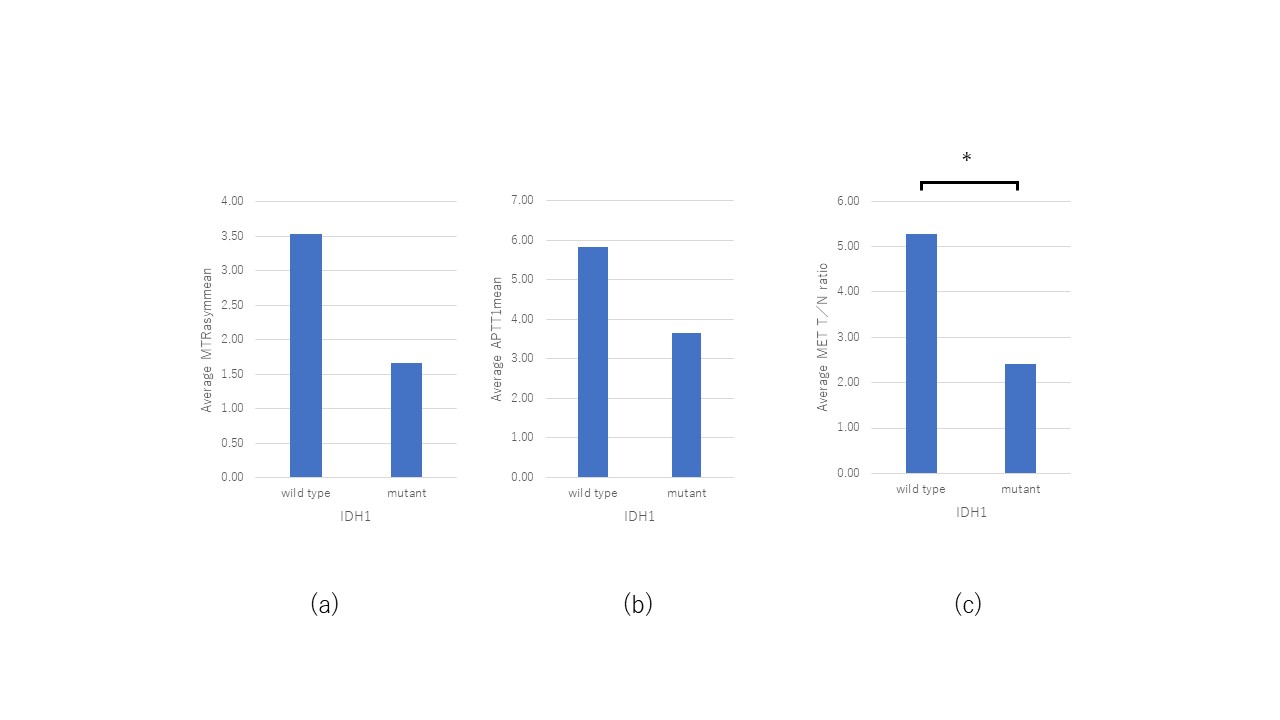
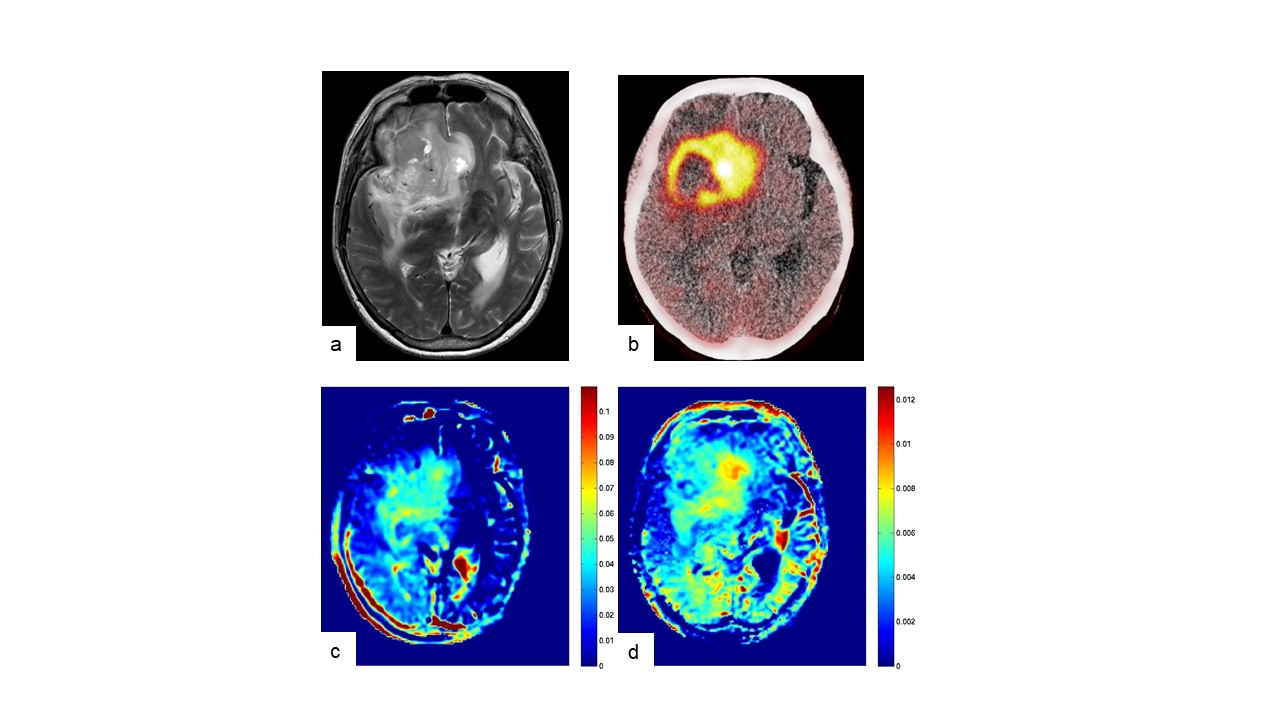
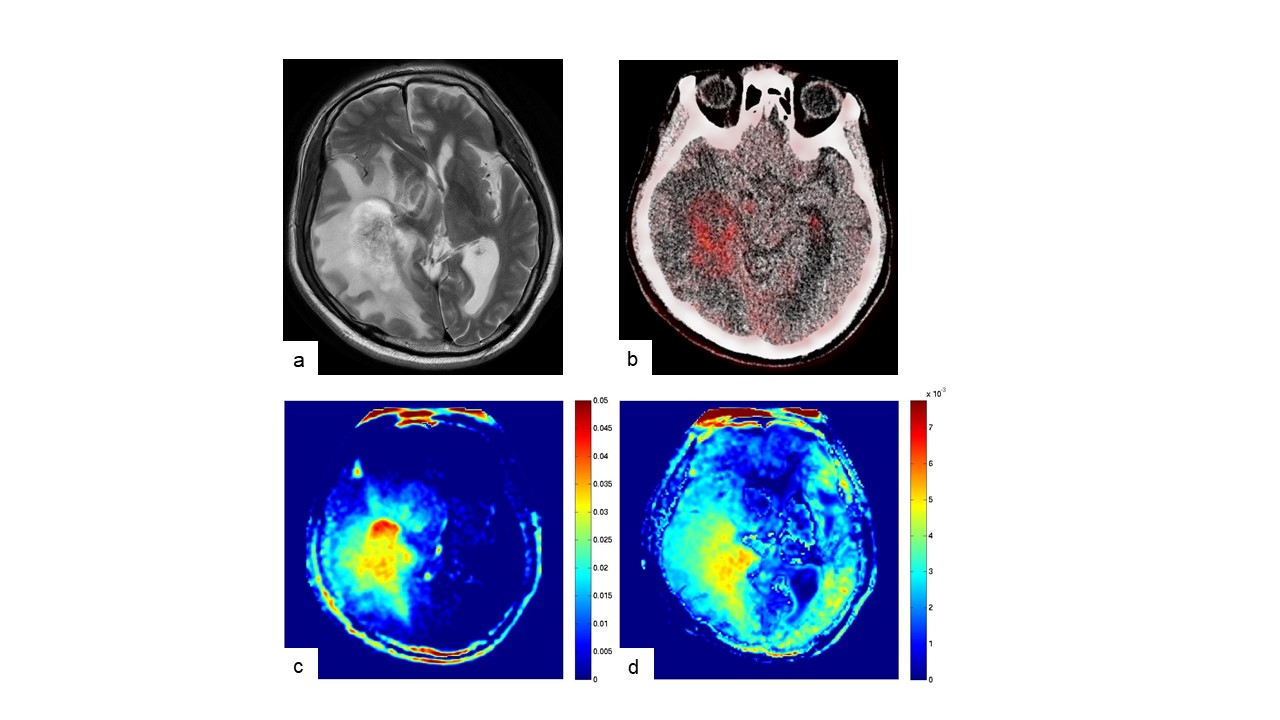
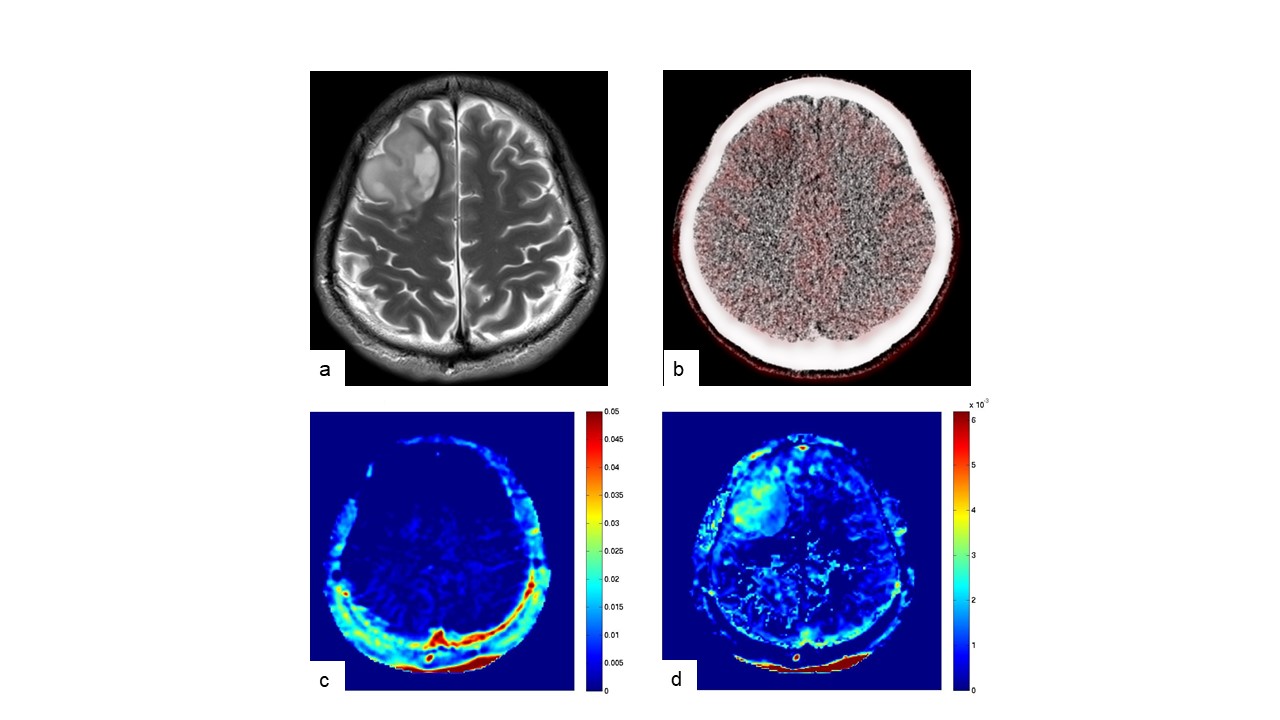
Preoperative MRI and 11C-MET PET/CT were performed in 9 gliomas. Multi pool model assumes the magnetization transfer (MT) between free water pool, APT pool and binding water MT pool. Some known parameters (i.e. Transfer rate, T2 of binding water pool) are reused from the literature5. Unknown parameters (T2/T1 of free water pool, density of proton in each pool) was calculated by solving Bloch equation. Because the density of APT pool cannot be separated from free water time constant in this method, "APT density" x "APT transfer rate" x ("Free water T1" or "T2") was visualized as APT_T2 or APT_T1, respectively. MT rate is a binding water MT saturation rate at 7ppm in Z-spectrum. The maximum and mean values of the parameters (MTRasym, APT_T1, APT_T2, T2/T1 ratio, and MT) on CEST imaging were measured respectively. 11C-MET uptake was semiquantitatively assessed using tumor-to-contralateral normal brain tissue (T/N) ratio. The presence of isocitrate dehydrogenase 1 (IDH1) mutation in tumor specimens was examined by immunohistochemistry and compared with parameters on CEST imaging and MET T/N ratio.Results and Discussion
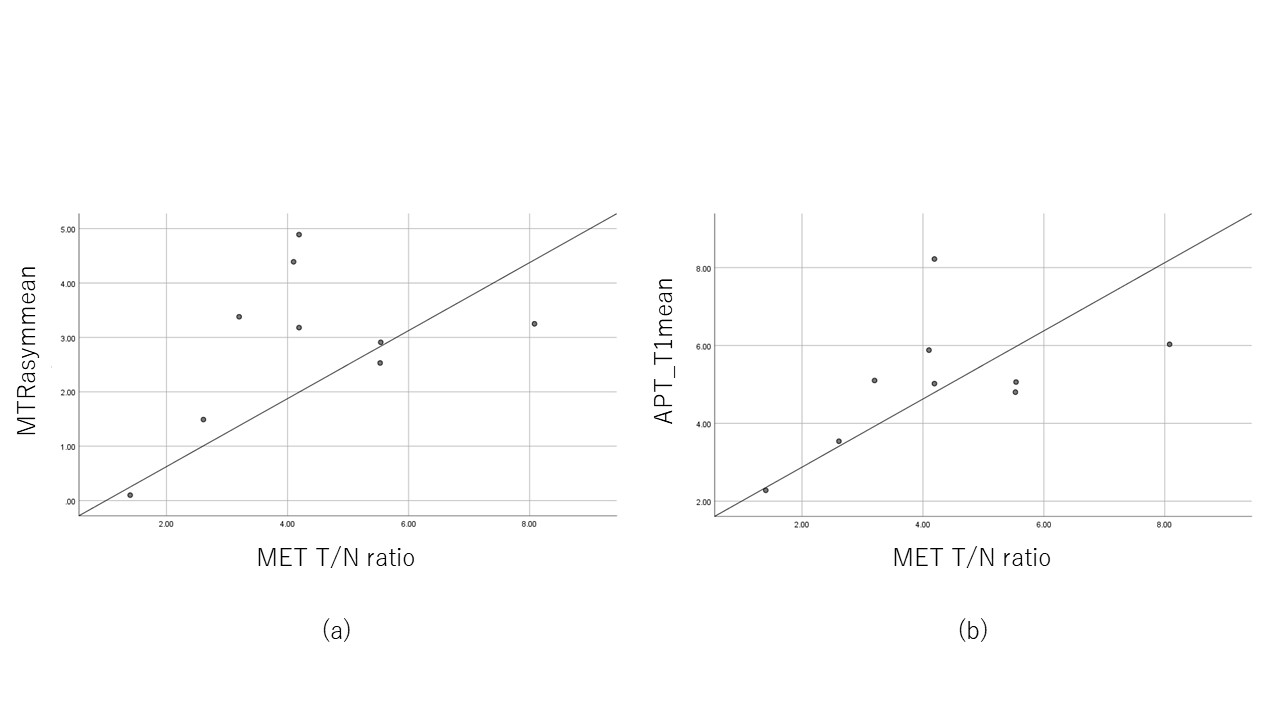
The mean MTRasym signal intensity (SI) values and the mean APT_T1 SI values in grade IV gliomas (n = 7) were higher than those in grade III gliomas (n = 2). There were no significant correlations between parameters on CEST imaging and MET T/N ratio maybe due to small sample size. However, several correlation coefficients between MTRasymmax and MET T/N ratio, MTRasymmean and MET T/N ratio, APT_T1max and MET T/N ratio, and APT_T1mean and MET T/N ratio were relatively high (r = 0.38, 0.46, 0.49, and 0.53, respectively). MET T/N ratio of IDH1-mutant glioma patients (n = 3) was significantly lower than that of IDH1 wildtype patients (n = 6) (p<0.05). As for MTRasymmax, MTRasymmean, APT_T1max and APT_T1mean, similar trends were observed, but not statistically significant. These results indicate a possibility that APT_T1max and APT_T1mean in gliomas is more meaningful than MTRasymmax and MTRasymmean to predict MET T/N ratio.Conclusion
These preliminary results suggest that parameters on CEST imaging by multi pool model seems to correlate with 11C-MET uptake on PET/CT in patients with gliomas.Acknowledgements
No acknowledgement found.References
1. Zhou J, Heo HY, Knutsson L, et al. APT-Weighted MRI: Techniques, Current Neuro Applications, and Challenging Issues. J Magn Reson Imaging. 2019;50(2):347–364.
2. Glaudemans AW, Enting RH, Heesters MA, et al. Value of 11C-methionine PET in imaging brain tumours and metastases. Eur J Nucl Med Mol Imaging. 2013;40(4):615-35.
3. da Silva NA, Lohmann P, Fairney J, et al. Hybrid MR-PET of brain tumours using amino acid PET and chemical exchange saturation transfer MRI. Eur J Nucl Med Mol Imaging. 2018;45(6):1031-1040.
4. Schön S, Cabello J, Liesche-Starnecker F, et al. Imaging glioma biology: spatial comparison of amino acid PET, amide proton transfer, and perfusion-weighted MRI in newly diagnosed gliomas. Eur J Nucl Med Mol Imaging. 2020;47(6):1468-1475.
5. Miyoshi M, Harada M, Kanazawa Y, et al. CEST and binding water MT separation in brain tumor by multi pool model CEST Peak Extraction method. Proceedings of the 25th Annual Meeting of ISMRM. 2017;4242.
Figures