3703
The value of Amide Proton Transfer weighted and Dynamic Contrast-Enhanced imaging in peritumoral edema assisted grading of gliomas1Department of Magnetic Resonance, Lanzhou University Second Hospital, Lanzhou, China, 2Philips Healthcare, Xi'an, China
Synopsis
The study was to quantitatively analyze the peritumoral infiltration assisted gliomas grading by using amide proton transfer (APT) and dynamic contrast-enhanced imaging (DCE). Although many scholars use APT and DCE to help grading gliomas, but few of them pay attention to the peritumoral area. This research investigated the relationship between APT and DCE based Ktrans value in peritumoral. The results show that these two parameters are significantly correlated. Therefore, the APT and Ktrans value of peritumor edema in gliomas may be used to differentiate glioma grades, and APT value performs better in distinguishing grade Ⅱ and Ⅲ.
Introduction
Clinically, gliomas grade is a key factor influencing the choice of therapies, and the prognosis substantially differs according to the grade[1]. Edema is the most common complication of brain tumors. The degree of peritumoral edema found is significantly related to the grade of the glioma. The reason is peritumoral brain edema supplies a suitable niche for peritumoral invasive cells[2]. DCE based Ktrans , which has been validated a useful parameter to assess the process of tumor invasion, significantly correlated with proangiogenic factor expression. However, DCE is an invasive examination with many limitations. In addition, it is likely unable to differentiate between subtypes of grade II or III gliomas[3]. Amide proton transfer weighted (APTw) imaging is a non-invasive technique that can evaluate glioma. However, when using APT to grade gliomas, previous researches always focused the ROI on the tumor solid rather than the peritumoral brain edema[4]. In this study, we intend to investigate the value of APTw imaging around peritumoral edema to help grading brain gliomas before surgery.Methods
Seventeen patients with pathological confirmed brain gliomas were enrolled, dividing into three groups, the WHO Ⅱ type group (5 patients), the WHO Ⅲ type group (7 patients) and the WHO Ⅳ group (5 patients). All patients underwent MR imaging on a 3T scanner (Ingenia CX, Philips Healthcare, the Netherlands) using a 32 channel head coil. DCE-MRI imaging was performed with a dynamic gradient echo T1-weighted sequence with 0.2ml/kg of Gadodiamide (Omniscan, 0.5mmol/L; GE Healthcare Ireland Limited). The Ktrans map were calculated by using Intellispace Portal workstation. APT imaging was performed with 3D TSE-DIXON sequence. B0 corrected APT images were reconstructed automatically online by the Philips plugin tool. DCE and APT images were automatically co-registered to the FLAIR and post-contrast 3D-T1W images by performing a rigid transformation. In order to accurately define the tumor borders. The region of maximal abnormality within the lesion volume (hotspot) was determined with a visual inspection on Ktrans and APTw maps. Three separate ROIs with an area of 25-30 mm2 were placed on the hotspot and peritumoral brain edema, avoiding intra-tumoral blood vessels, hamorrhage, cystic or necrotic regions. Then the mean value for each parameter (APTw and Ktrans) was recorded. Differences between three groups were analyzed using One-way analysis of variance (ANOVA). Receiver operator characteristic (ROC) and area under curve (AUC) was performed to determine the diagnostic efficiency.Results
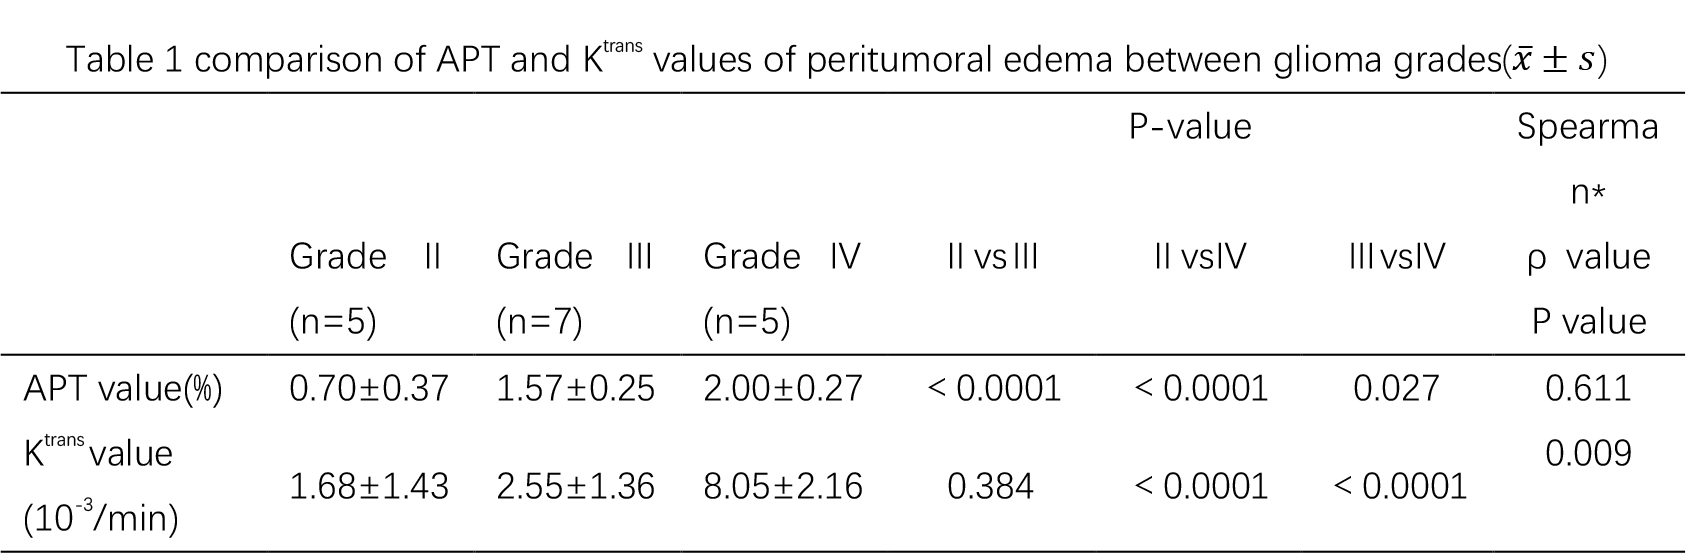
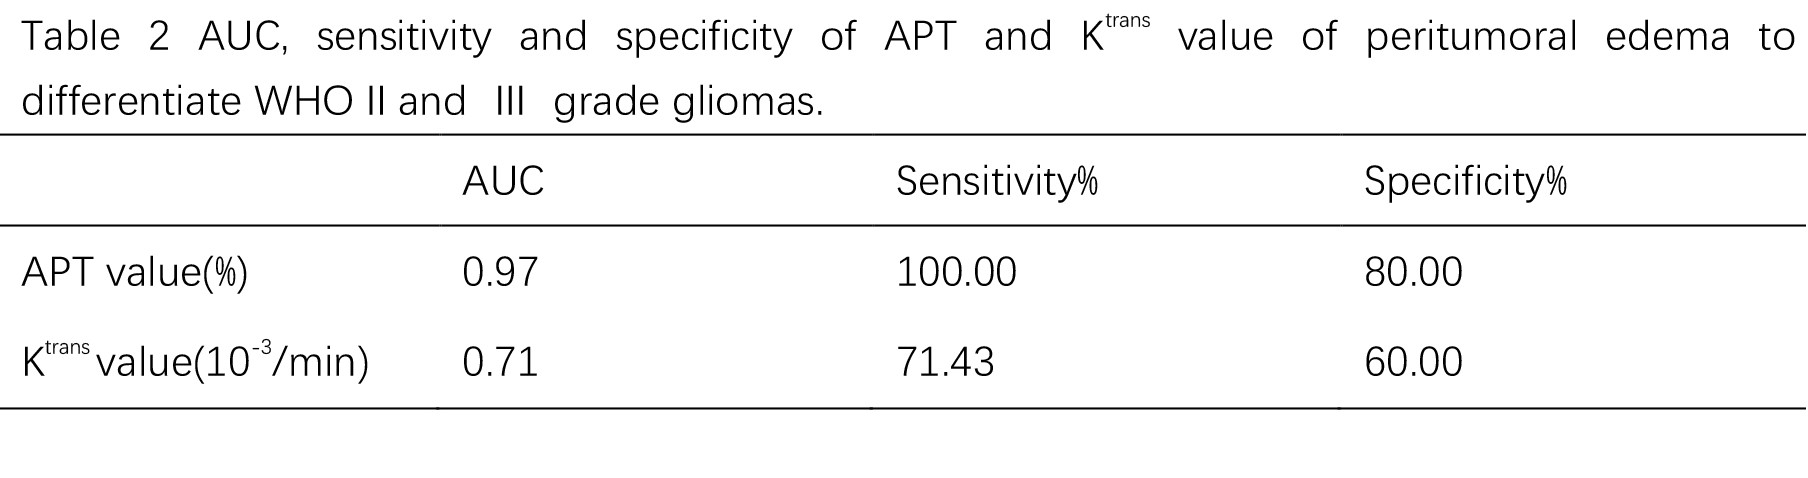
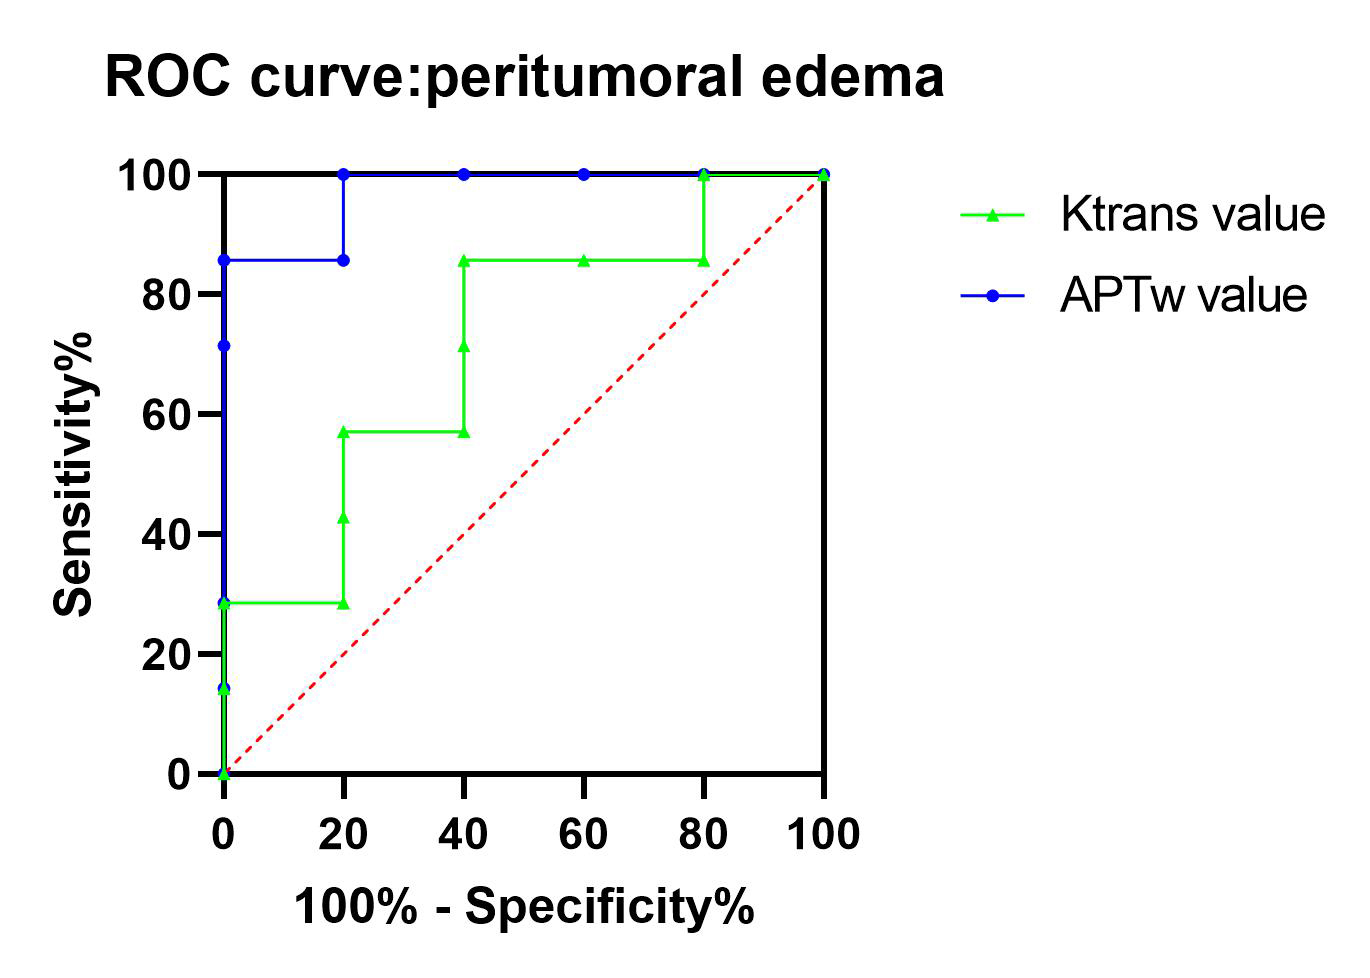
The glioma samples for surgical biopsy confirmed (5 cases of WHO Ⅱ, 7 cases of WHO Ⅲ, 5 cases of WHO Ⅳ) were collected. The APT and Ktrans value in peritumoral edema increased with the increase in glioma grade and the difference was statistically significant (P<0.05). The APT value of WHO Ⅱ, WHO Ⅲ and WHO Ⅳ was 0.70±0.37, 1.57±0.25 and 2.00±0.27. The Ktrans value was 1.68±1.43, 2.55±1.36 and 8.05±2.16, respectively (see table 1). However, the Ktrans value could not discriminate between grade Ⅱ and grade Ⅲ gliomas as the APT value could. Statistics show that the two value are correlated (p=0.009, ρ=0.611). ROC discriminated the peritumor edema between grades Ⅱ and Ⅲ (AUC: 0.971 for APT, 0.714 for Ktrans ; 95%CI: 0.89-1.00 for APT, 0.41-1.00 for Ktrans), see table 2 and figure 1.Discussion
The present study quantitatively analyzed the peritumoral infiltration and the effect of angiogenesis on peritumoral tissue of different glioma grades, and provided ranges for accurate pre-operative clinical assessment of tumor grades. Zhao et al. reported that Ktrans exhibited the highest sensitivity and specificity for evaluating the tumor grade, inspiring researchers to use this parameter to focus on the peritumoral edema area[5]. Meanwhile, in gliomas, the number of mobile protons in proteins or peptides is usually varied at different stages and also shows difference relative to surrounding normal tissues. As Zhou et al. described, APT imaging may be a valuable noninvasive staging of disease in clinical applications[6], which means APT value may serve as a potential biomarker for differentiate glioma grades. Previous studies measured the APT value of the solid part of gliomas to help distinguish between high-grade and low-grade gliomas, while few of research using APT imaging to peritumoral edema. Bruger et al. validated the boundary of gliomas using pathology[7]. The boundary of gliomas is neither an area of T1WI enhancement nor a region of T2WI high signal. High-grade gliomas could show peritumoral infiltration of tumor cells and increased vascular permeability will also lead to changes in APT values. The result of the study also proved that statement. For increased tumor grades, microvascular permeability of peritumor edema increased and significantly increased APT and Ktrans value. This change may indicate the breakdown of the blood-brain barrier, which suggests that tumor cells may infiltrate in peritumor edema. Meanwhile, the APT shows a unique advantage in distinguishing the WHO Ⅱ and Ⅲ grade of gliomas with a noninvasive way.Conclusion
The APT value and the DCE-MRI parameters of Ktrans of peritumor edema may serve as a potential biomarker for differentiate glioma grades. The former may be more conductive to differentiate grade Ⅱ and grade Ⅲ gliomas.Acknowledgements
This study was supported by Talent Innovation and Entrepreneurship Project of Lanzhou Chengguan District (Grant No. 2020RCCX0034).References
1.Louis DN, Ohgaki H, Wiestler OD, et al.The 2007 WHO classificati on of tumours of the central nervous system. Acta Neuropathol. 2007 Aug;114(2):97-109.
2.Zhi-Xiong Lin.Glioma-related edema:new insight into molecular mechanisms and their clinical implications[J].Chinese Journal of Cancer,2013,32(01):49-52.
3.Xie T, Chen X, Fang J,et al. Textural features of dynamic contrast-enhanced MRI derived model-free and model-based parameter maps in glioma grading. J Magn Reson Imaging. 2018 Apr;47(4):1099-1111.
4.Schön S, Cabello J, Liesche-Starnecker F, et al.Imaging glioma biology: spatial comparison of amino acid PET, amide proton transfer, and perfusion-weighted MRI in newly diagnosed gliomas. Eur J Nucl Med Mol Imaging. 2020 Jun;47(6):1468-1475.
5. Zhao M, Guo LL, Huang N, et al. Quantitative analysis of permeability for glioma grading using dynamic contrast-enhanced magnetic resonance imaging. Oncol Lett. 2017 Nov;14(5):5418-5426.
6. Zhou J, Lal B, Wilson DA, et al. Amide proton transfer (APT) contrast for imaging of brain tumors. Magn Reson Med. 2003 Dec;50(6):1120-6.
7. Bruger PC, Vogel FS, Green SB, et al.Glioblastoma multiforme and anaplastie astrocytoma: Pathologic criteria and prognostic implications. Cancer. 1985 Sep 1;56(5):1106-11.
Figures