3702
ihMT Analysis of Myelin in the Shiverer Mouse Brain1Radiology, NYU Medical Center, New York, NY, United States, 2University of Maryland School of Medicine, Baltimore, MD, United States
Synopsis
Although multiple MRI techniques have been developed to detect and monitor myelin loss and repair, their sensitivity to myelin is often impaired by the underlying pathology. In this study, we demonstrate that inhomogeneous magnetization transfer (ihMT) can detect residual non-compact myelin in the context of hypercellular white matter in the dysmyelinating shiverer mouse model with optimized imaging parameters, whereas conventional MT show no apparent contrast. This result suggests that ihMT has higher sensitivity to myelin than conventional MT in the presence of cell infiltrations.
Introduction
Myelin plays an important role in maintaining axons physically and metabolically for speedy nerve conduction, and therefore loss of myelin integrity caused by several neurological diseases can lead to severe functional deficits. Although multiple MRI techniques have been developed to detect myelin loss [1], and recent meta-analysis shows strong correlations between MRI-based myelin markers and histological measurements [2], information on their sensitivity to myelin in the presence of cellular infiltrates or neuroinflammation is still lacking. For example, in many pathological conditions such as dysmyelination, stroke or TBI there is residual myelin within the pathology and detection of that myelin at high sensitively has been challenging. A recently developed technique, inhomogeneous magnetization transfer (ihMT) [3, 4], promises higher sensitivity to myelin than conventional MT-MRI with better saturation of signals from myelin lipid membrane components [4-6]. Both human and animal studies have demonstrated the sensitivity of ihMT to white matter myelin with optimized imaging parameters, including inter-pulse delay, power, and offset frequency of the saturation pulses [7]. In this study, we further investigated the sensitivity ihMT to myelin in the rag2-/--shiverer mouse model, which lacks functional compact myelin due to the mutation of the myelin basic protein. The shiverer mouse brain still possess limited loose myelin membrane, but also show higher cell density than controls [8]. We hypothesize that ihMT can detect the remaining myelin membrane in the shiverer mouse brains.Methods
The animal protocol has been approved by the institutional animal care and use committees. The rag2-/- background strain lacks mature lymphocytes and present severe immune deficiency. PFA fixed post-mortem rag2-/- and rag2-/--Shiverer mouse brains (3 months old, n = 3 in each group) were imaged using a 7 Tesla MRI system with a quadrature transmit volume coil (70 mm diameter) and a 4-channel receive-only phased array cryocoil (Bruker Biospin, Billerica, MA, USA). MT and ihMT images were acquired using a RARE sequence with a chain of two hundred Gaussian saturation pulses with a delay of 0.01, 0.4, 0.8, 2, 4 ms; with a power of 4, 8, 12, 16 μT; and a single offset frequency of − 4, 8, 12, 16, 20, 24 kHz for MT, an dual offset frequency of ±4, ±8, ±12, ±16, ±20, ±24 kHz for ihMT from water and the following parameters: TE/TR = 6 ms/4000 ms, 2 signal averages, echo train length of 6, and a native resolution of 0.125 × 0.125 × 1.25 mm. Images with no saturation pulse (M0) were also acquired and MTR and ihMTR maps were calculated as: MTR = 1- Mt/M0, ihMTR = ((M++M-)-2M±)/M0.Results
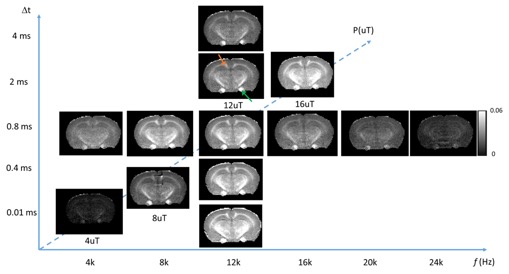
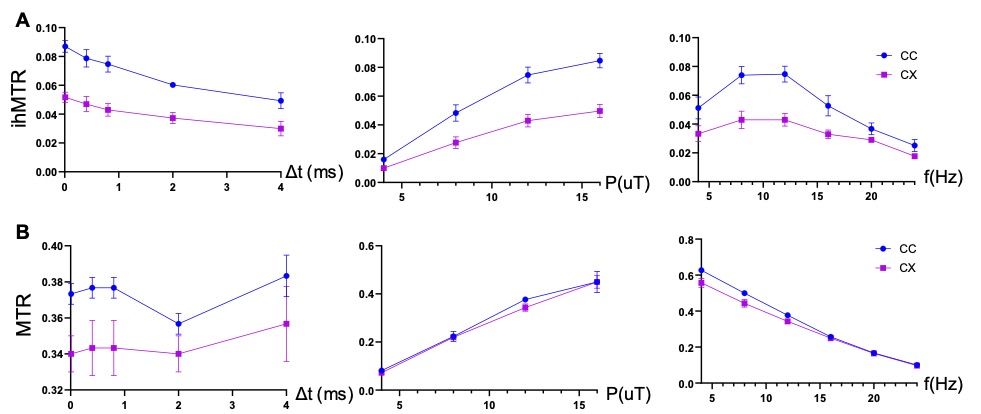
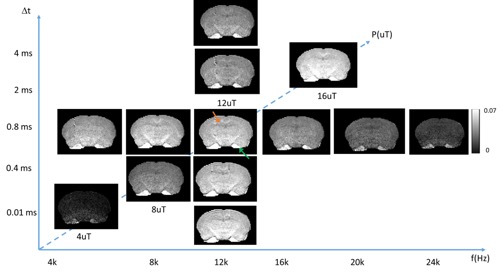
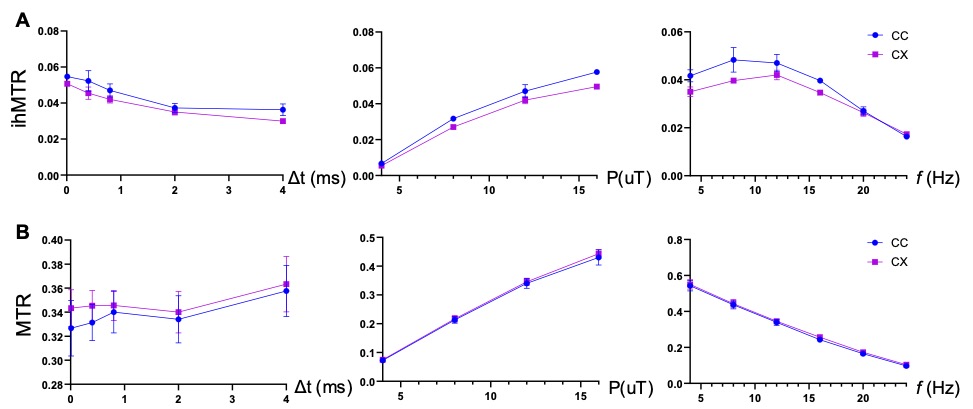
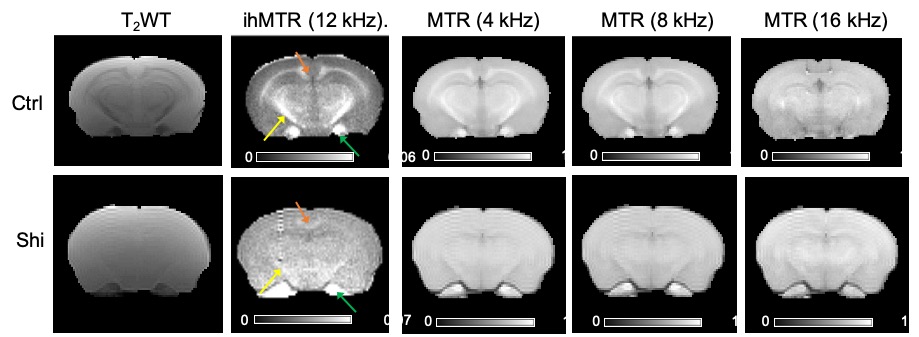
Fig. 1 compares images of a rag2-/- mouse acquired with different saturation parameters, which modulated the contrasts between myelin-rich white matter structures such as the corpus callosum (CC) and gray matter such as cortex (CX). Quantitative analysis of the rag2-/- mouse brain data (Fig. 2) showed optimal CC and CX contrast in ihMTR at short inter-pulse delay (Δt < 2 ms), high saturation power (> 10 uT), and offset frequencies between 8 and 10 kHz. In comparison, the optimal contrast between CC and CX in conventional MT-MRI among the conditions test here was found at 4 kHz offset frequency with high saturation power. The percentage difference between CC and CX signals were approximately 30% for ihMTR and 10% for conventional MT. With the optimal imaging parameters based on results in Figs. 1-2, the CC in the shiverer mouse brains can be separated from the surrounding cortex in the ihMTR map (Fig. 3). Fig. 4 shows that the CC in the shiverer mouse brains had slightly higher ihMTR than the CX, and the contrast was highest at an offset frequency of 8 kHz. In comparison, conventional MT results showed lower MTR values in the CC than CX, for all the conditions tested here. Further comparisons with T2-weighted and MTR images at 4, 8, and 16 kHz offset frequencies (Fig. 5) suggested that only the ihMTR results showed contrasts between CC and CX. The trigeminal nerve, which was part of the peripheral nervous system and not affected by the mutation in the shiverer mouse brain, show strong ihMTR signals in both shiverer and control mouse brains.Discussion
In this study, the ihMTR values of the CC in the rag2-/- mouse brains and optimal saturation parameters found in this study agree with previous studies [5, 7, 9]. It is interesting to note that the best contrast between CC and CX in the shiverer mouse brain was obtained at 8 kHz offset frequency, slightly lower than the 12 kHz offset frequency found in the rag2-/- mouse brains. This could be caused by differences in myelin microstructures and chemical compositions. The differences in pathological processes between different models may lead to insights into the sensitivity of ihMT. Previous EM studies demonstrated reduced number of lamellae and increased distances between them as well as increased cellularity in the shiverer mice than controls [8]. While the underlying contrast mechanisms remain unknown, one possible explanation of our result here is ihMT’s enhanced sensitivity to myelin lipid membrane.Conclusion
ihMT is more sensitive to residual myelin in the dysmyelinating shiverer mouse model than conventional MT.Acknowledgements
This study was supported in part by NIH R01 NS102904.References
1. Piredda, G.F., et al., Probing myelin content of the human brain with MRI: A review. 2021. 85(2): p. 627-652.
2. Mancini, M.A.-O., et al., An interactive meta-analysis of MRI biomarkers of myelin. LID - 10.7554/eLife.61523 [doi] LID - e61523. (2050-084X (Electronic)).
3. Varma, G., et al., Magnetization transfer from inhomogeneously broadened lines: A potential marker for myelin.Magnetic resonance in medicine, 2015. 73(2): p. 614-622.
4. Varma, G., et al., In vivo measurement of a new source of contrast, the dipolar relaxation time, T1D, using a modified inhomogeneous magnetization transfer (ihMT) sequence. 2017. 78(4): p. 1362-1372.
5. Prevost, V.H., et al., Optimization of inhomogeneous magnetization transfer (ihMT) MRI contrast for preclinical studies using dipolar relaxation time (T1D) filtering. 2017. 30(6): p. e3706.
6. Horch, R.A., J.C. Gore, and M.D. Does, Origins of the ultrashort-T2 1H NMR signals in myelinated nerve: a direct measure of myelin content? Magnetic resonance in medicine, 2011. 66(1): p. 24-31.
7. Duhamel, G., et al., Validating the sensitivity of inhomogeneous magnetization transfer (ihMT) MRI to myelin with fluorescence microscopy. (1095-9572 (Electronic)).
8. Lyczek, A., et al., Transplanted human glial-restricted progenitors can rescue the survival of dysmyelinated mice independent of the production of mature, compact myelin. Experimental Neurology, 2017. 291: p. 74-86.
9. Varma, G., et al., Interpretation of magnetization transfer from inhomogeneously broadened lines (ihMT) in tissues as a dipolar order effect within motion restricted molecules. Journal of Magnetic Resonance, 2015. 260: p. 67-76.
Figures