3701
Automated CEST Measurements for the Lateralization of Epileptic Foci in Temporal Lobe Epilepsy at 3 T1Key Laboratory for Biomedical Engineering of Ministry of Education, Department of Biomedical Engineering, College of Biomedical Engineering & Instrument Science, Zhejiang University, Hangzhou, China, 2Department of Neurology, First Affiliated Hospital, College of Medicine, Zhejiang University, Hangzhou, China, 3MR Collaboration, Siemens Healthcare Ltd., Shanghai, China
Synopsis
Chemical Exchange Saturation Transfer (CEST) imaging at 3T was applied to patients with temporal lobe epilepsy (TLE). Hippocampus and amygdala were automatically segmented, and then the magnetization transfer ratio asymmetry (MTRasym), T1, and T2 values in these regions of interest were determined. It was found that MTRasym in the hippocampus and amygdala was much more accurate than the quantitative T1 and T2 maps in predicting the seizure laterality, with an AUC value of 0.80 and a success rate of 17/20. The study indicated that CEST at 3T could potentially aid the clinical assessment of the epileptic foci in TLE patients.
Introduction
Multimodal structural and functional imaging has been used to identify the location of the seizure onset zone (SOZ) for temporal lobe epilepsy (TLE) patients. 1 However, these methods still cannot adequately localize the SOZ in a large percentage of the patients. 2 Thus, it is essential to explore new imaging technology to assist the identification of SOZ. Davis et al. has recently reported that glutamate chemical exchange saturation transfer (GluCEST) imaging at 7T can be used to lateralize the SOZ in a small sample of 4 TLE patients, 2 while 7T scanners are not uniformly available. Thus, in this study, we aim to explore whether CEST at 3T can be used to help predict the SOZ laterality with automated magnetization transfer ratio asymmetry (MTRasym) measurements in a relatively large patient group.Methods
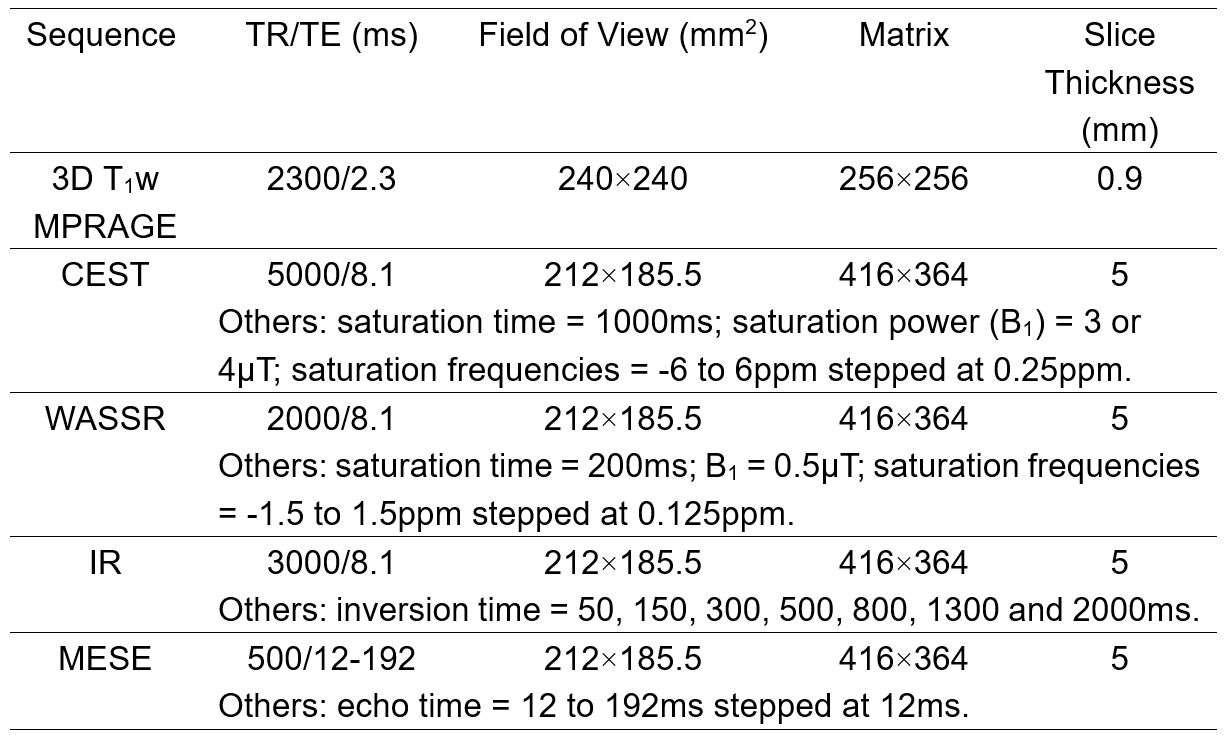
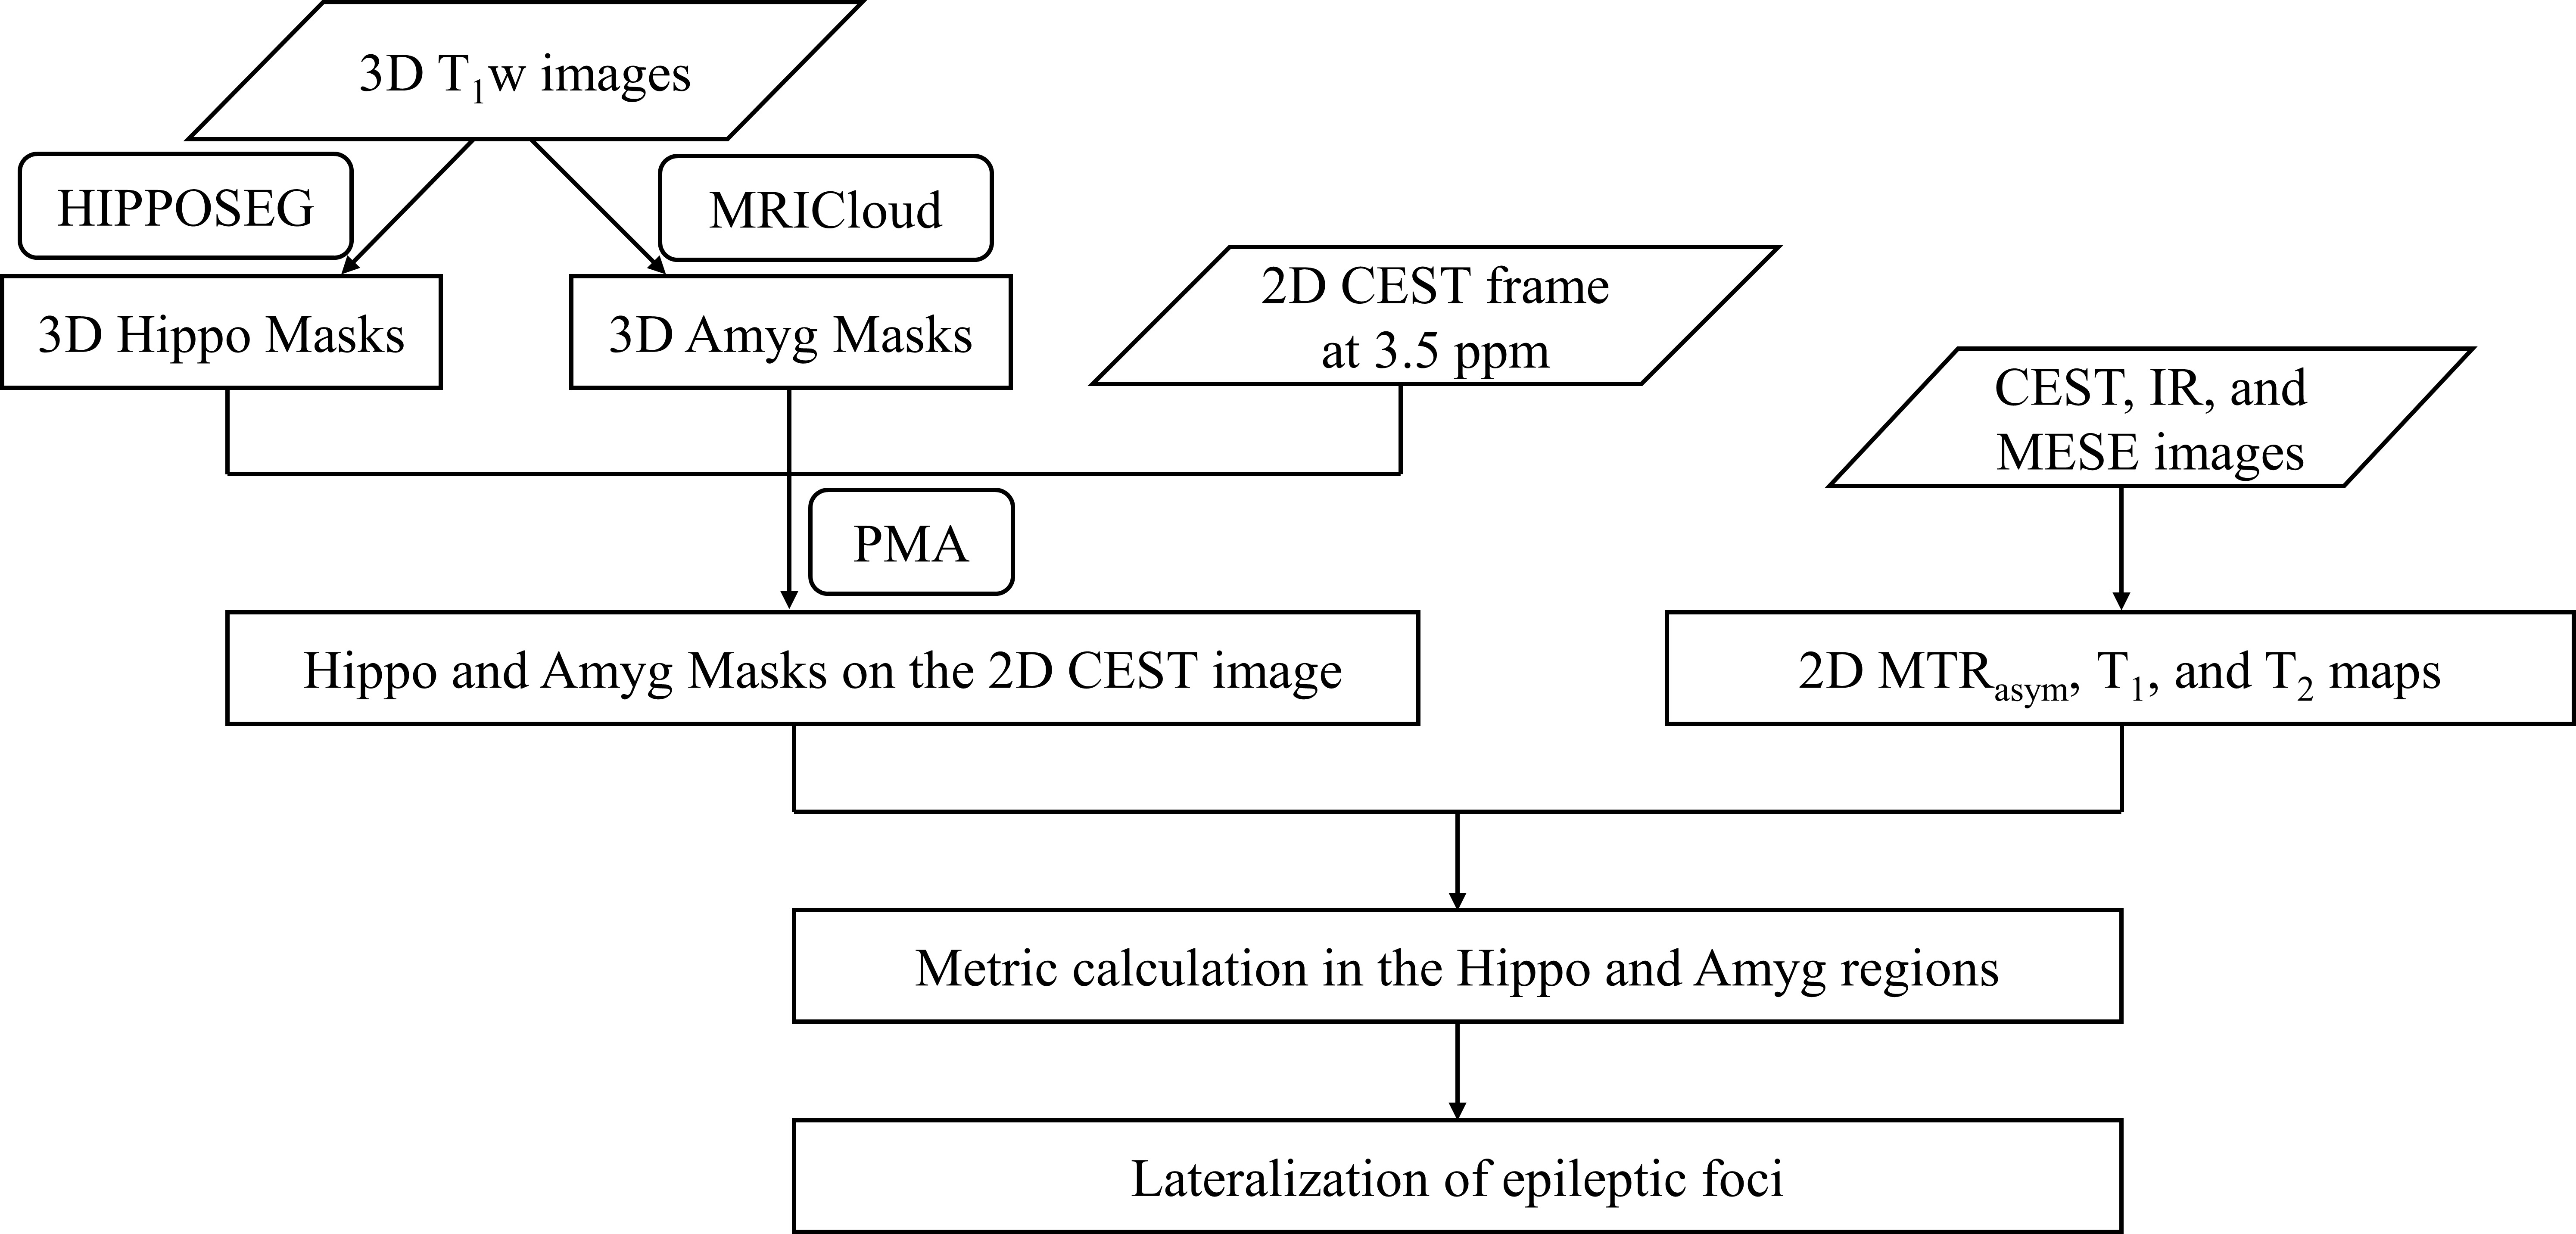
Twenty medically refractory TLE patients (6 right TLE; 14 left TLE) underwent imaging on a 3T Prisma scanner (Siemens, Erlangen, Germany) with the approval of the local IRB. The MRI protocols included a T1-weighted (T1w) anatomical 3D magnetization-prepared rapid gradient echo (MPRAGE) sequence, a CEST sequence 3 with saturation frequency offsets from -6ppm to 6ppm, a “WASSR” 4 sequence to determine the B0 field map, an inverse recovery (IR) sequence for quantitative T1 mapping, and a multi-echo spin-echo (MESE) sequence for quantitative T2 mapping. Anatomical images acquired from the MPRAGE sequence were used to locate the coronal hippocampal slice for single-slice CEST, T1 mapping, and T2 mapping sequences. Sequence parameters are shown in Table 1.Fig. 1 shows the procedures of automated data processing. Hippocampi were automatically segmented from the 3D T1w volume using HippoSeg, 5, 6 a tool for accurate hippocampal segmentation of epilepsy patients (http://niftyweb.cs.ucl.ac.uk/). Amygdalae were automatically segmented by MRICloud 7 (https://mricloud.org/). A multiplanar reconstruction from the T1w images to the single-slice CEST image was calculated using in-house software, PMA (Position Matching Algorithm) based on spatial information in the DICOM coordinate system, and similarly applied to the segmented hippocampus and amygdala masks. The reconstructed masks were then eroded by eliminating the values < 0.5. For each combination of ipsilateral hippocampus and amygdala (HA) masks, three indices were acquired, including mean MTRasym values within the frequency range of 2-4ppm, T1, and T2 values. To predict the laterality of seizure foci, two metrics were used here: M1 = I(left)-I(right); M2 = [I(left)-I(right)] / [I(left)+I(right)], where I represents the index. The area under the curve (AUC) of the receiver-operating characteristic (ROC) analysis was used to evaluate the predictive ability of these metrics.
Results
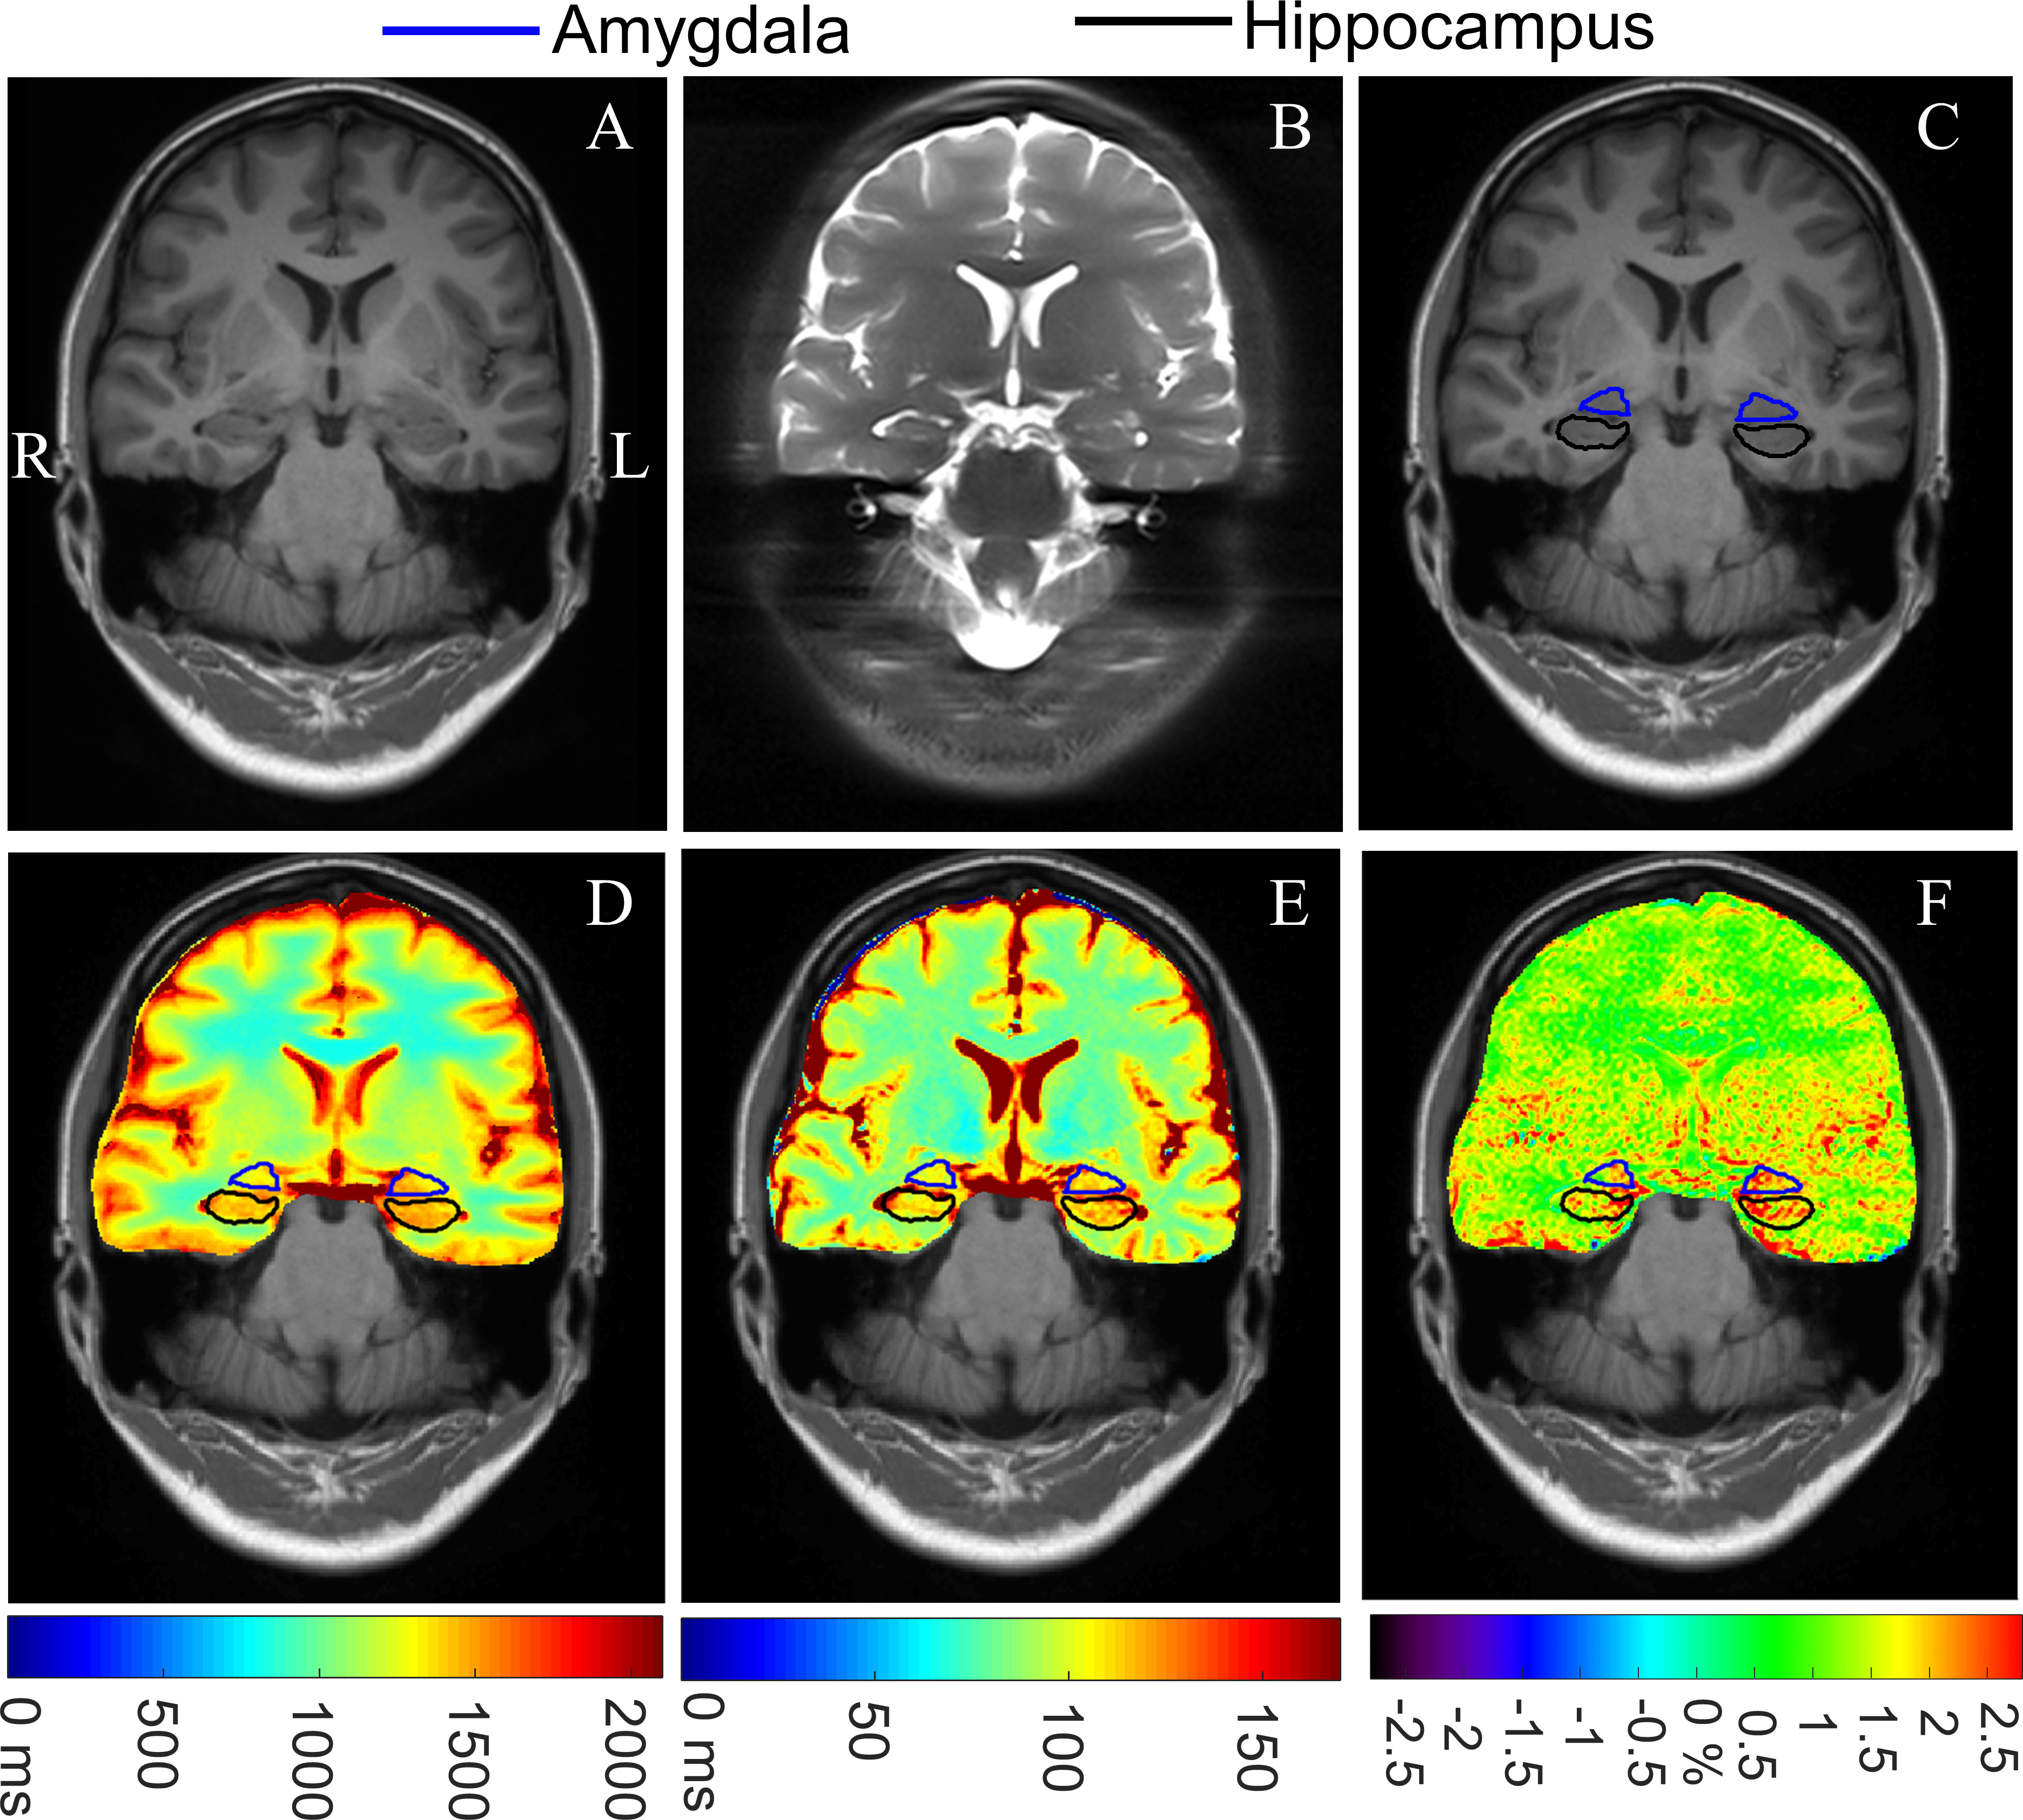
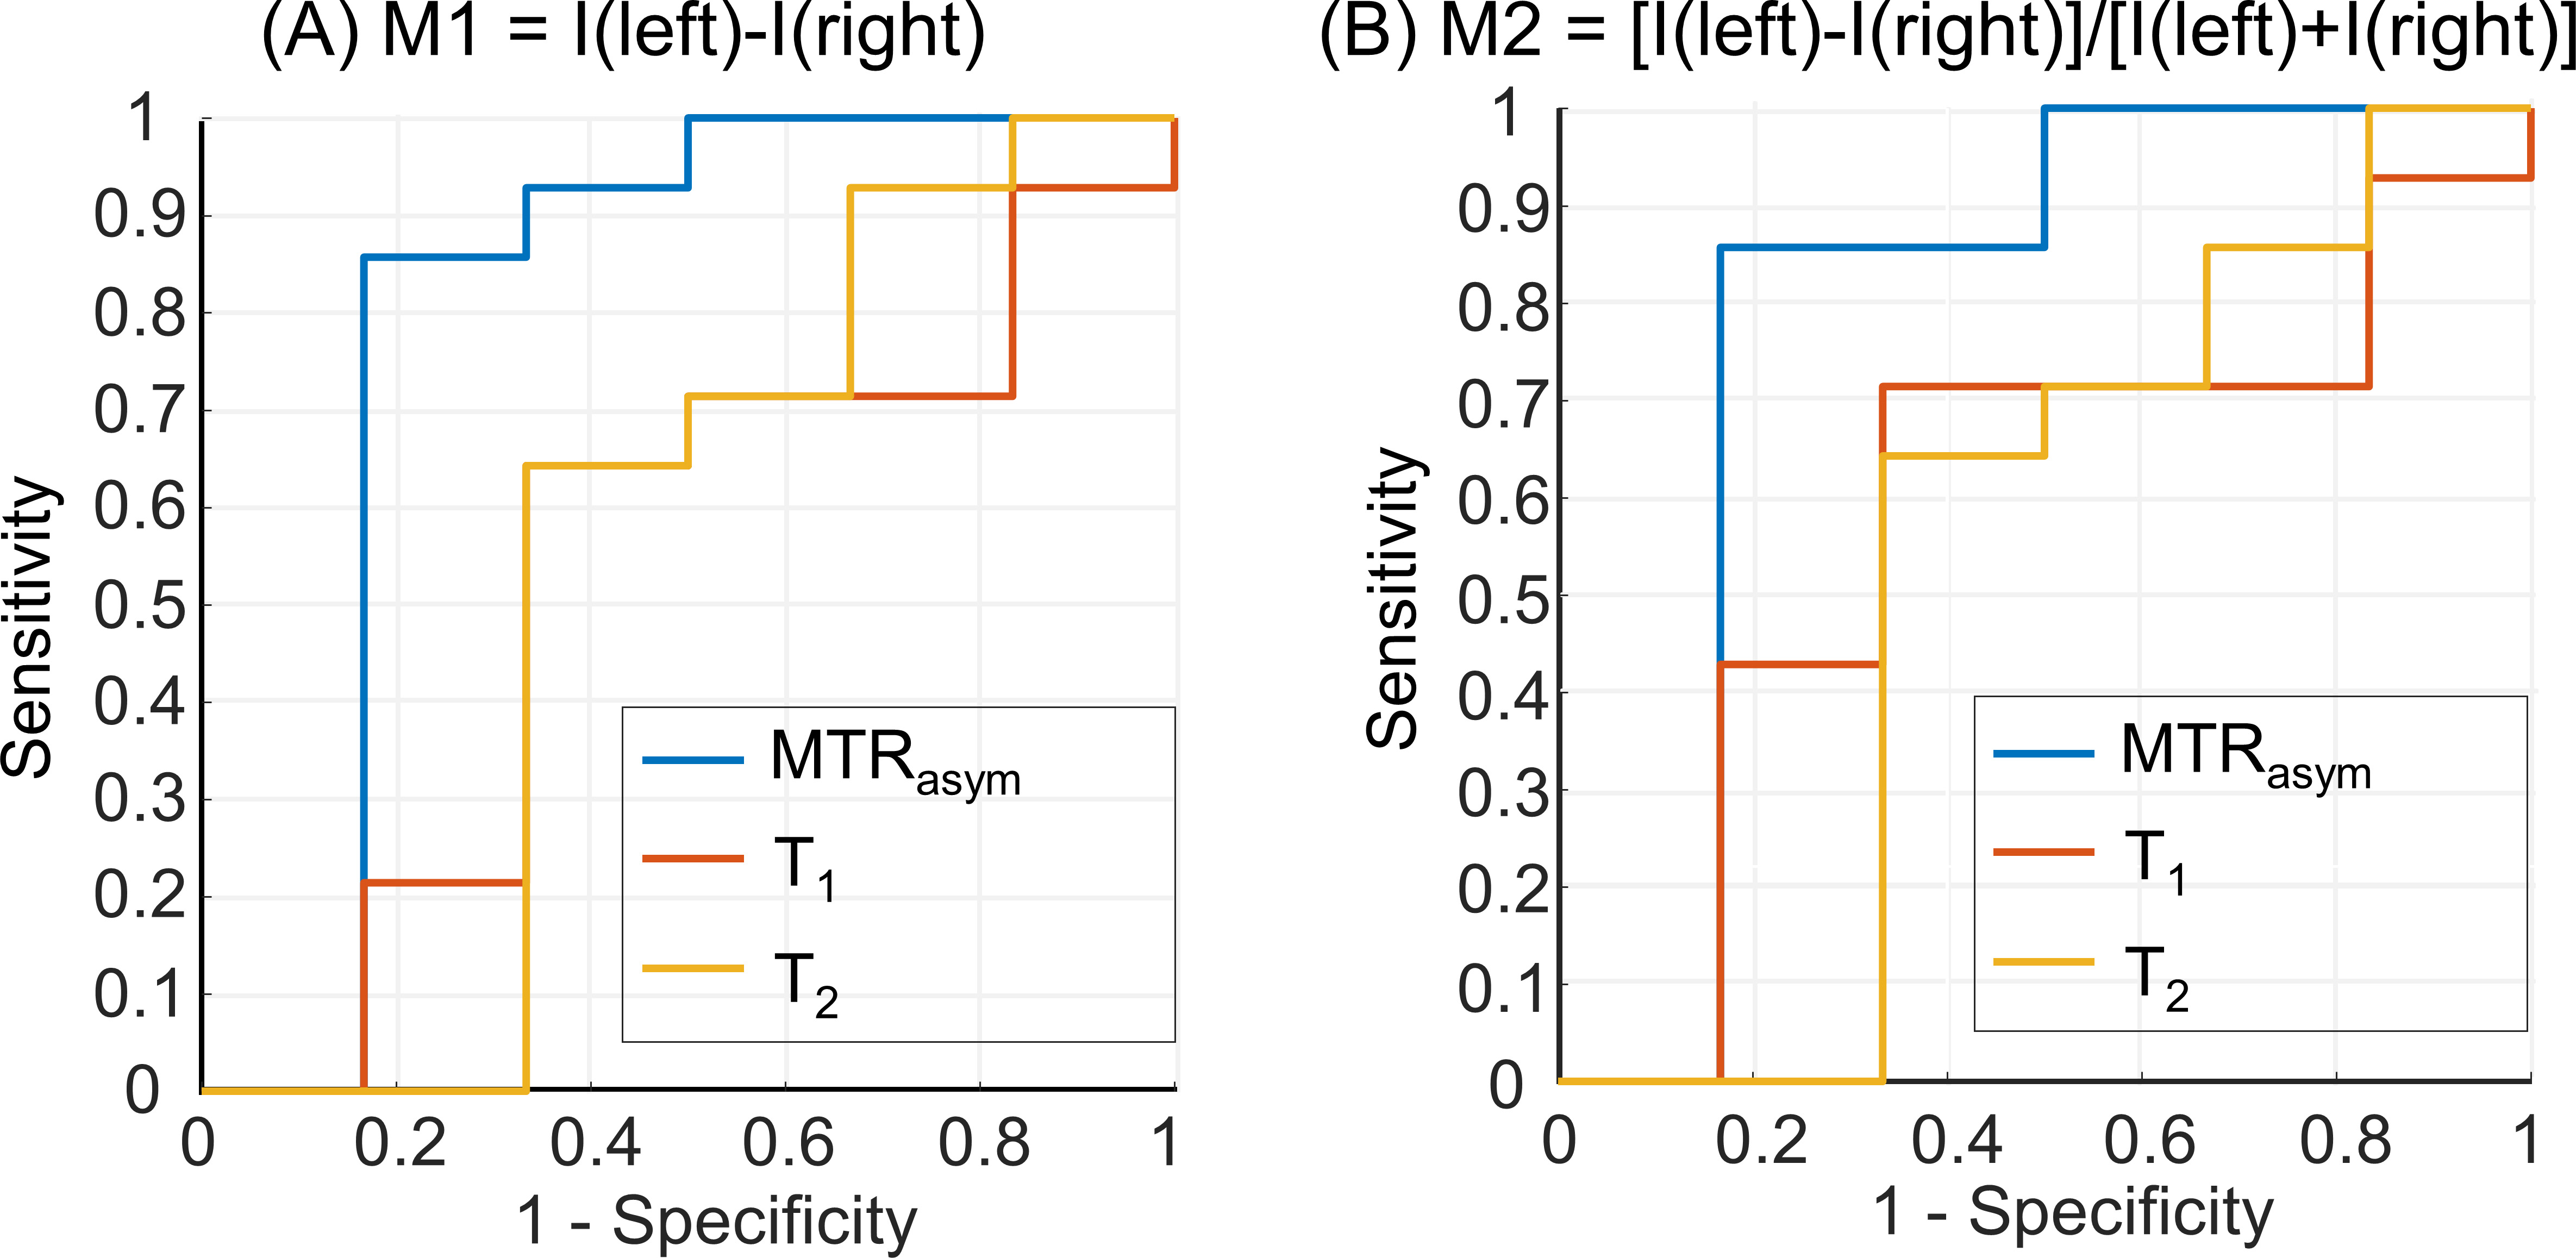
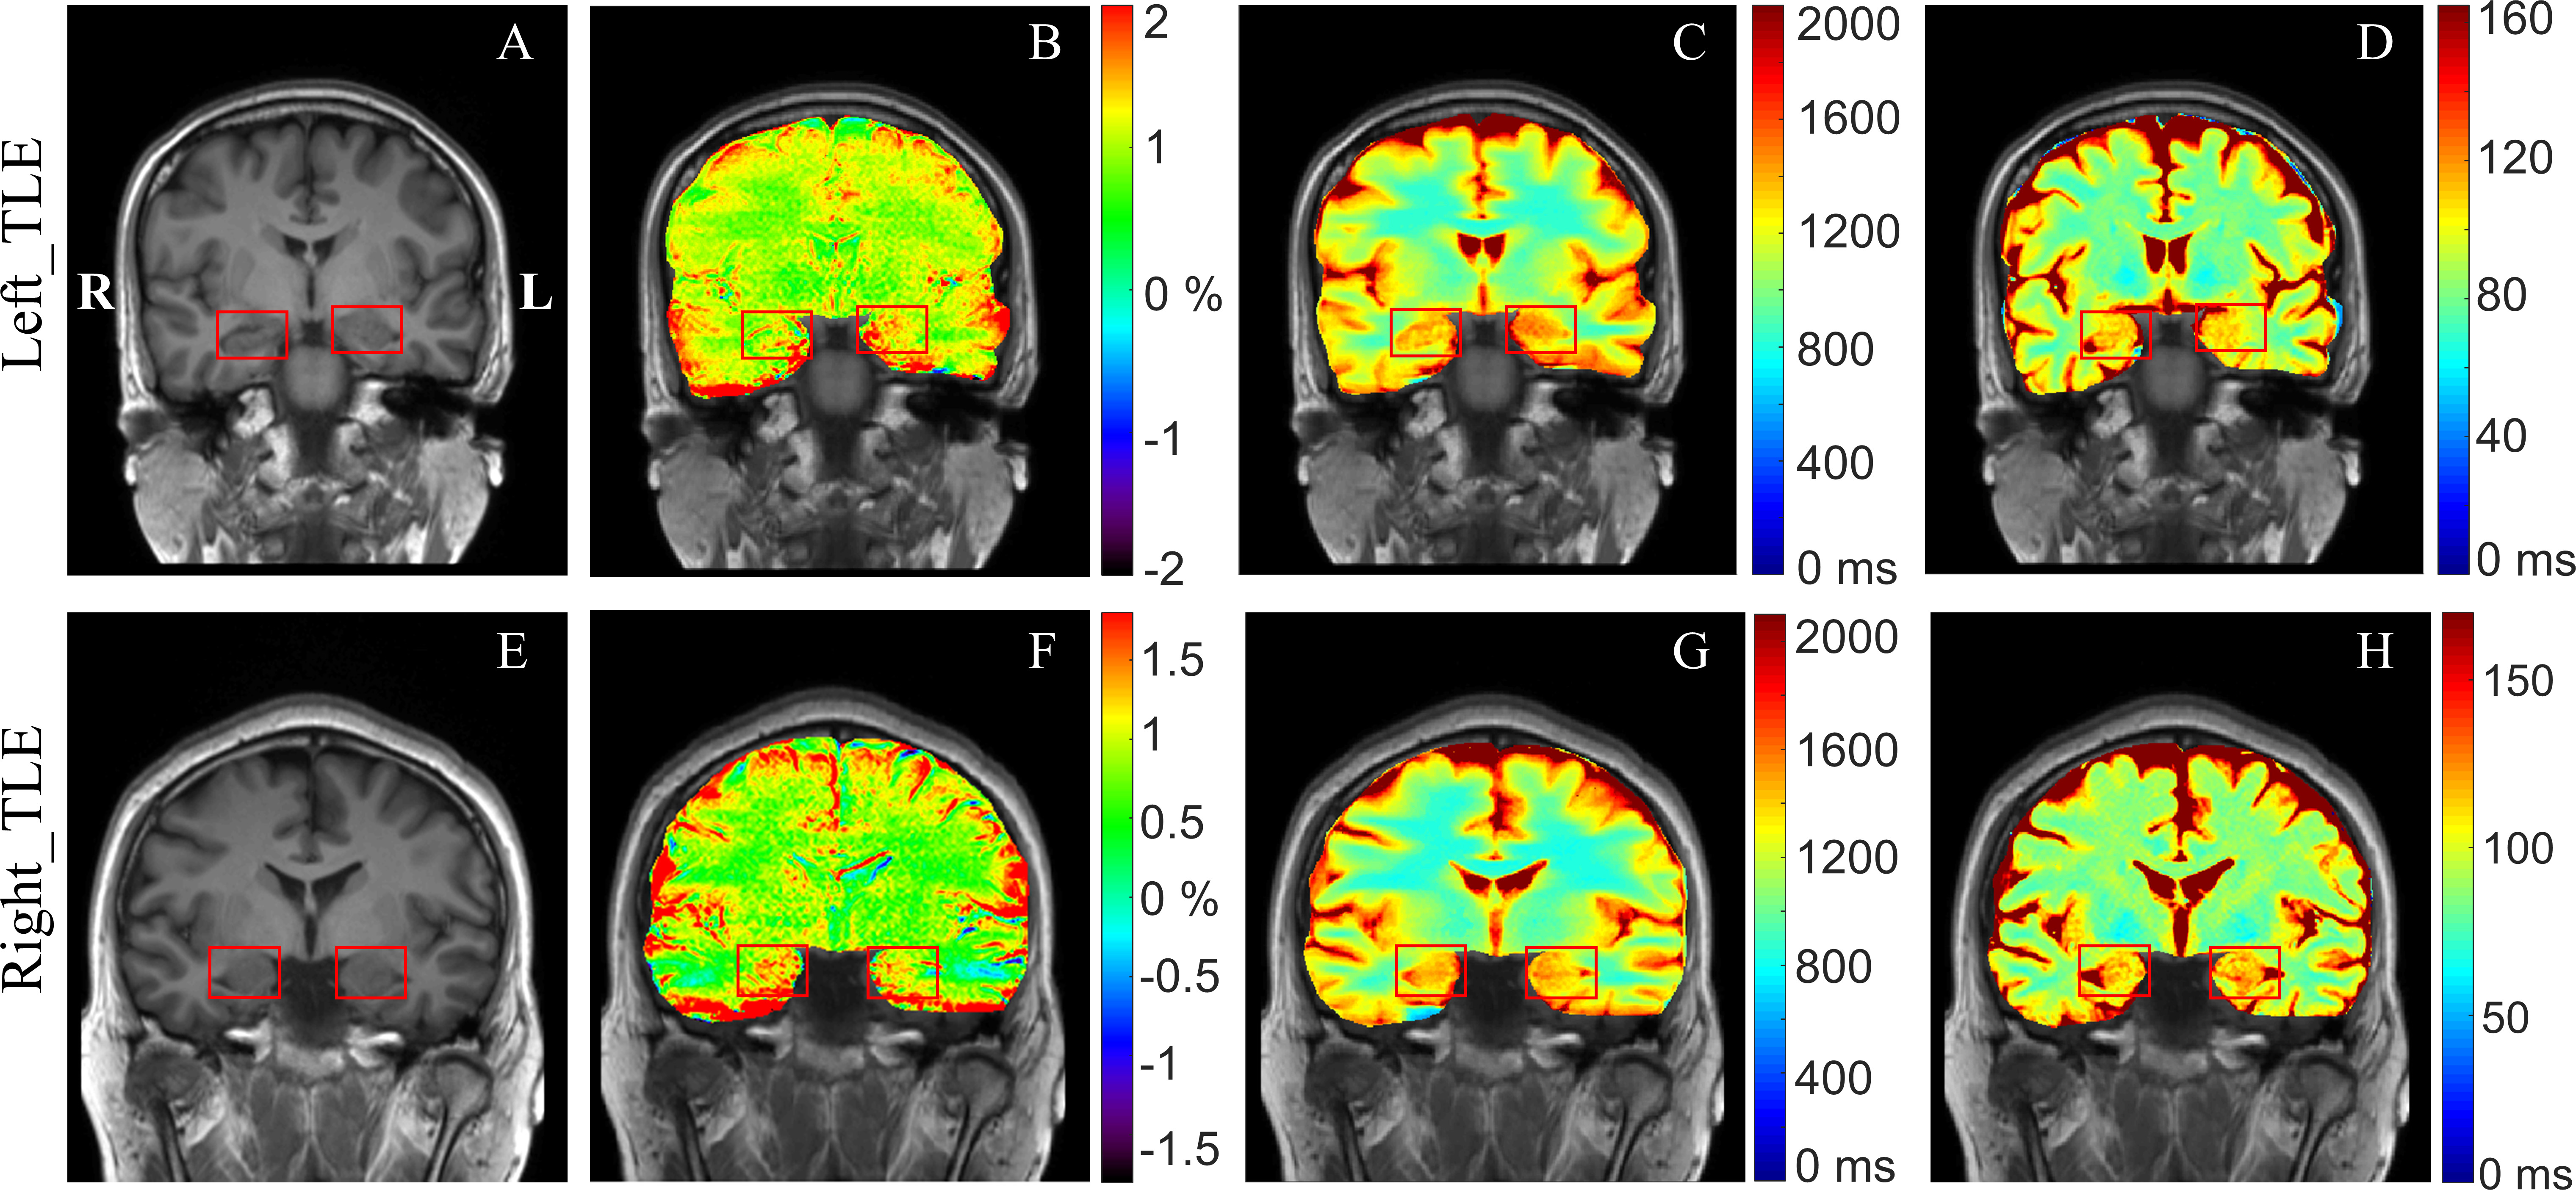
As shown in Fig. 2, the PMA tool can reconstruct a structural T1w image, and hippocampus and amygdala masks matching the position of the 2D CEST image accurately, which facilitates the automatic calculation of MTRasym, T1, and T2 indices. Paired t-test demonstrated a significant difference (P = 0.02) between the MTRasym values in the epileptogenic HA and those in the contralateral HA, while no significant difference was found for T1 comparison (P = 0.44) and T2 comparison (P = 0.40). With the automated metric calculation, ROC curves of M1 and M2 metrics using different input indices are shown in Fig. 3. For M1, the MTRasym index was the best predictor among tested ones, with an AUC value of 0.80, significantly higher than that of T1 (0.54) and T2 (0.55). Furthermore, the classification accuracy was 17 of 20 (85%) for MTRasym, reflecting improved diagnosis accuracy versus the licensed neuroradiologists with structural MRI (75%). The performance of the M2 metric was similar to that of M1, also with the AUC of MTRasym (0.79) much higher than that of T1 (0.58) and T2 (0.54). Fig. 4 shows representative structural T1w images, MTRasym maps, and quantitative T1 and T2 maps of a left TLE subject (top) and a right TLE subject (bottom). It is clear that the MTRasym values of the HA ipsilateral to the SOZ were higher than those contralateral to the SOZ. In comparison, the T2 map of the left TLE patient (Fig. 4D), T1 and T2 maps of the right TLE patient (Fig. 4G-H) did not visually indicate the hyperintensity of the SOZ.Discussion
Compared with T1, T2, and neuroradiologists’ diagnosis, the mean MTRasym values across 2-4ppm yielded superior lateralization accuracy of the seizure foci for the TLE patients. The CEST signal could have contributions from various metabolites, among which we speculated that the amine protons 2 might play a leading role. A limitation should be noticed that the number of right TLE patients was much smaller than that of the left TLE patients. As for future work, we will conduct a comprehensive analysis of MTRasym signals at specific frequencies to investigate the underlying molecular contributor and enroll more right TLE patients.Conclusion
CEST imaging at 3T is a powerful modality for predicting the seizure laterality in TLE patients, which significantly outperformed conventional quantitative T1 and T2 mapping. Our study can potentially facilitate the clinical application of CEST MRI in identifying the epileptic foci of TLE patients.Acknowledgements
NSFC grant number: 81971605, 61801421.References
1. Pustina D, Avants B, Sperling M, et al. Predicting the laterality of temporal lobe epilepsy from PET, MRI, and DTI: A multimodal study. Neuroimage Clin. 2015;9:20-31.
2. Davis KA, Nanga RP, Das S, et al. Glutamate imaging (GluCEST) lateralizes epileptic foci in nonlesional temporal lobe epilepsy. Sci Transl Med. 2015;7(309):309ra161-309ra161.
3. Liu R, Zhang H, Niu W, et al. Improved chemical exchange saturation transfer imaging with real-time frequency drift correction. Magn Reson Med. 2019;81(5):2915-2923.
4. Kim M, Gillen J, Landman BA, Zhou J, van Zijl PC. Water saturation shift referencing (WASSR) for chemical exchange saturation transfer (CEST) experiments. Magn Reson Med. 2009;61(6):1441-1450.
5. Ferran Prados MJC, Ninon Burgos, Claudia AM Wheeler-Kingshott, Sebastien Ourselin. NiftyWeb: web based platform for image processing on the cloud. International Society for Magnetic Resonance in Medicine (ISMRM) 24th Scientific Meeting and Exhibition. 2016:Singapore.
6. Winston GP, Cardoso MJ, Williams EJ, et al. Automated hippocampal segmentation in patients with epilepsy: available free online. Epilepsia. 2013;54(12):2166-2173.
7. Mori S, Wu D, Ceritoglu C, et al. MRICloud: Delivering High-Throughput MRI Neuroinformatics as Cloud-Based Software as a Service. Computing in Science & Engineering. 2016;18(5):21-35.
Figures